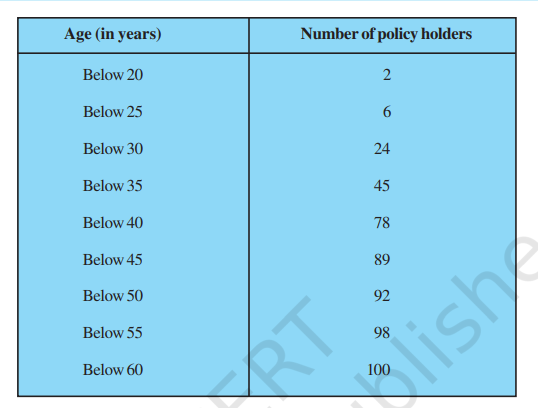
A life insurance agent found the following data about distribution of ages of 100 policy holders. Calculate the median age. [ Policies are given only to persons having age 18 years onwards but less than 60 years.]
![A life insurance agent found the following data about distribution of ages of 100 policy holders. Calculate the median age. [ Policies are given only to persons having age 18 years onwards but less than 60 years.]](https://d10lpgp6xz60nq.cloudfront.net/physics_images/NCERT_GUJ_MAT_X_C14_E03_003_Q01.png)
The correct Answer is:Median age = 35.76 years
Topper's Solved these Questions
- STATISTICSBook:NCERT GUJARATIChapter:STATISTICSExercise:Exercise 14.4
Explore 3 Videos
- STATISTICSBook:NCERT GUJARATIChapter:STATISTICSExercise:Do this
Explore 3 Videos
- STATISTICSBook:NCERT GUJARATIChapter:STATISTICSExercise:Exercise 14.2
Explore 6 Videos
- SIMILAR TRIANGLES Book:NCERT GUJARATIChapter:SIMILAR TRIANGLES Exercise:TRY THIS
Explore 6 Videos
- TANGENTS AND SECANTS TO A CIRCLEBook:NCERT GUJARATIChapter:TANGENTS AND SECANTS TO A CIRCLEExercise:Try this
Explore 2 Videos
Similar Questions
A life insurance agent found the following data for distribution of ages of 100 policy holders. Calculate the median age, if policies are given only to persons having age 18 years onwards but less than 60 year.
View SolutionA life insurance agent found the following data for distribution of ages of 100 policy holders. Calculate the median age, if policies are given only to persons having age 18 years onwards but less than 60 years.
Age (in years)Number of policy holdersAge (in years)Number of policy holdersBelow 20 2Below 45 89Below 25 6Below 50 92Below 30 24Below 55 98Below 35 45Below 60 100Below 40 78
View Solution
Knowledge Check
A life insurance agent found the following data for distribution of ages of 100 policy holders. A policy holder is chosen at random.
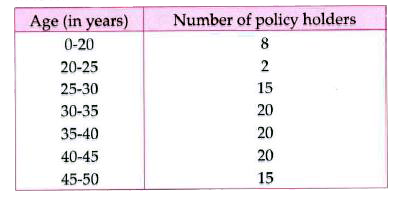
Probability of policy holders chosen randomly of age less than 25 years isA1/5B1/10C1/100D2/25A life insurance agent found the following data for distribution of ages of 100 policy holders. A policy holder is chosen at random.
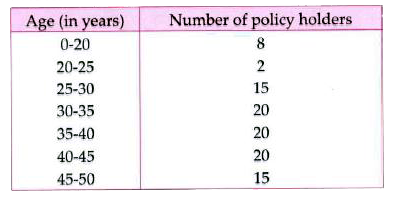
Find the sum of probabilities if a policy holder are chosen randomly of age (0-20) years and policy holders of age (25-30) yearsA3/20B2/25C23/100D3/25
A life insurance agent found the following data for distribution of ages of 100 policy holders. Calculate the median age, if policies are only given to persons having age 18 years onwards but less than 60 years. Age(inyears) Numberofpolicyholders Below20 2 Below25 6 Below 30 24 Below 35 45 Below 40 78 Below 45 89 Below 50 92 Below 55 98 Below 60 100
View SolutionA life insurance agent found the following data for distribution of ages of 100 policy holders. A policy holder is chosen at random.
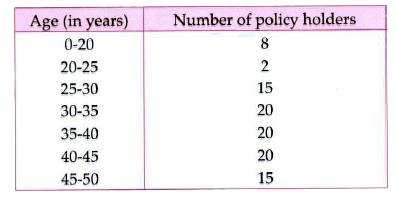
Find the difference between the probabili ties if policy holders are chosen randomly of age (30-35) years and of age (45-50) years.
View SolutionCalculate the standard deviation for the following data giving the age distribution of persons.

Calculate the mean of these differences and their standard deviation.
View SolutionStudy the following graph and answer the question based on the graph.
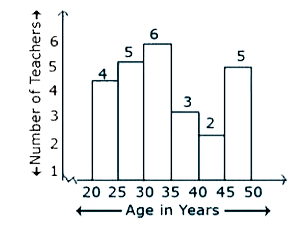
How many teachers are aged 45 years or more but less than 50 years?
View SolutionThe following is the cumulative frequency distribution (of less than type) of 1000 persons each of age of 20 years and above. Determine the mean age.

View SolutionStudy the given graph and answer the question that follows
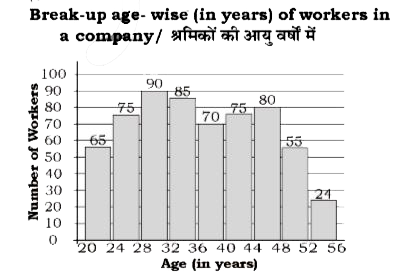
the number of workers whose age is 32 years or more but less than 44 years is:
View Solution
