The P - V diagram shows seven curved paths (connected by vertical paths) that can be followed by a gas. Which two of them should be parts of a closed cycle if the net work done by the gas is to be at its maximum value
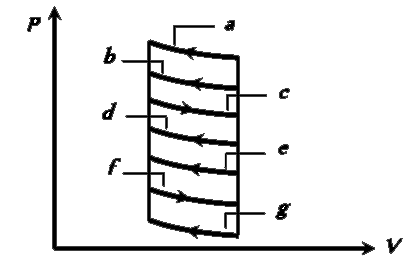
ac
cg
af
cd
The correct Answer is:C
Step by step video, text & image solution for The P - V diagram shows seven curved paths (connected by vertical paths) that can be followed by a gas. Which two of them should be parts of a closed cycle if the net work done by the gas is to be at its maximum value by Physics experts to help you in doubts & scoring excellent marks in Class 11 exams.
Topper's Solved these Questions
Similar Questions
The P -V diagram here shows six curved paths ( connected by vertical paths ) that can be followed by a gas , which two of the curved paths should be part of a closed cycle ( those curved paths plus connecting vertical paths ) if the net work done by the gas during the cycle is to be at its positive value ?
 View Solution
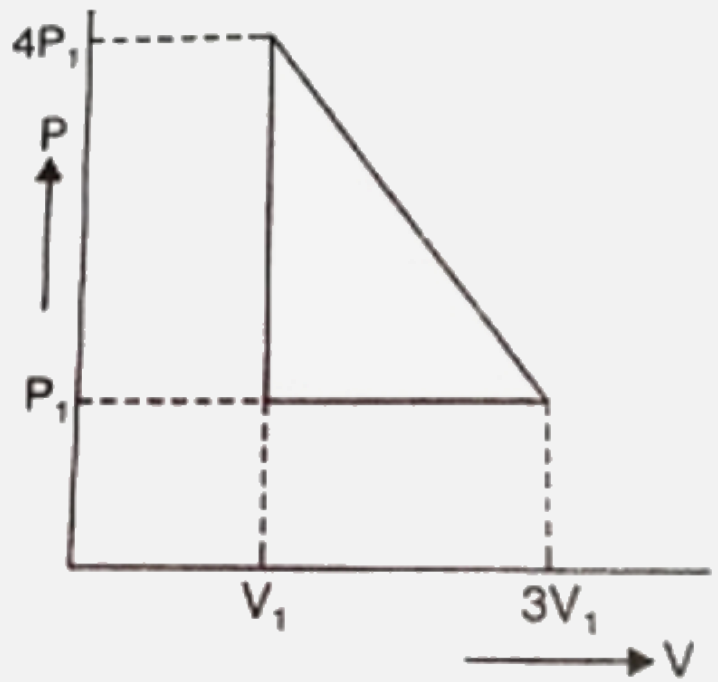
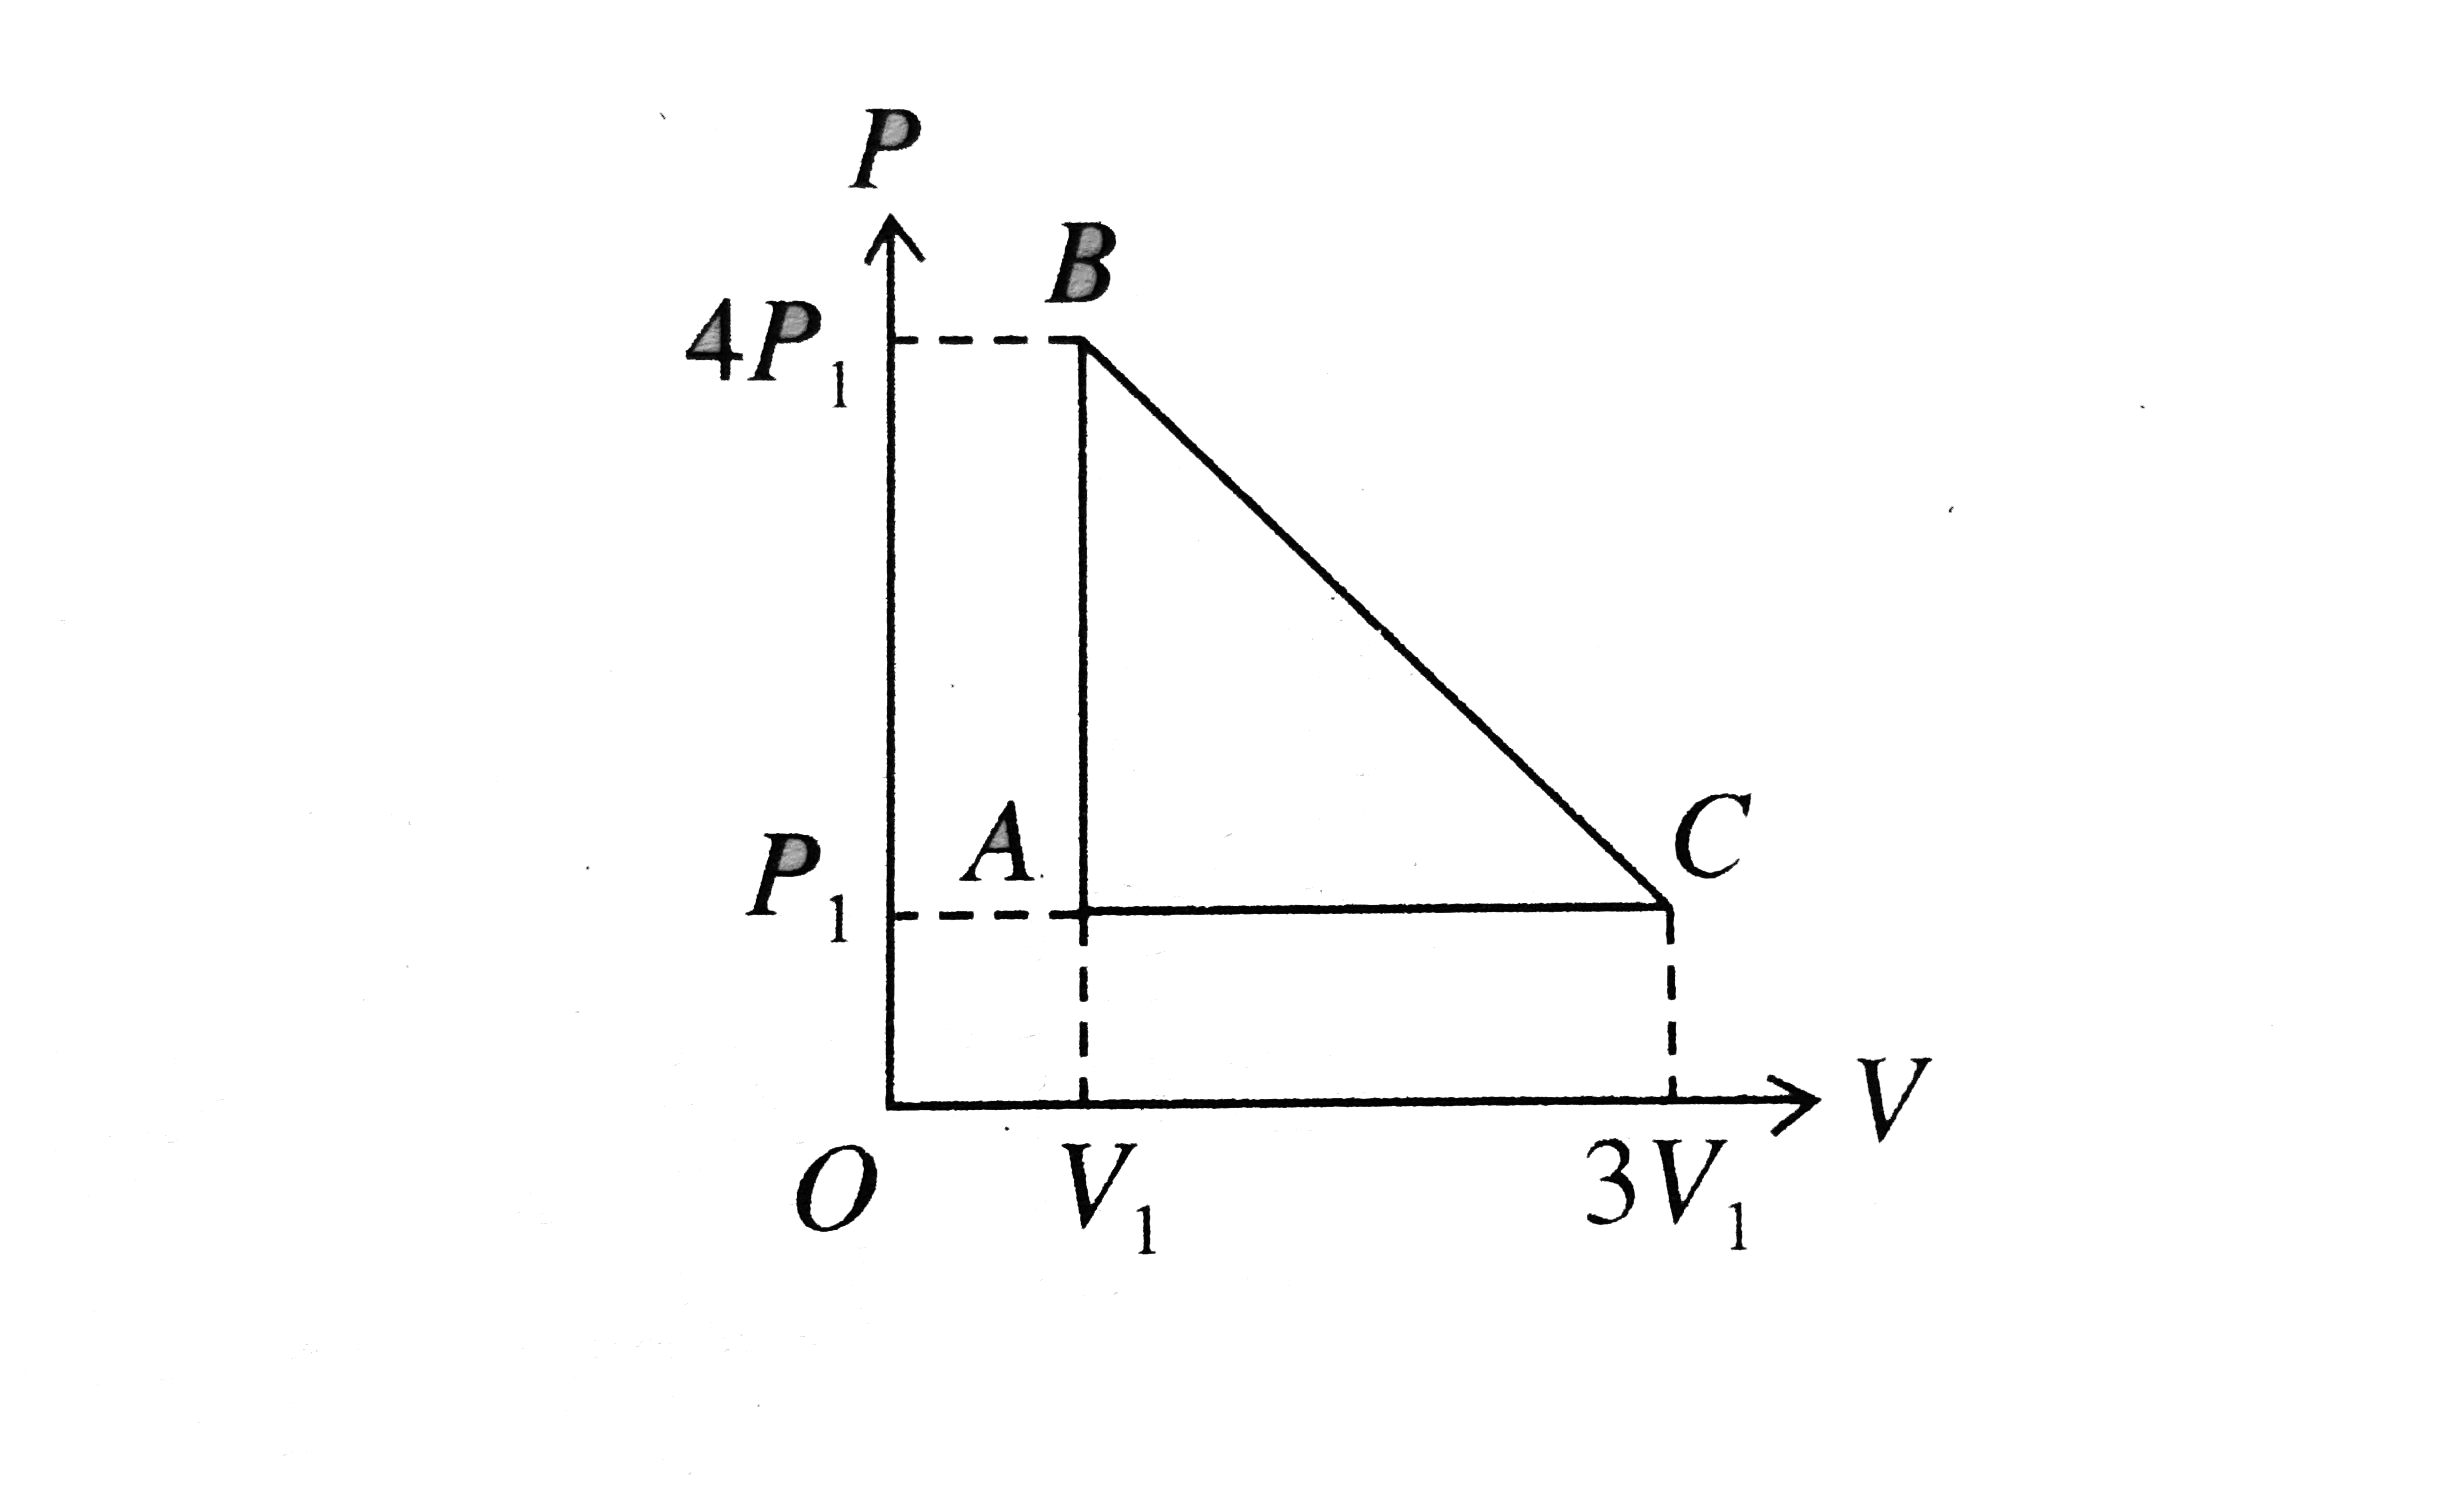
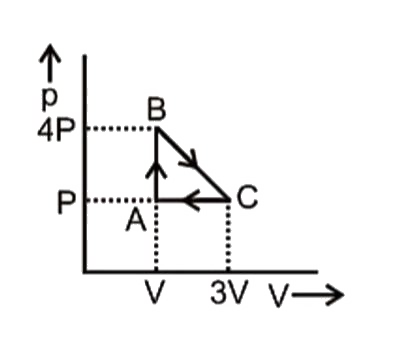
An ideal gas is taken around the cycle ABCA as shown in P-V diagram. The net work done by the gas during the cycle is equal to:
 View Solution
Knowledge Check
- Question 1 - Select One
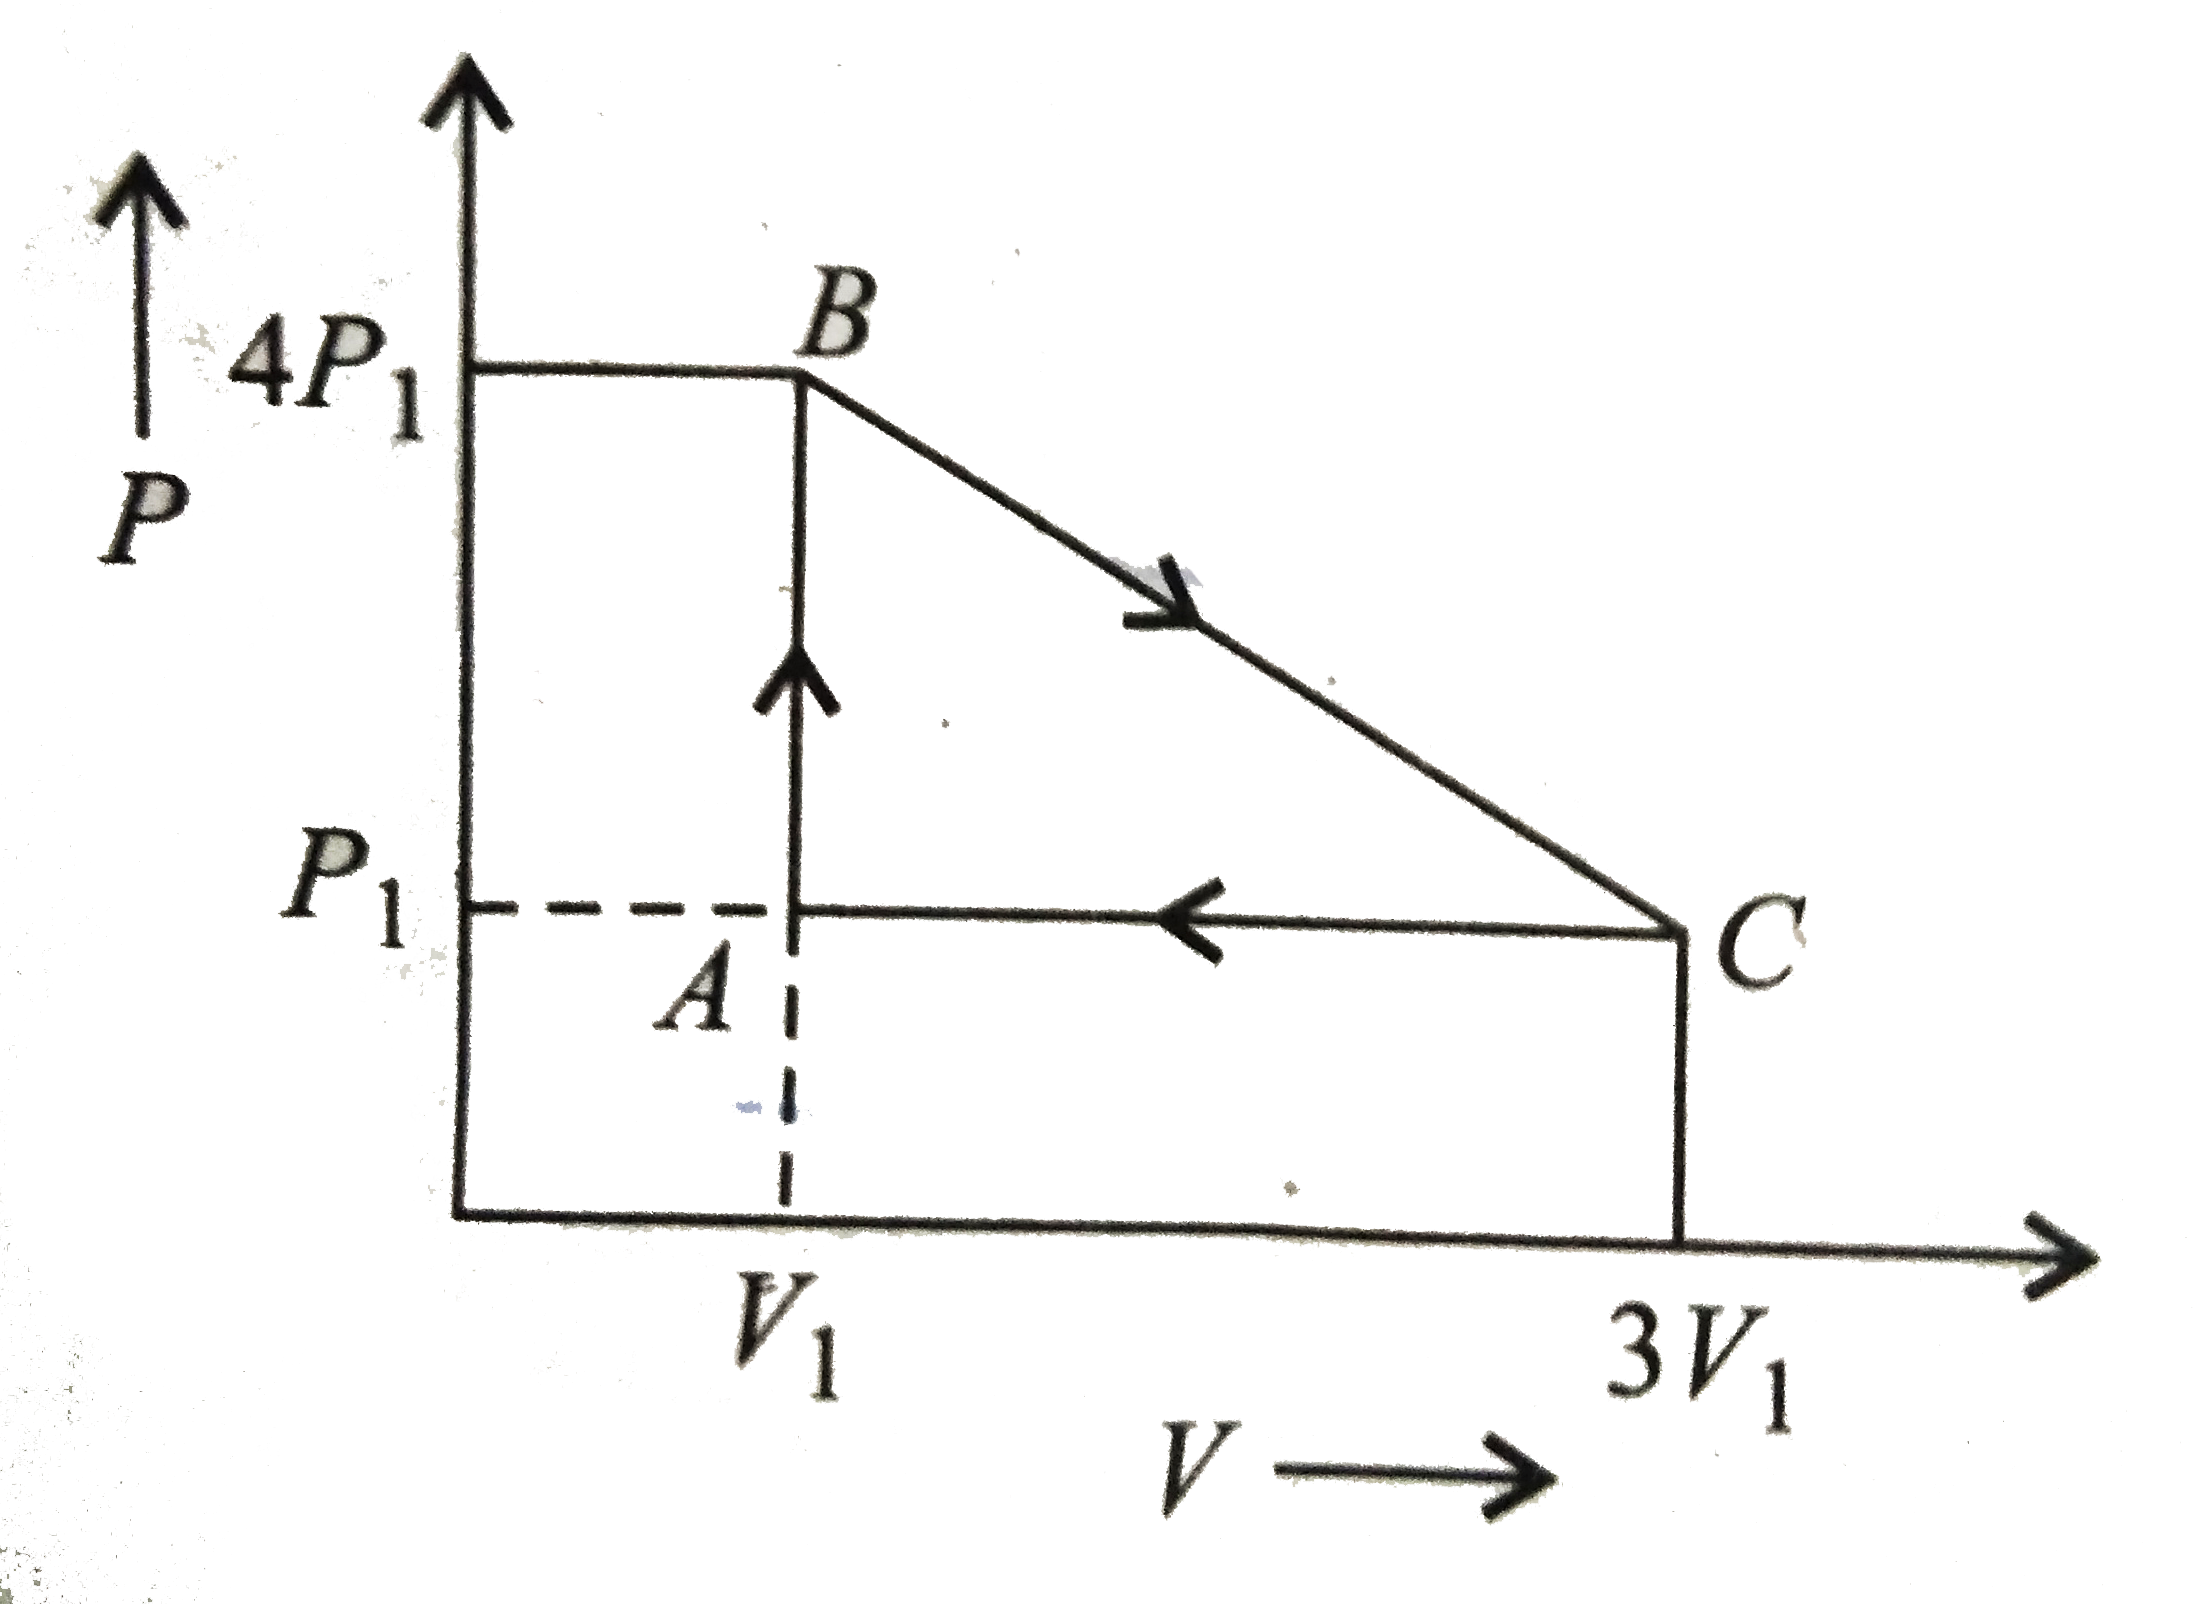
An ideal gas is taken around the cycle ABCA as shown in P-V diagram. The net work done by the gas during the cycle is equal to :
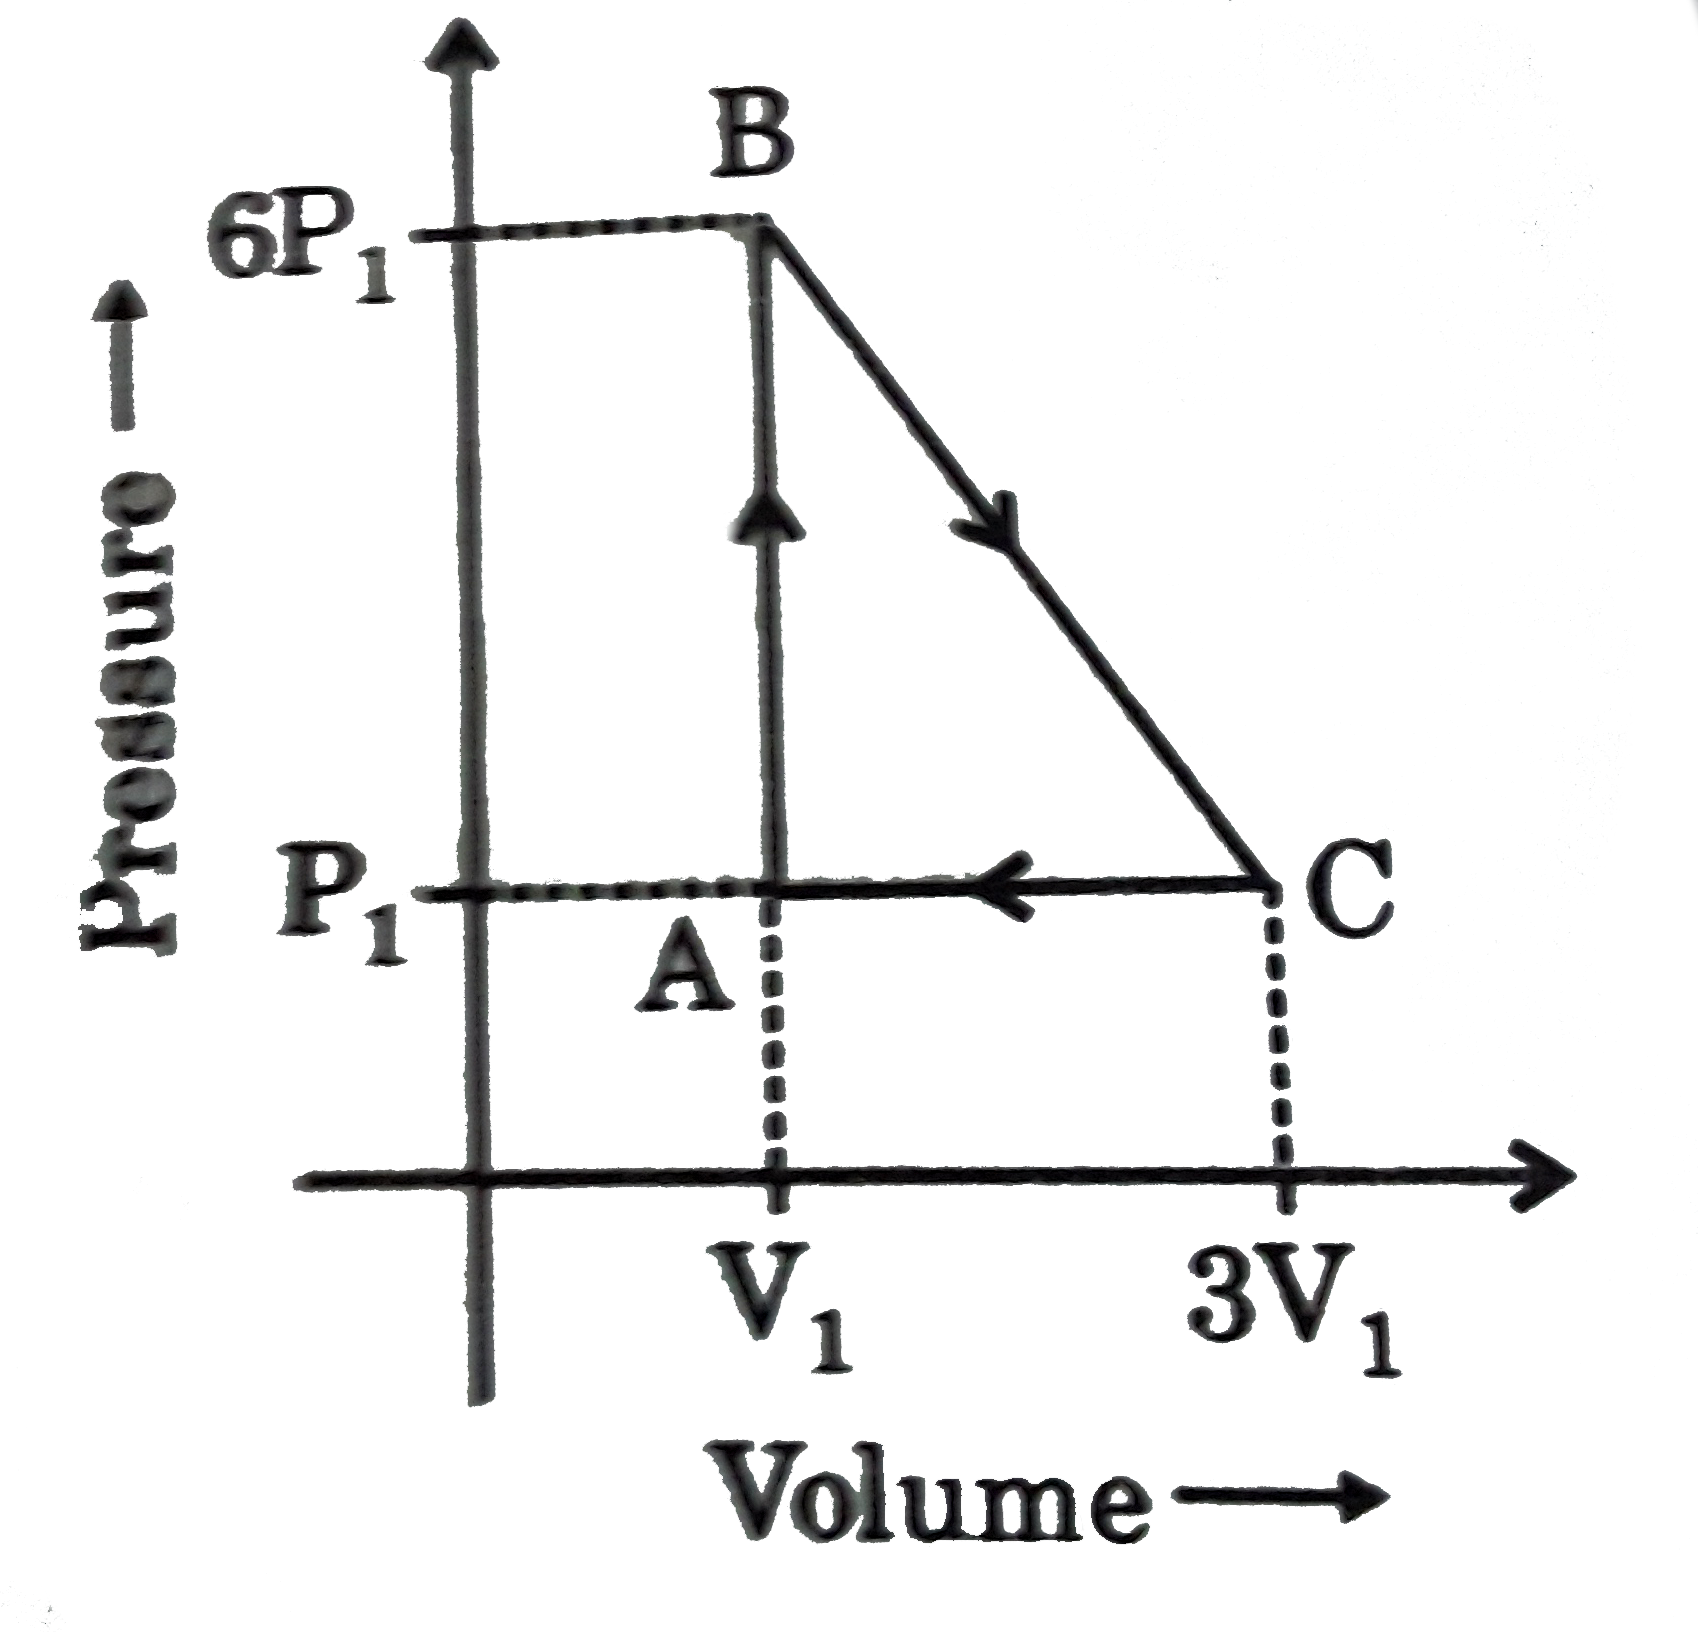 A12P1V1B6P1V1C5P1V1DP1V1
 - Question 2 - Select One
An ideal gas is taken around the cycle ABCA shown in P−V diagram. The net work done by the gas during the cycle is equal to
 A12P1V1B6P1V1C3P1V1DP1V1
 - Question 3 - Select One
An ideal gas is taken around the cycle ABCA as shown in P−V diagram. The net work done by the gas during the cycle is equal to:
A12P1V1B6P1V1C5P1V1DP1V1
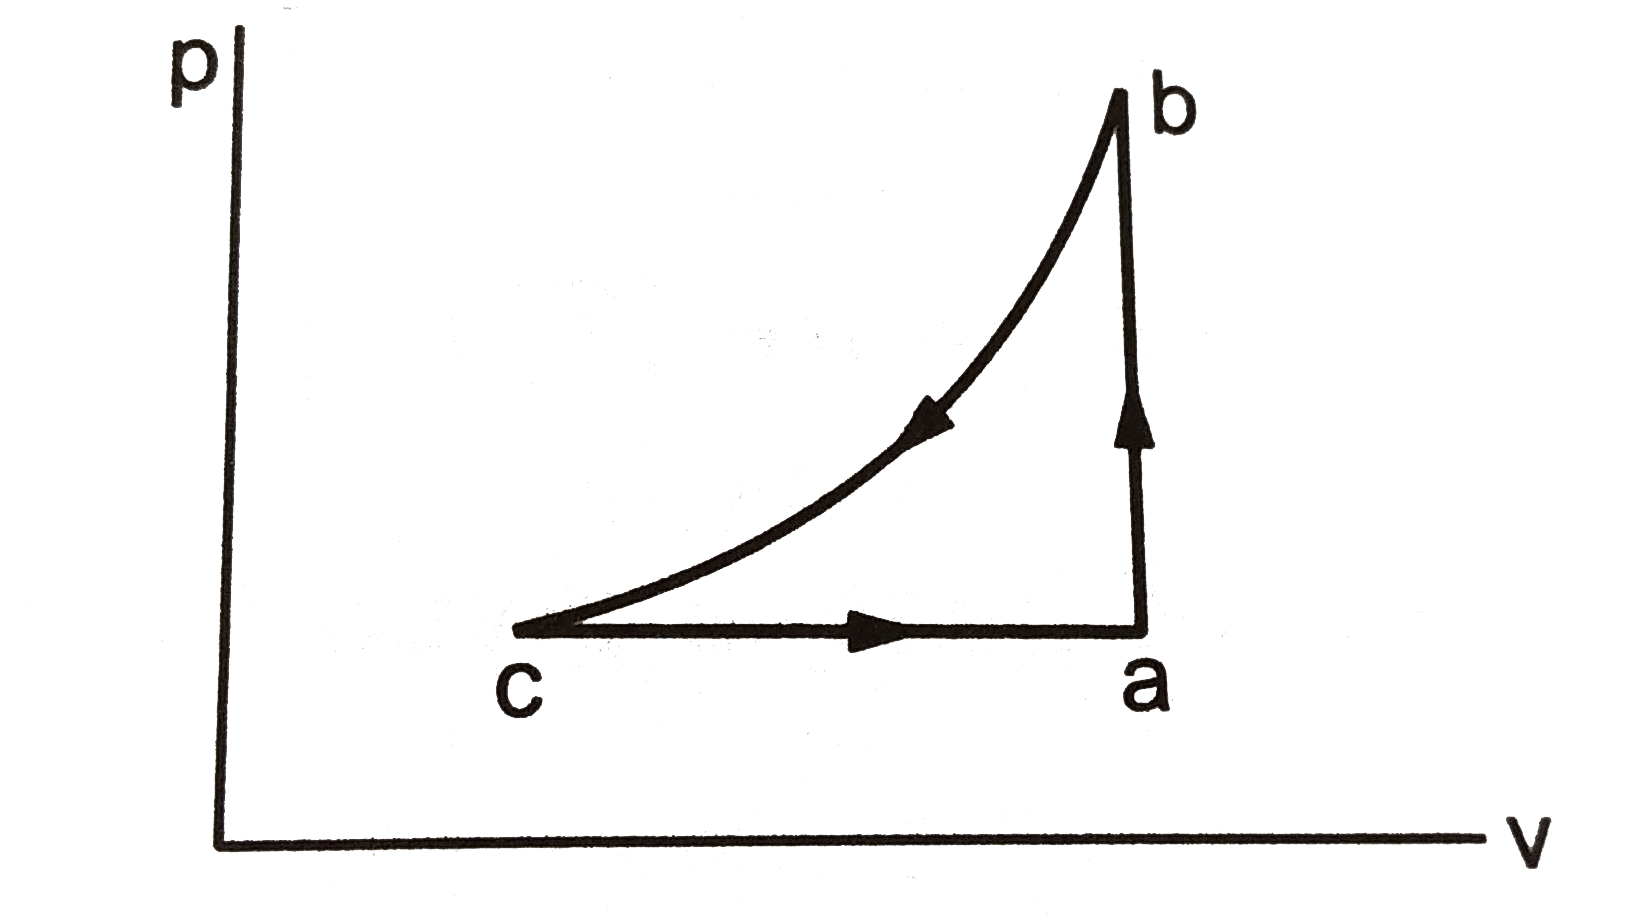
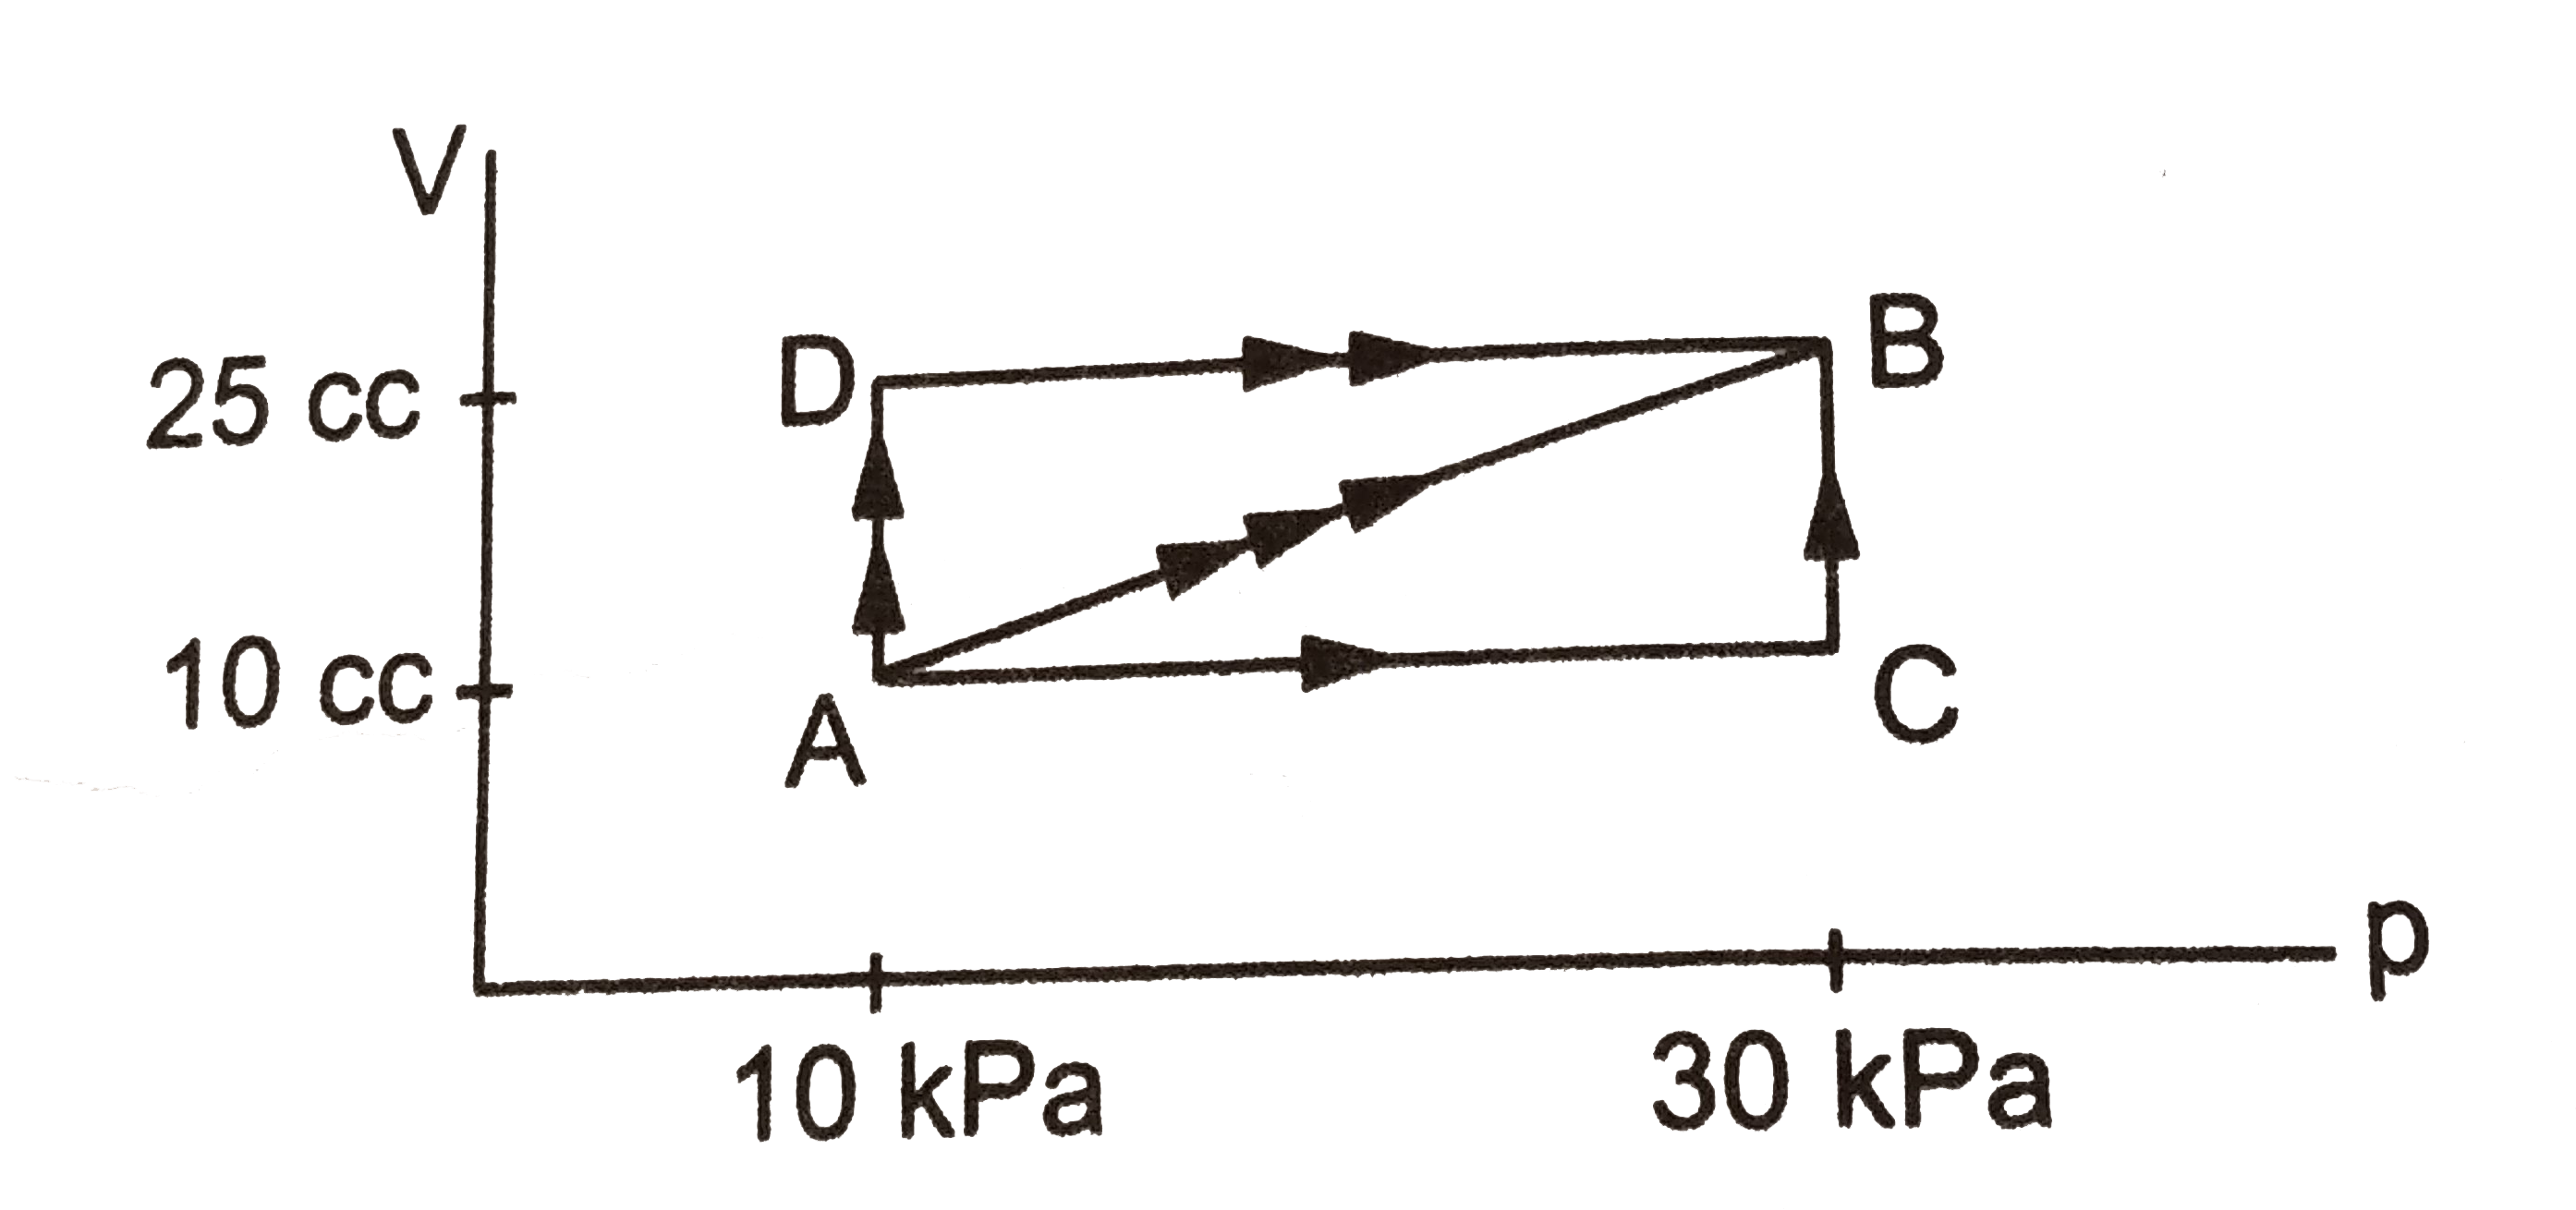
shows three paths through which a gas can be taken from the state A to the state B. calculate the work done by the gas in each of the three paths.
 View Solution
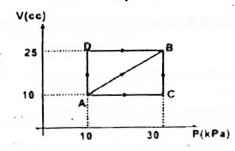
Figure shows three paths through which a gas can be taken from the state A to the state B. Calculate the work done by the gas in each of the three paths.
 View Solution
An ideal gas is taken around the cycle ABCA as shown in the P-V diagram. The total work done by the gas during the cycle is
 View Solution
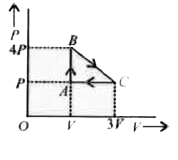
An ideal gas is taken around the cycle ABCA as shown in the P-V diagram.
The total work done by the gas during the cycle is
 View Solution
An ideal gas is taken around the cycle ABCD shown in the PV diagram below. The net work done by the gas during the cycle is equal to
 View Solution

