Which of the following graphs correctly represents the variation of β=−dV/dPV
with P for an ideal gas at constant temperature?


The correct Answer is:A
Step by step video, text & image solution for Which of the following graphs correctly represents the variation of beta=-(dV//dP)/V with P for an ideal gas at constant temperature? by Physics experts to help you in doubts & scoring excellent marks in Class 11 exams.
Topper's Solved these Questions
Similar Questions
Knowledge Check
- Question 1 - Select One
Which of the following graphs correctly represents the variation of β=−dV/dPV
with P for an ideal gas at constant temperature?A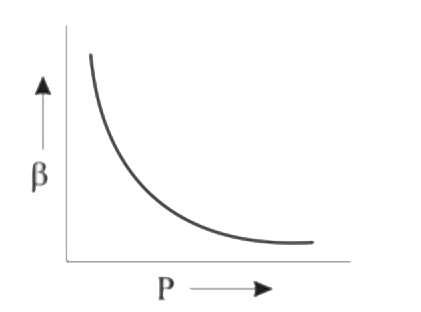 B
B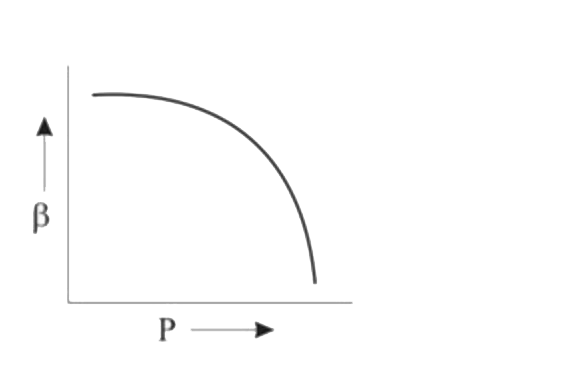 C
C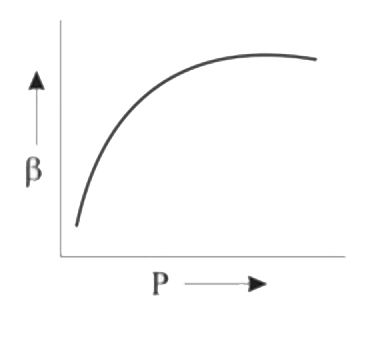 D
D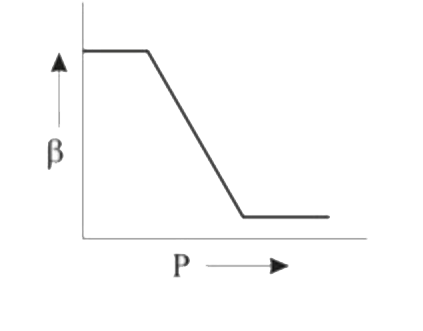
- Question 2 - Select One
Which of the following graph is correctly represented?
A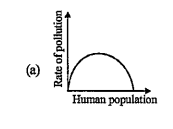 B
B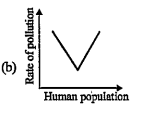 C
C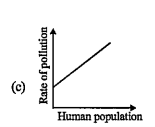 D
D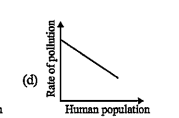
- Question 3 - Select One
Which of the following graphs correctly represents the variation of β=−(dVdP)1V with P for an ideal gas at constant temperature ?
A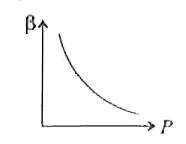 B
B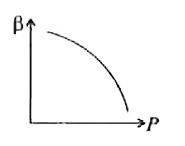 C
C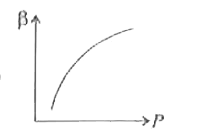 D
D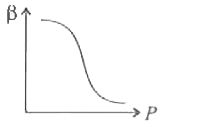
Which of following graphs correctly represent variation of α=−(dV/dP)TV with P for fixed amount of an ideal gas at constant temperature ?
View SolutionWhich of the following graphs represent the behaviour of an ideal gas ?
View SolutionWhich one of the following graphs correctly gives the ideal gas behaviour ?
View SolutionThe velocity -displacement graph of a particle is as shown in the figure. Which of the following graphs correctly represents the variation of acceleration with displacement?
 View Solution
At a constant pressure, of the following graphs that one which represents the variation of the density of an ideal gas with the absolute temperature T, is
View Solution

