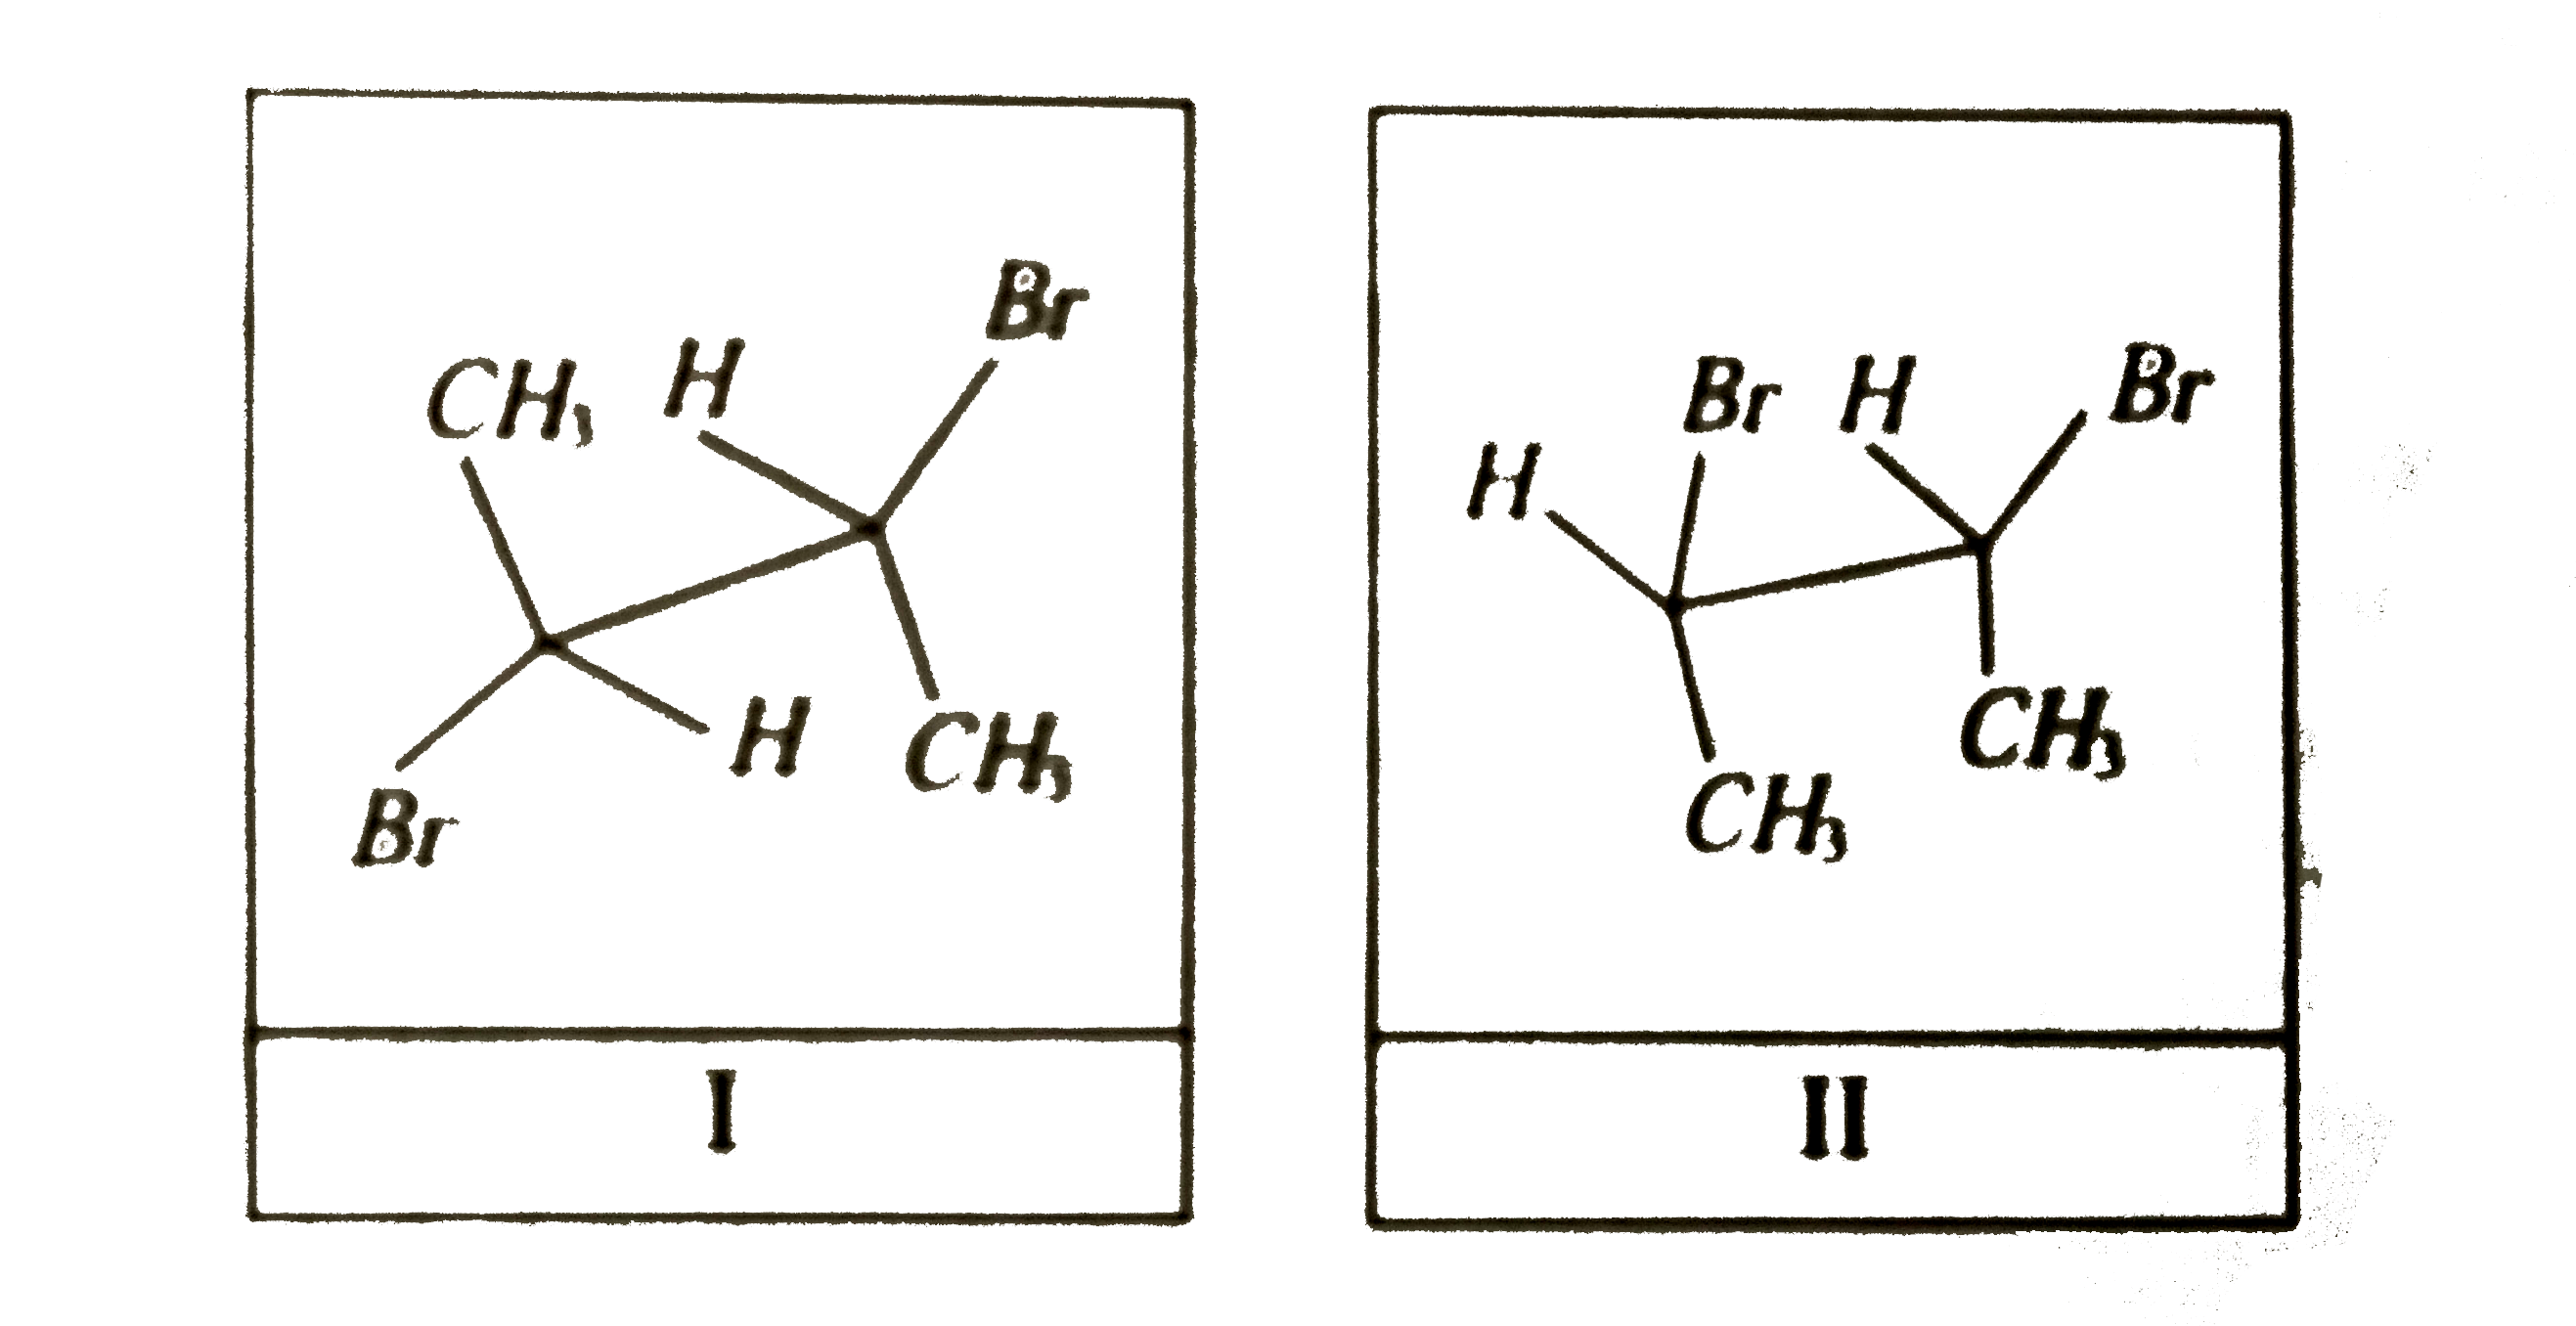
In the given diagrma I and II indicate
Chromomere and chromonemata
Centromere and secondary constriction
Secondary constriction and satellite
Telomere and satellite
The correct Answer is:D
Step by step video, text & image solution for In the given diagrma I and II indicate by Biology experts to help you in doubts & scoring excellent marks in Class 11 exams.
Updated on:21/07/2023Topper's Solved these Questions
Similar Questions
Knowledge Check
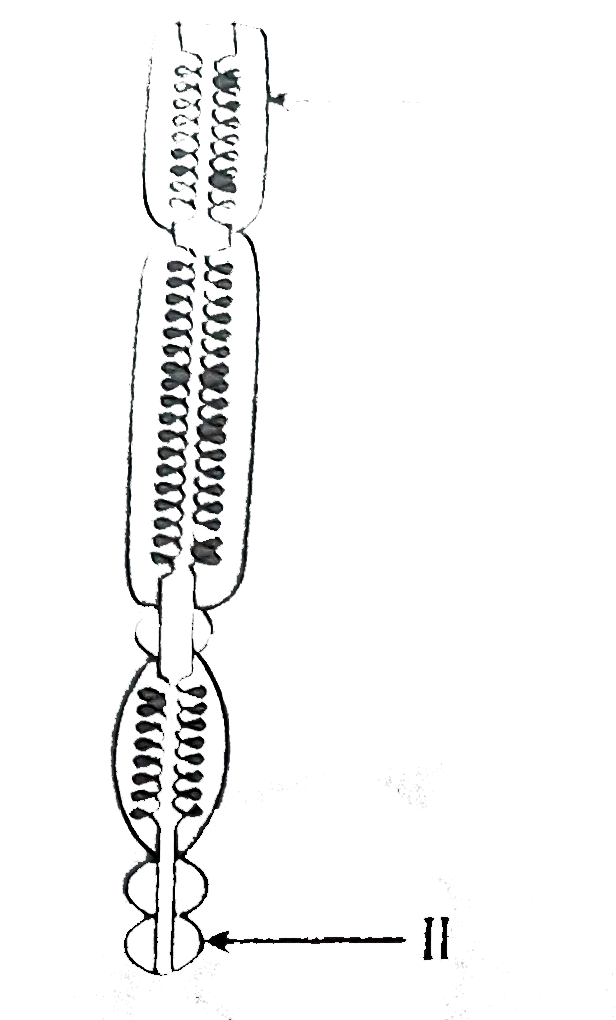
The given figure is an enlarged view of one microsporagium of a matured anther, identify A, B and C
 AA-Midle layer, Endothecium, C-TapetumBA-Endothecium, B-Tapetum, C-Middle layerCA-Endothecium, B-Middle layer, C-TapetumDA-Tapetum,B-Middle layer, C-Endothecium
The given figure illustrates the changes in lung volume during the process of breathing. The change from II to III indicates the :-
AExpansion of ribsBMovement of air out of the thoracic cageCMovement of diaphragm away from the lungsDMovement of air out of the lungsThe given figure illustrates the changes in lung volume during the process of breathing.
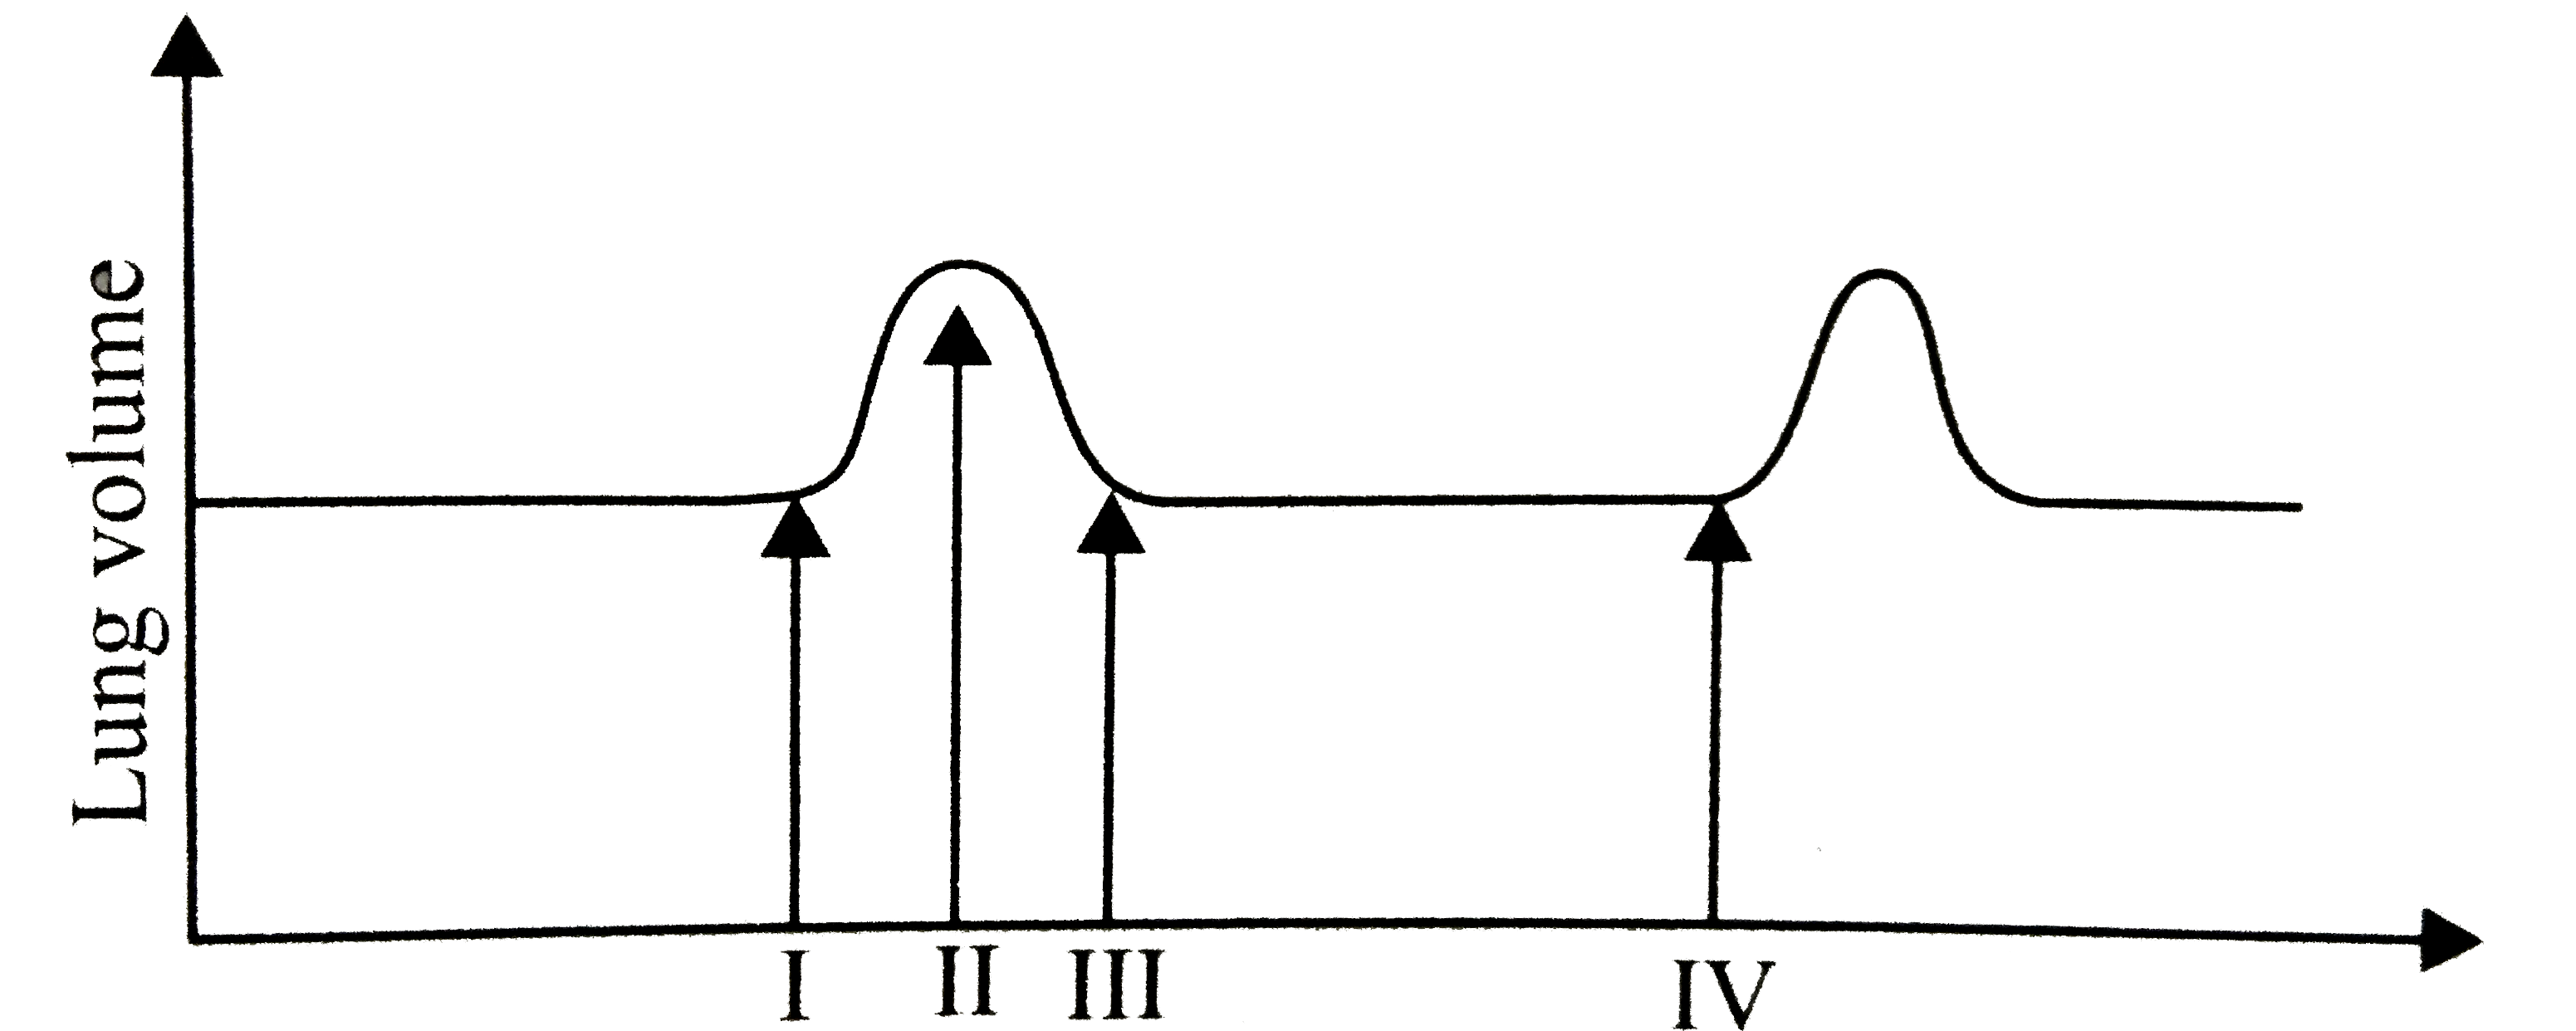
The changes from II to III indicates theAmovement of diaphragm away from the lungsBexpansion of the thoracic cavityCmovement of air out of the lungsDexpansion of ribs.
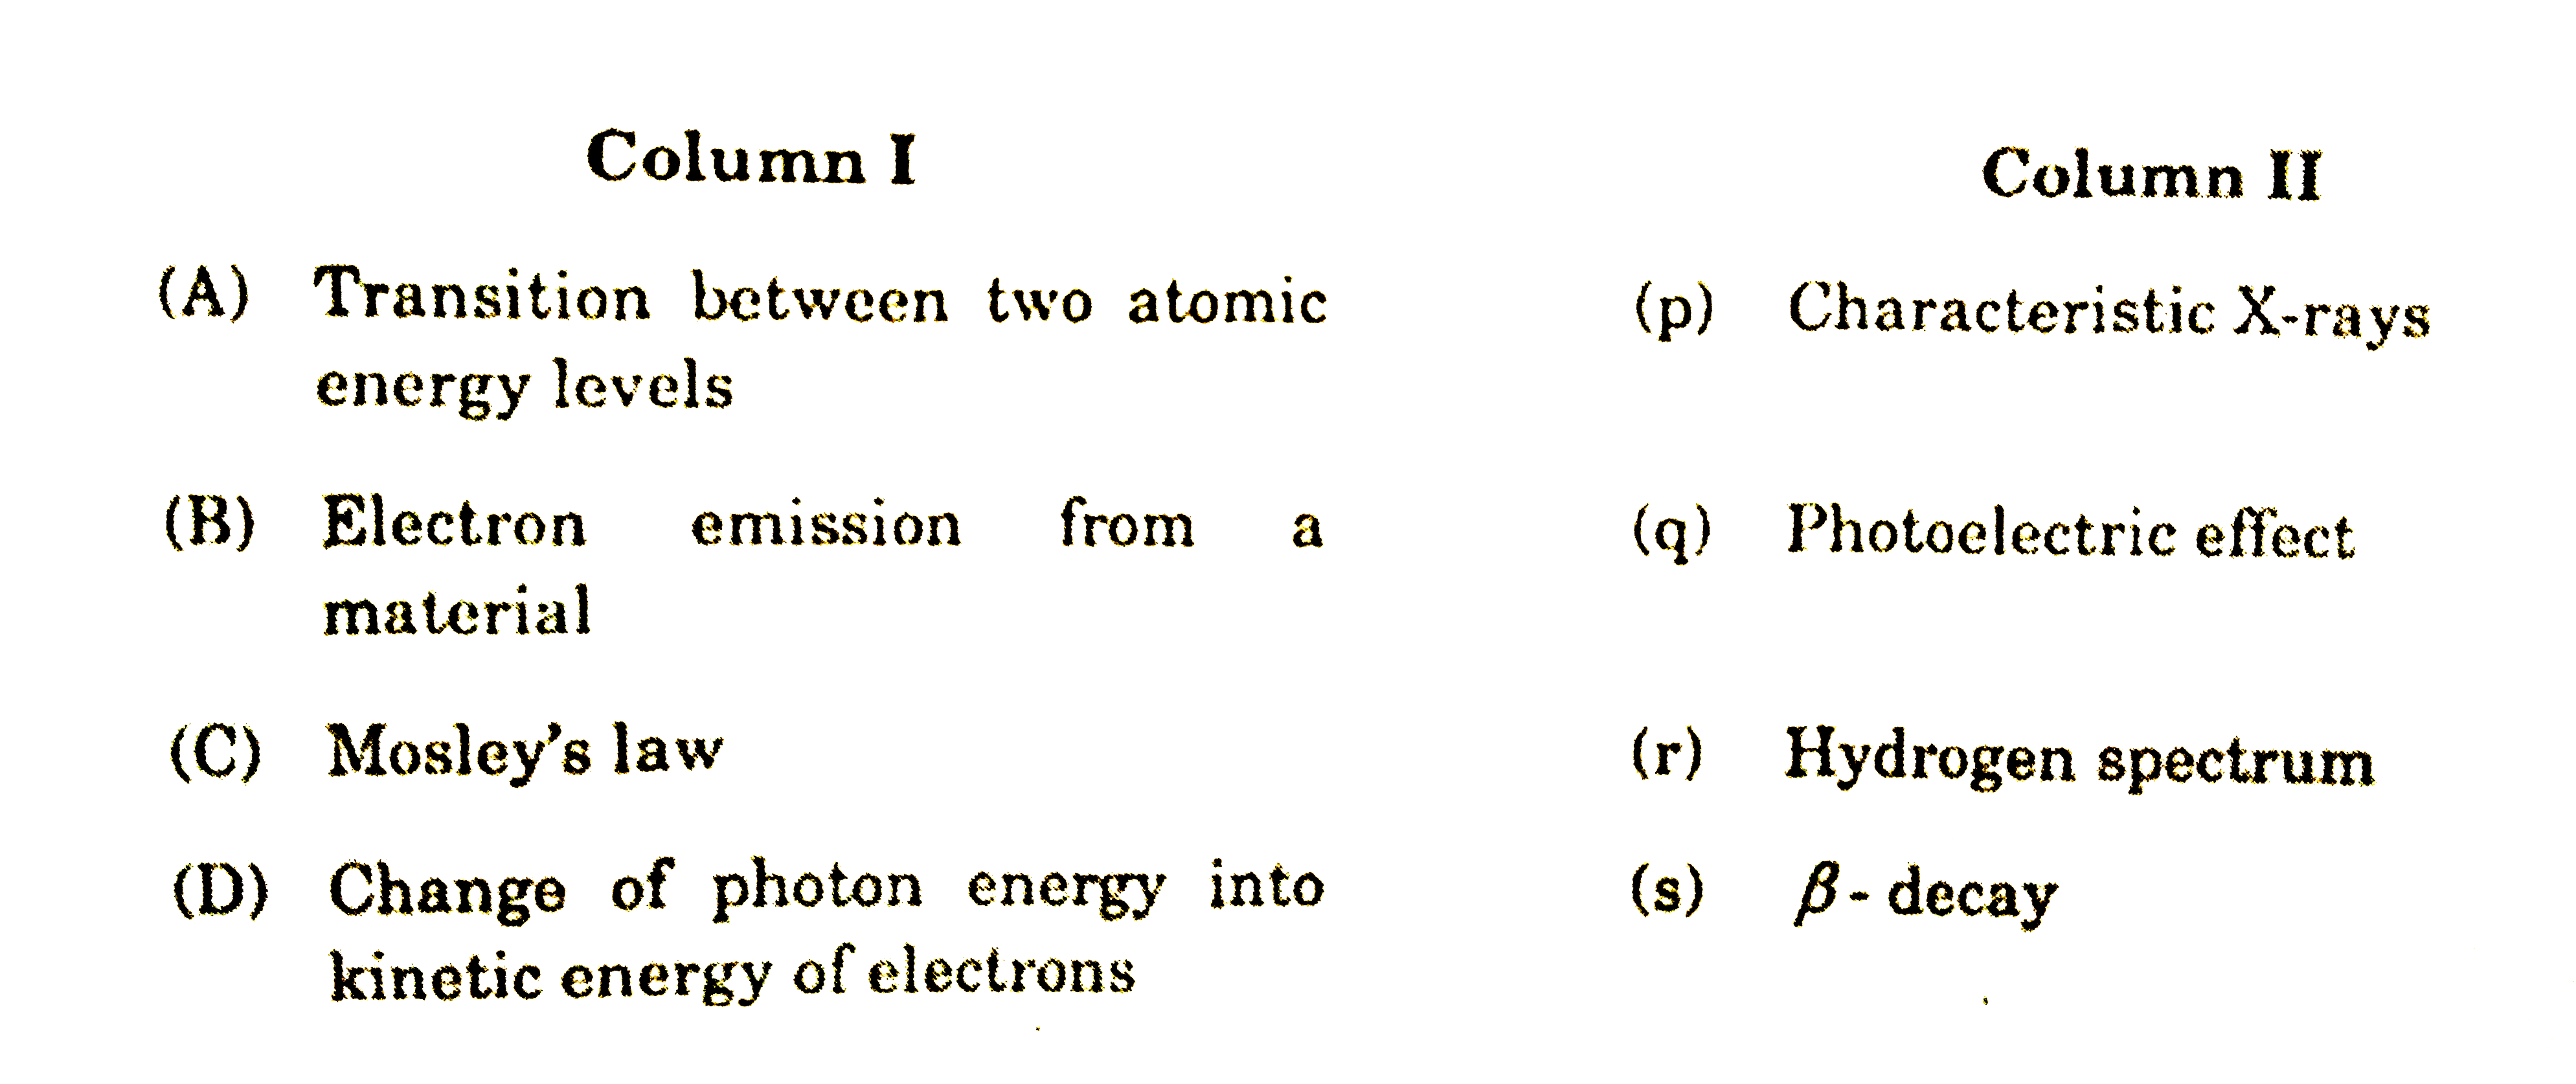
Some lawa I processes are given in Column I. Match these with the physical phenomena given in Column II and indicate your answer by darkening appropriate bubbles in the 4×4 matrix given in the ORS.
View SolutionColumn I gives a list of possible set of parameters measured in some expermients. The varitions of the parameters in the form of graphs ar shown in Column II. Match the set of parameters given Column I with the graph given in Column II. Indicate your answer by darking the appropriate bubbles of the 4×4 matrix given in the ORS.
_E01_169_Q01.png)
View Solution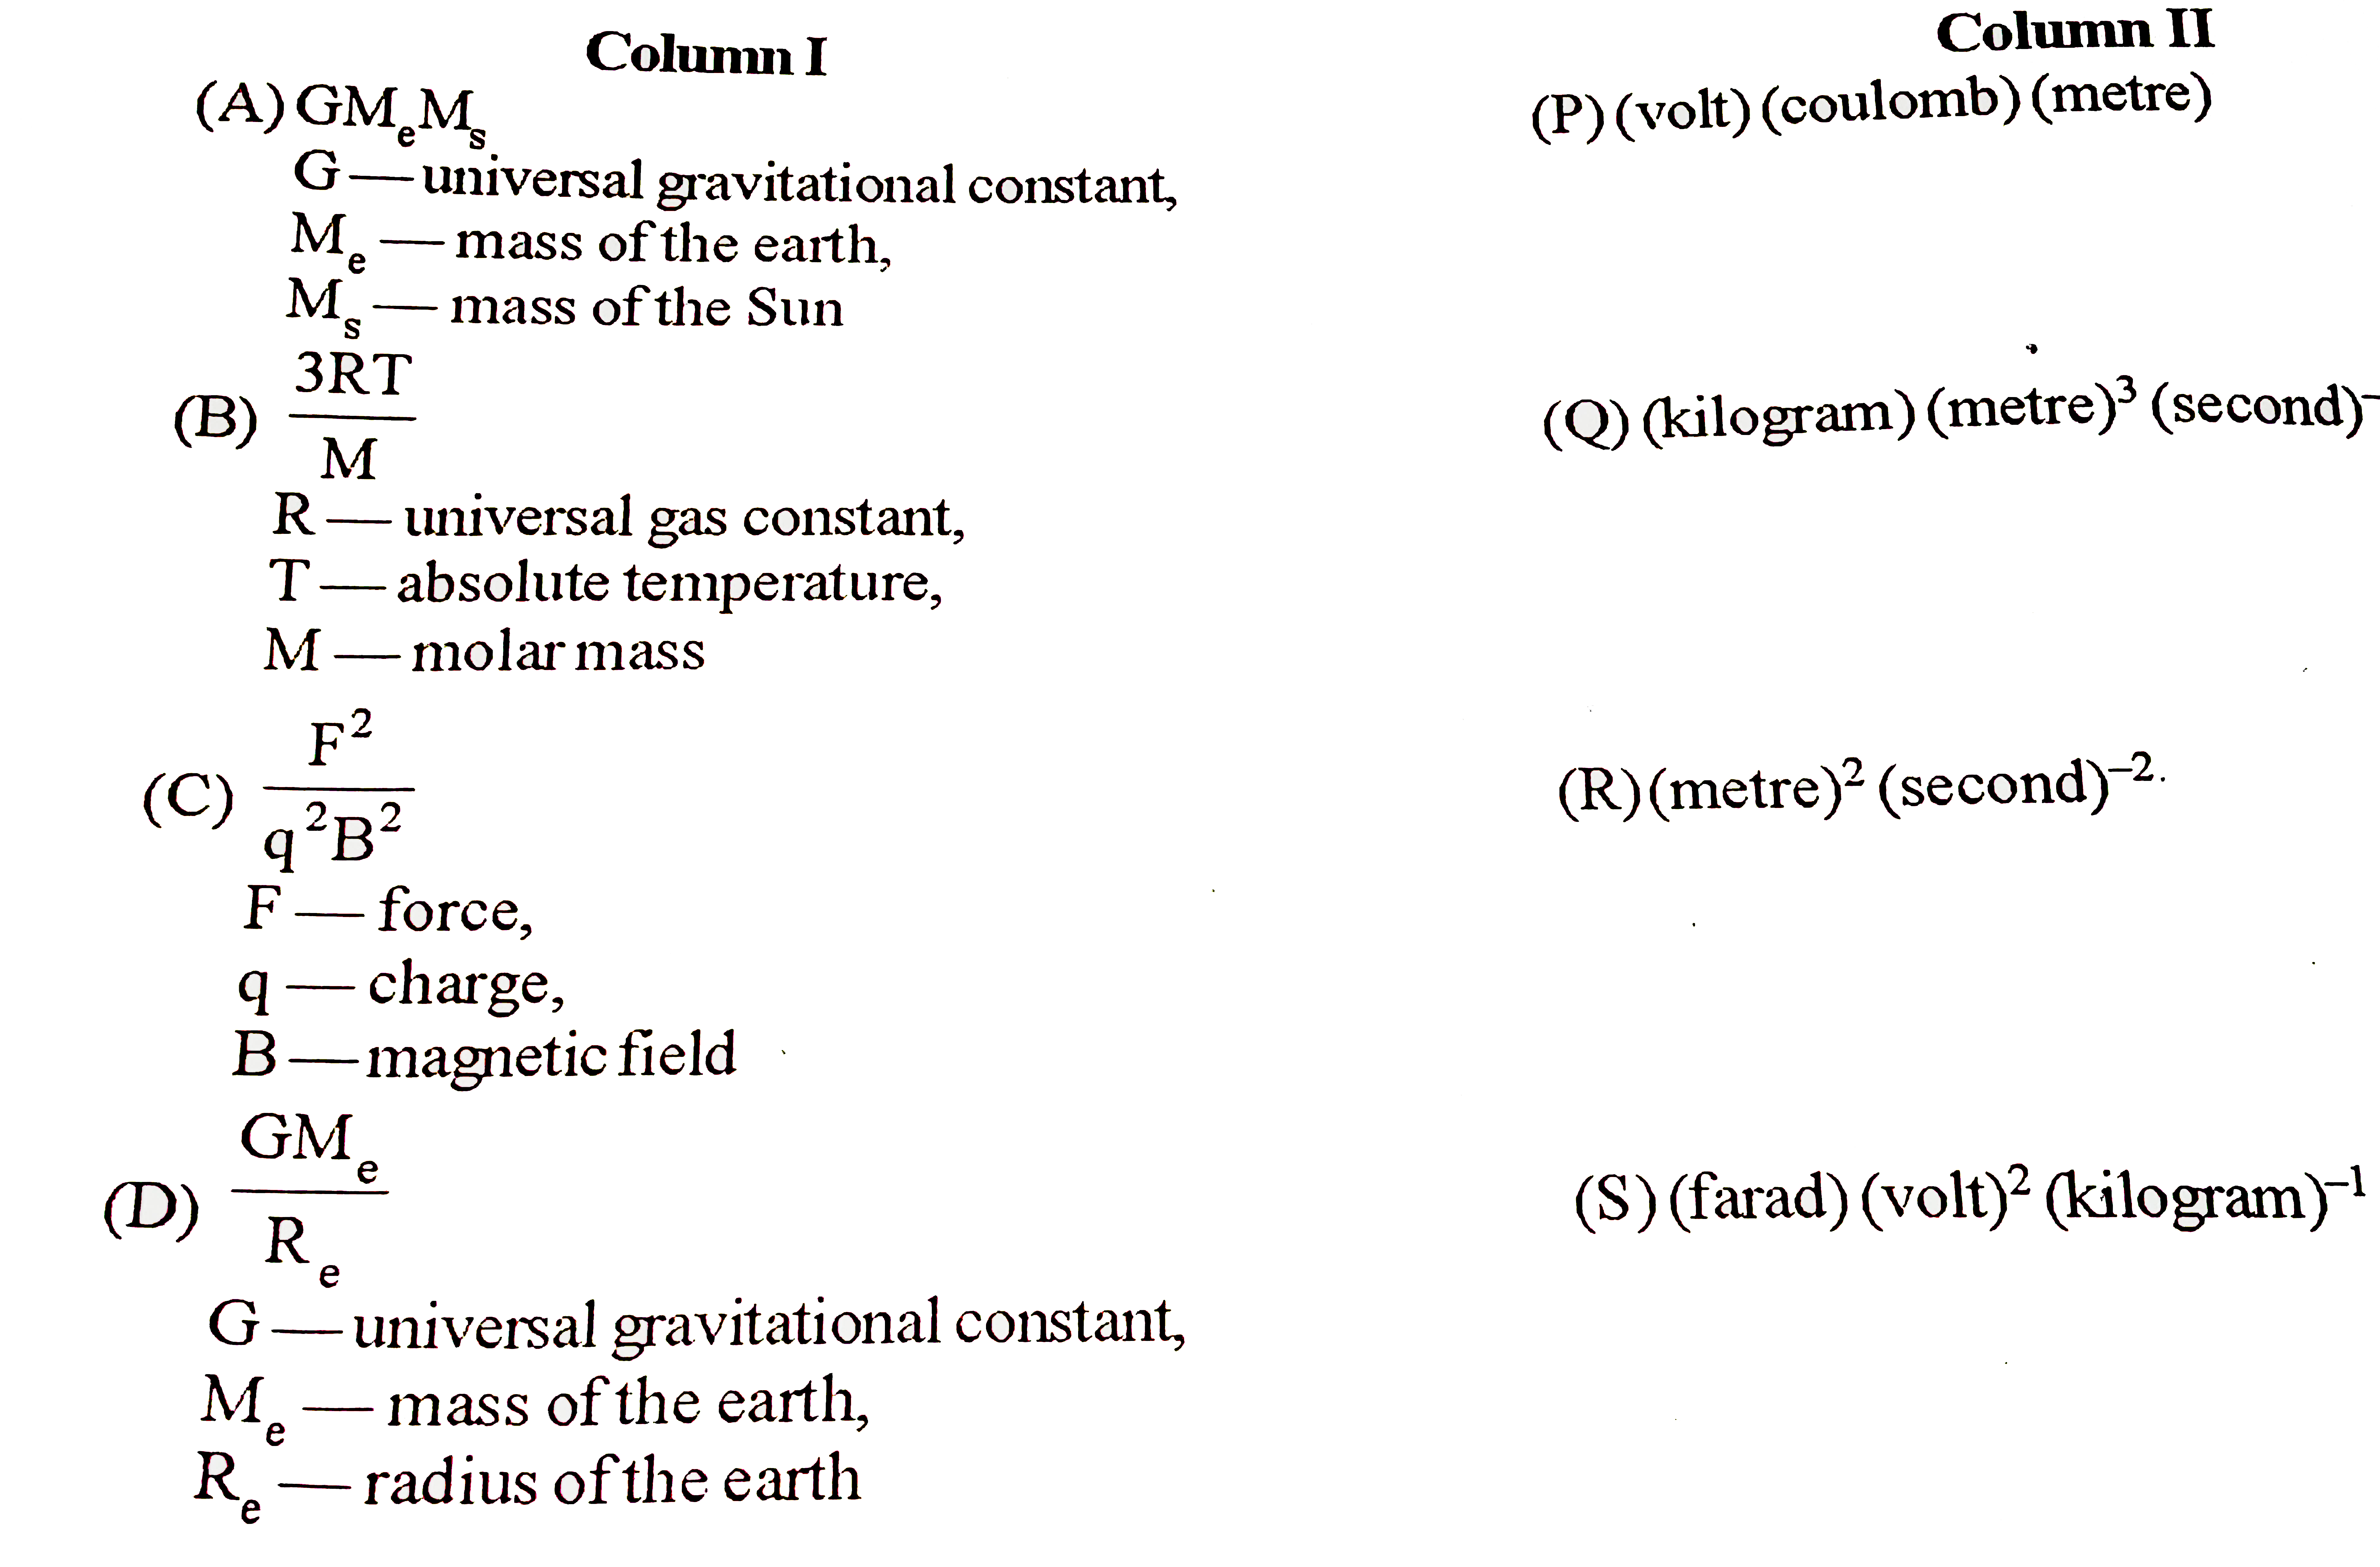
Some physical quantities are given in Column I and some possible SI units in which these quantities may be expressed are given in Column II. Match the physical quantities in Column I with the units in Column II and indicate your answer by darkening appropriate bubbles in the 4×4 matric given in the ORS.
View SolutionColumn I gives a listof possible set of parameters measured in some experiments. The variations of the parameters in the form of graphs are shown in Column II. Match the set of parameters given in Column I with the graphs even in Column II. Indicate your answer by darkening the appropriate bubbles of the 4×4 matrix given in the ORS.
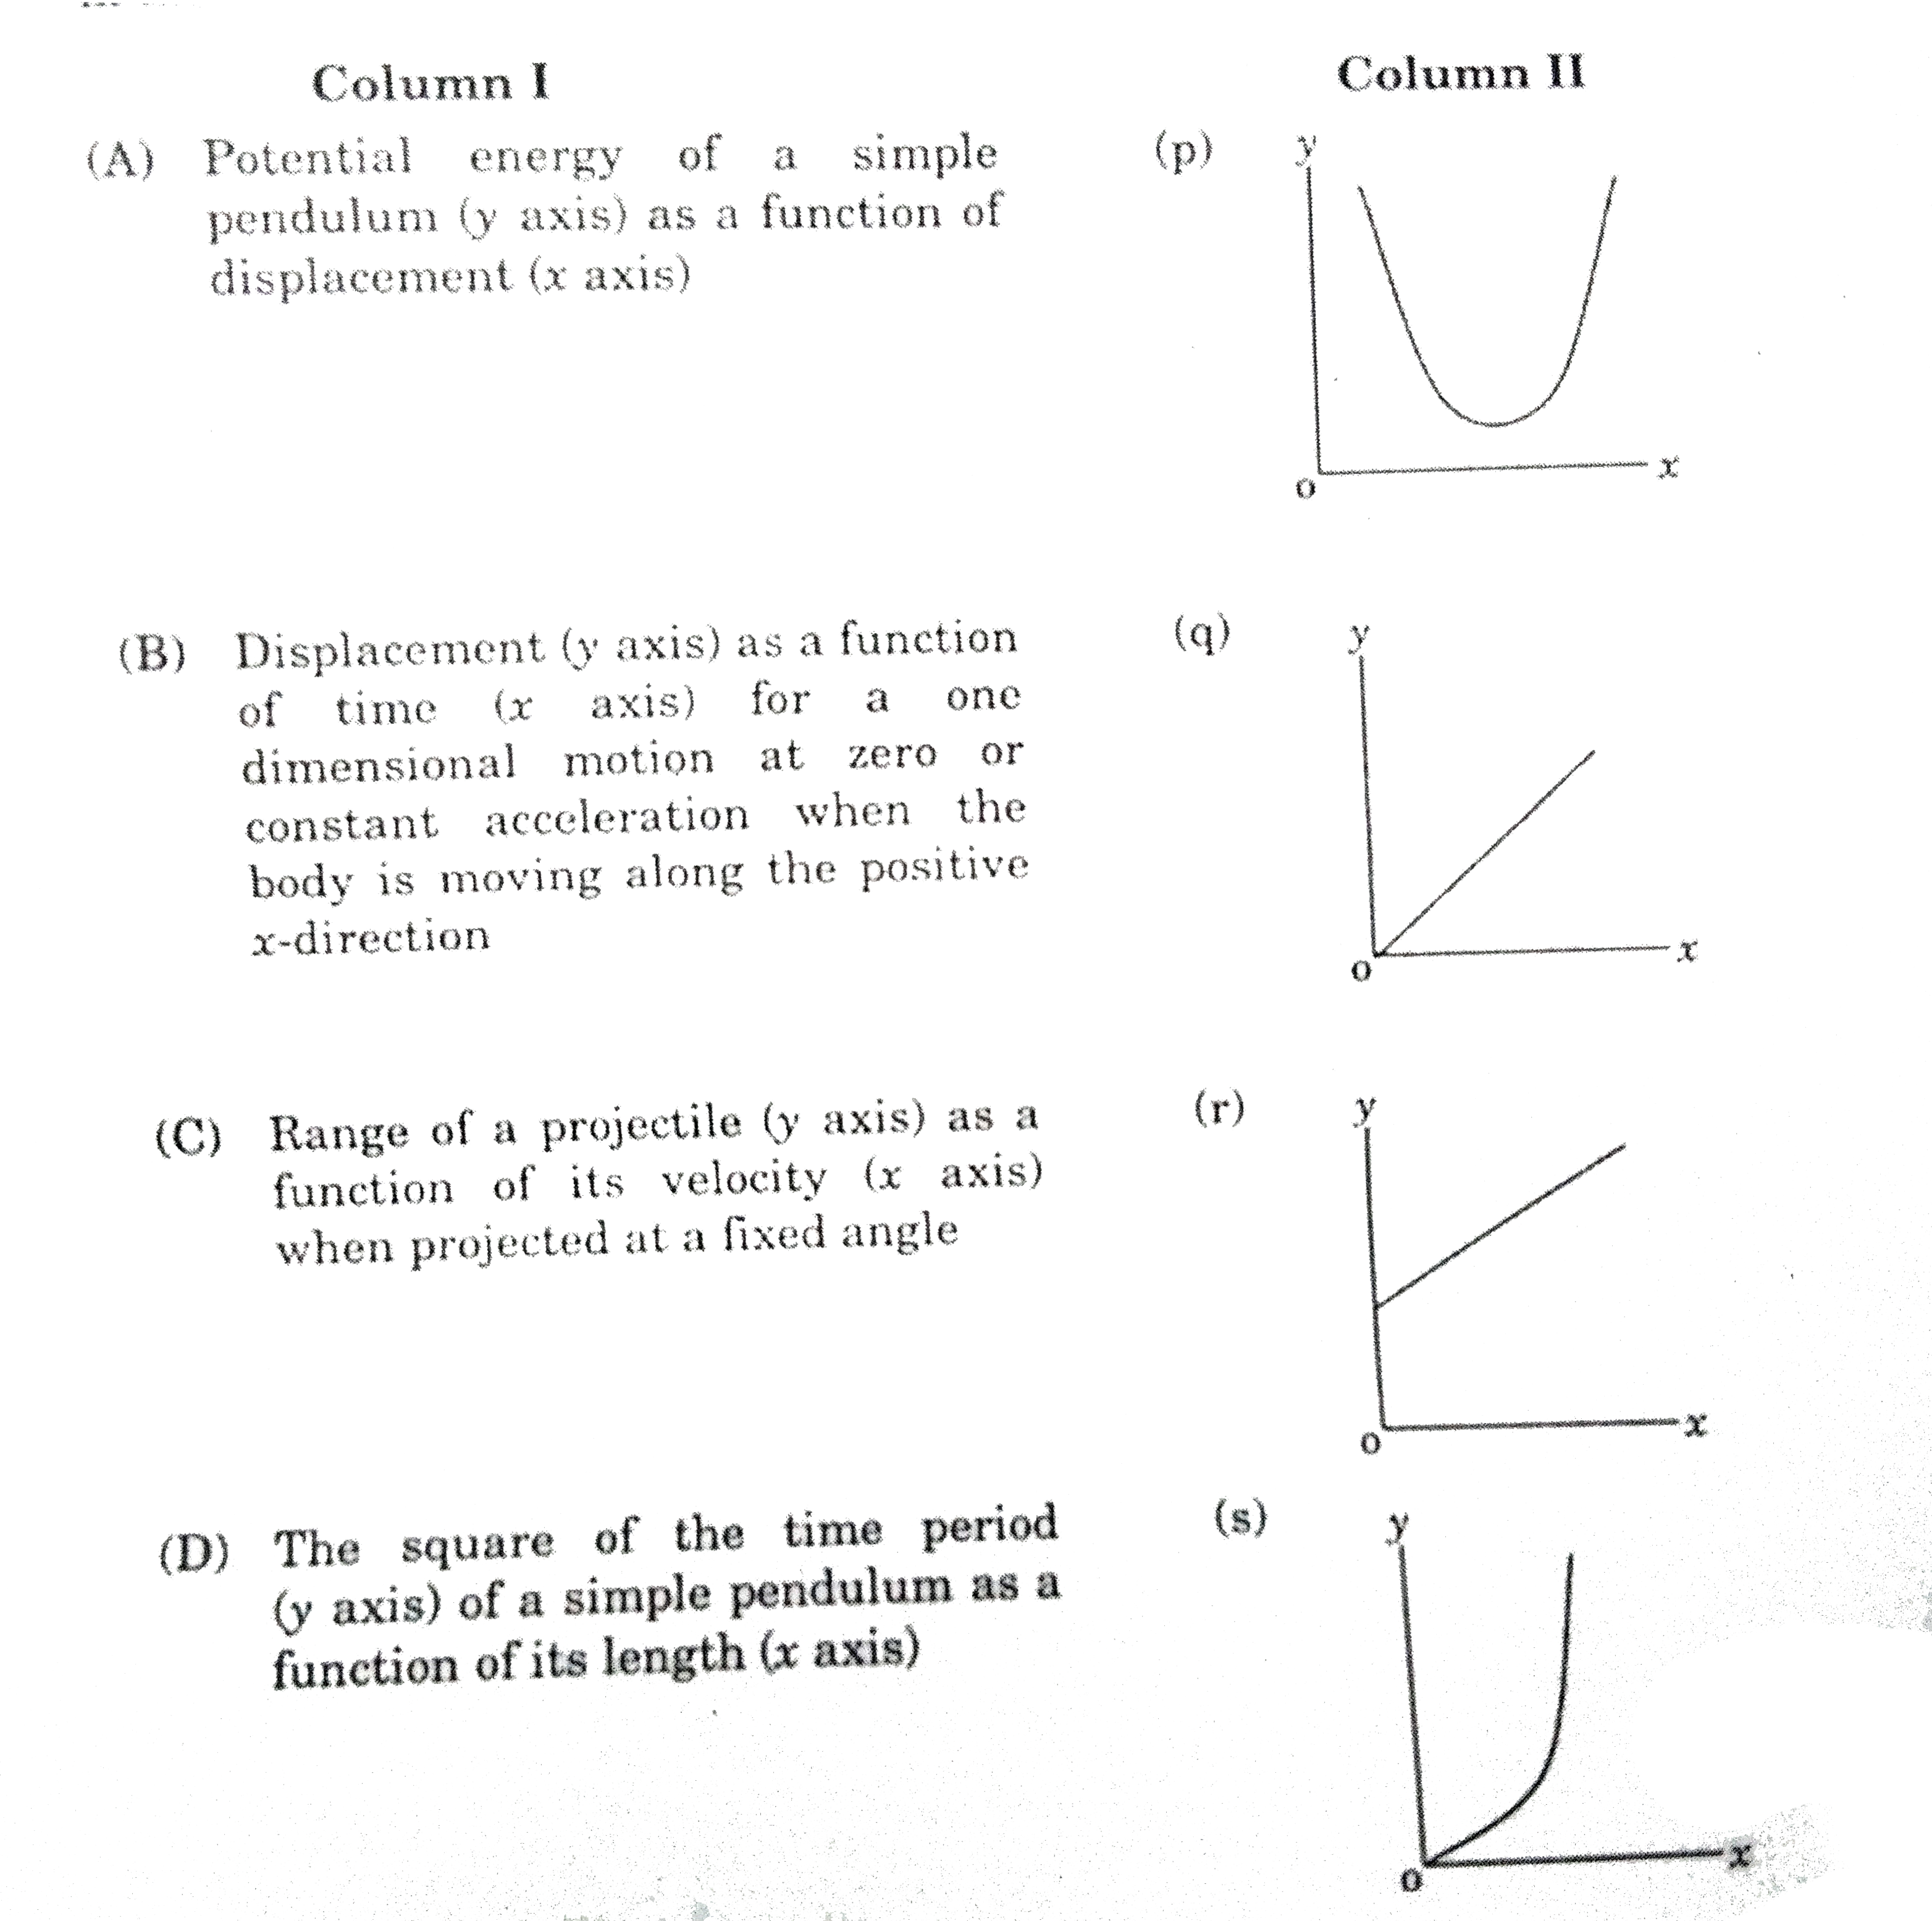
View SolutionTwo wires each carrying a steady current I are shown in four configurations in Column I. Some of the resulting effects are described in Column II. Match the statements in Column I with the statements in Column II and the indicate your answer by darkening appropriate bubbles in the 4×4 matrix given in the ORS.
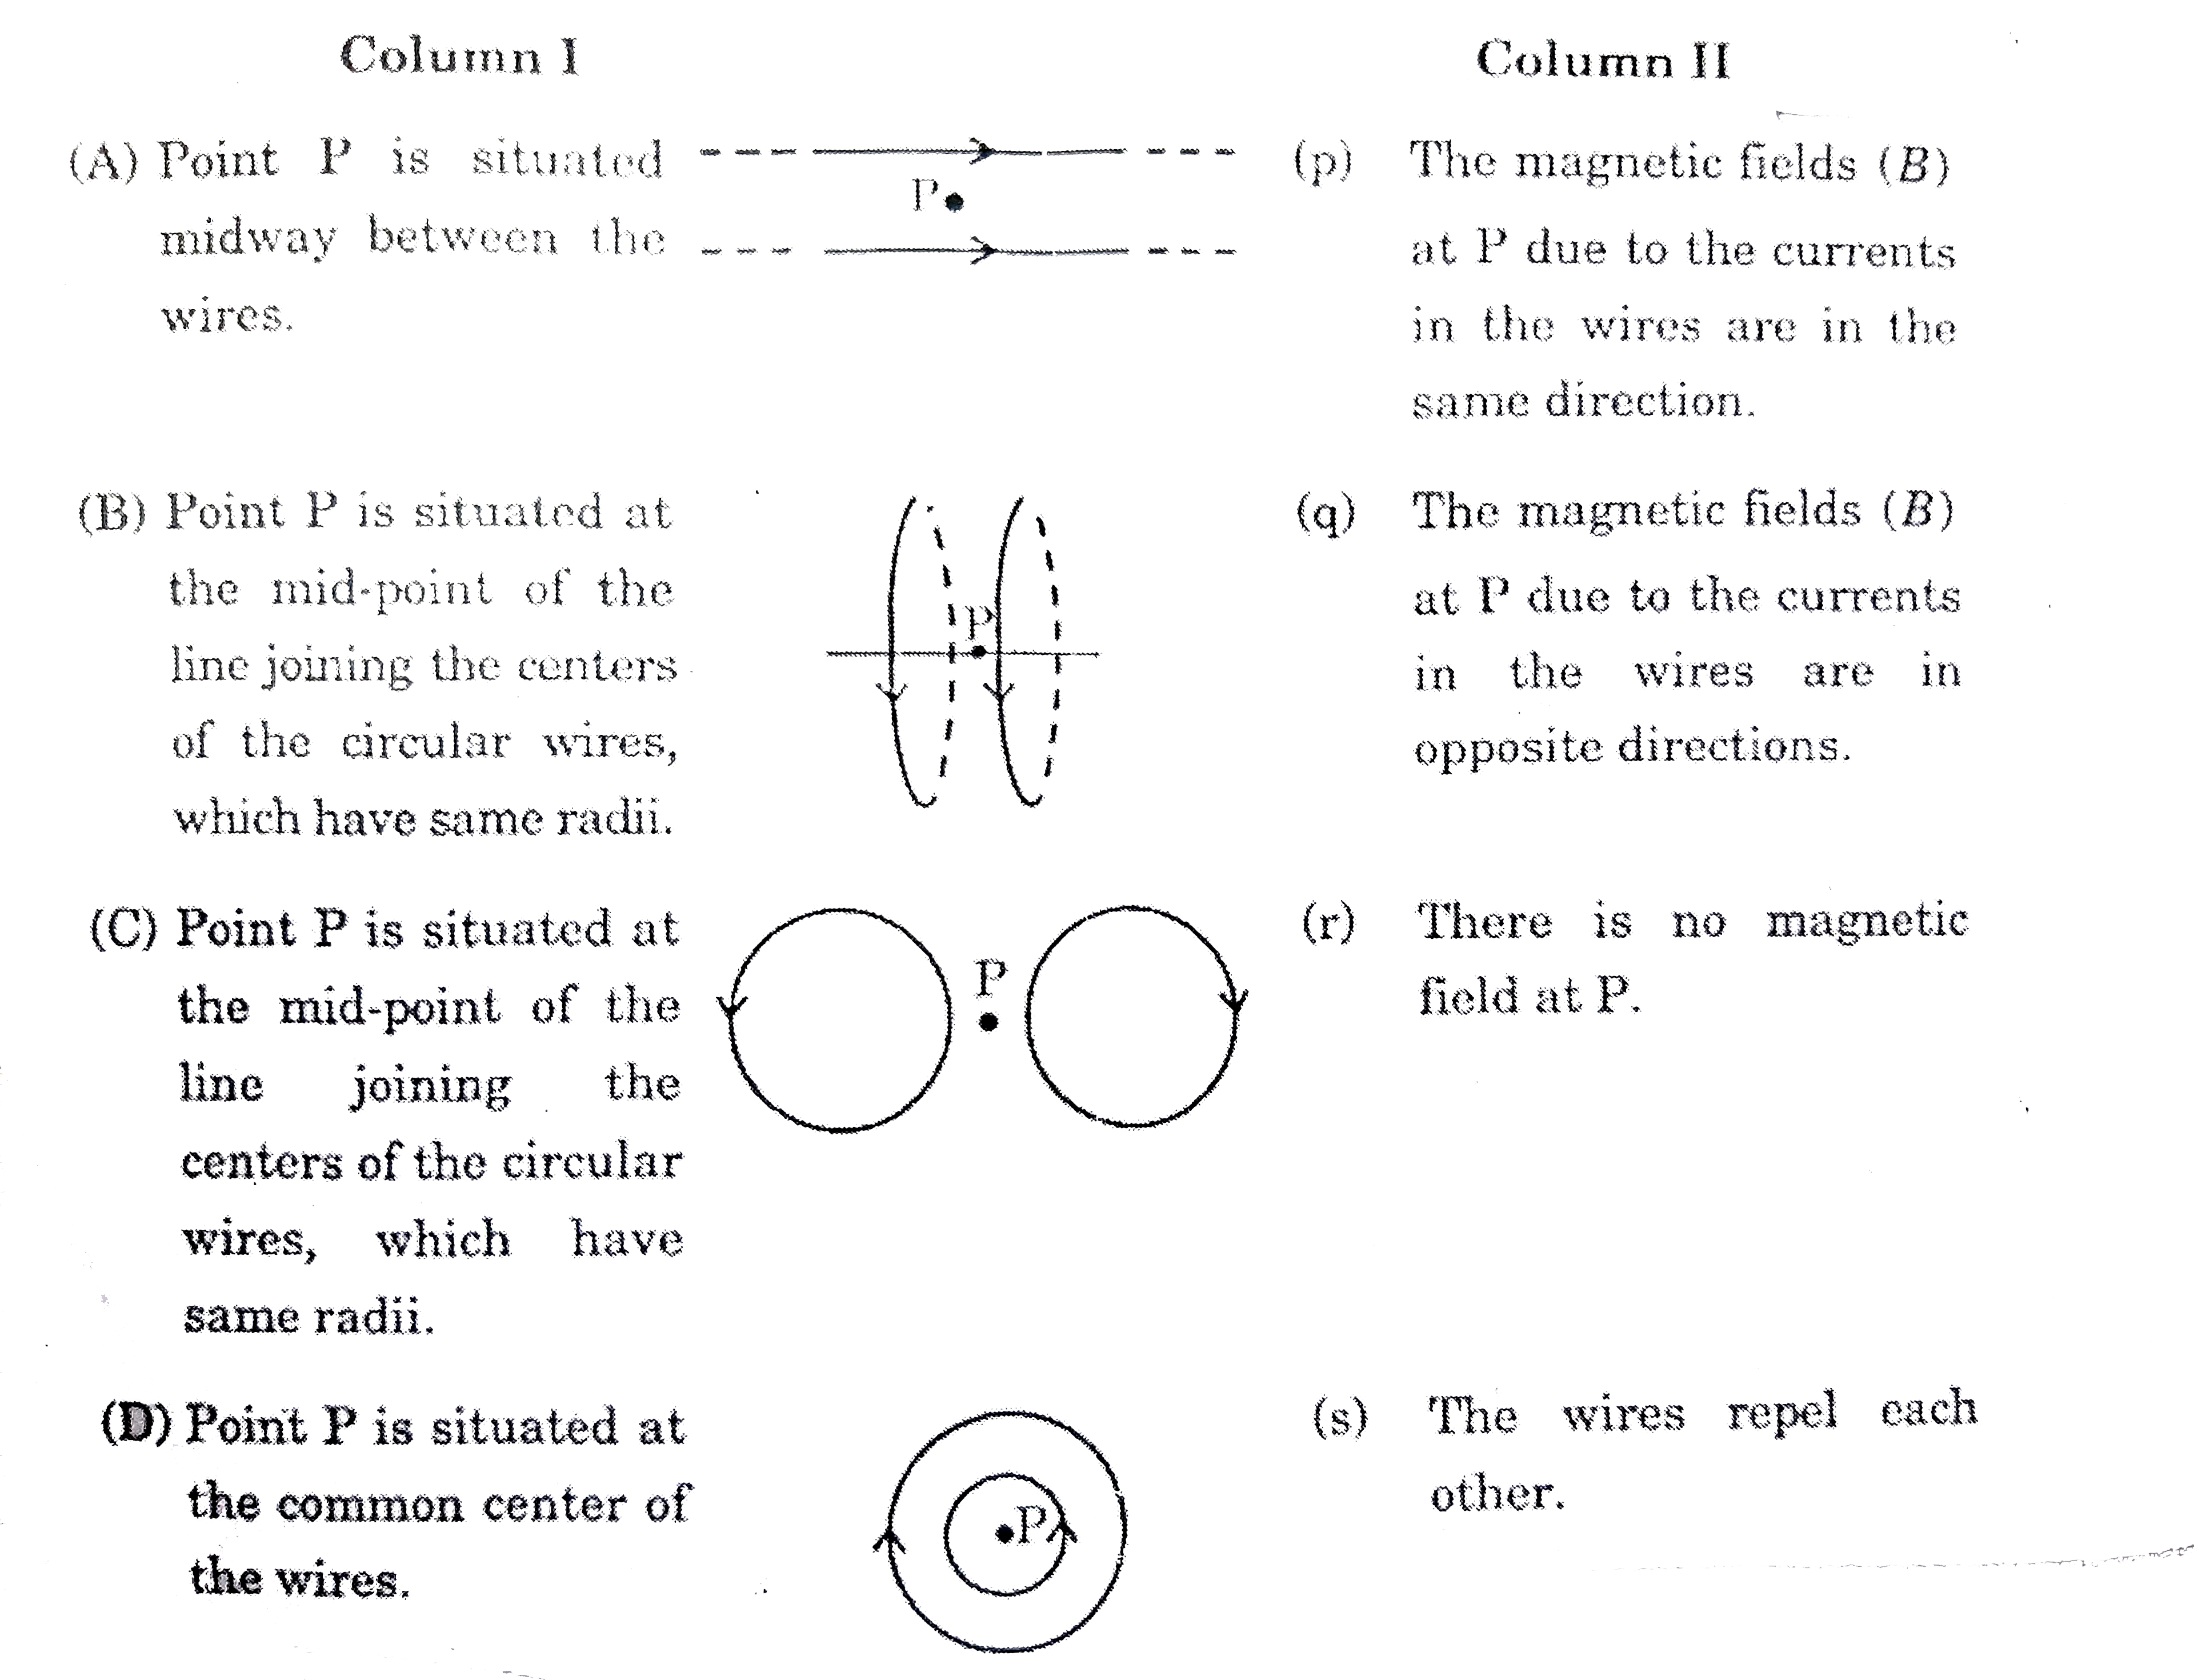
View Solution

