Column I gives a listof possible set of parameters measured in some experiments. The variations of the parameters in the form of graphs are shown in Column II. Match the set of parameters given in Column I with the graphs even in Column II. Indicate your answer by darkening the appropriate bubbles of the 4×4 matrix given in the ORS.
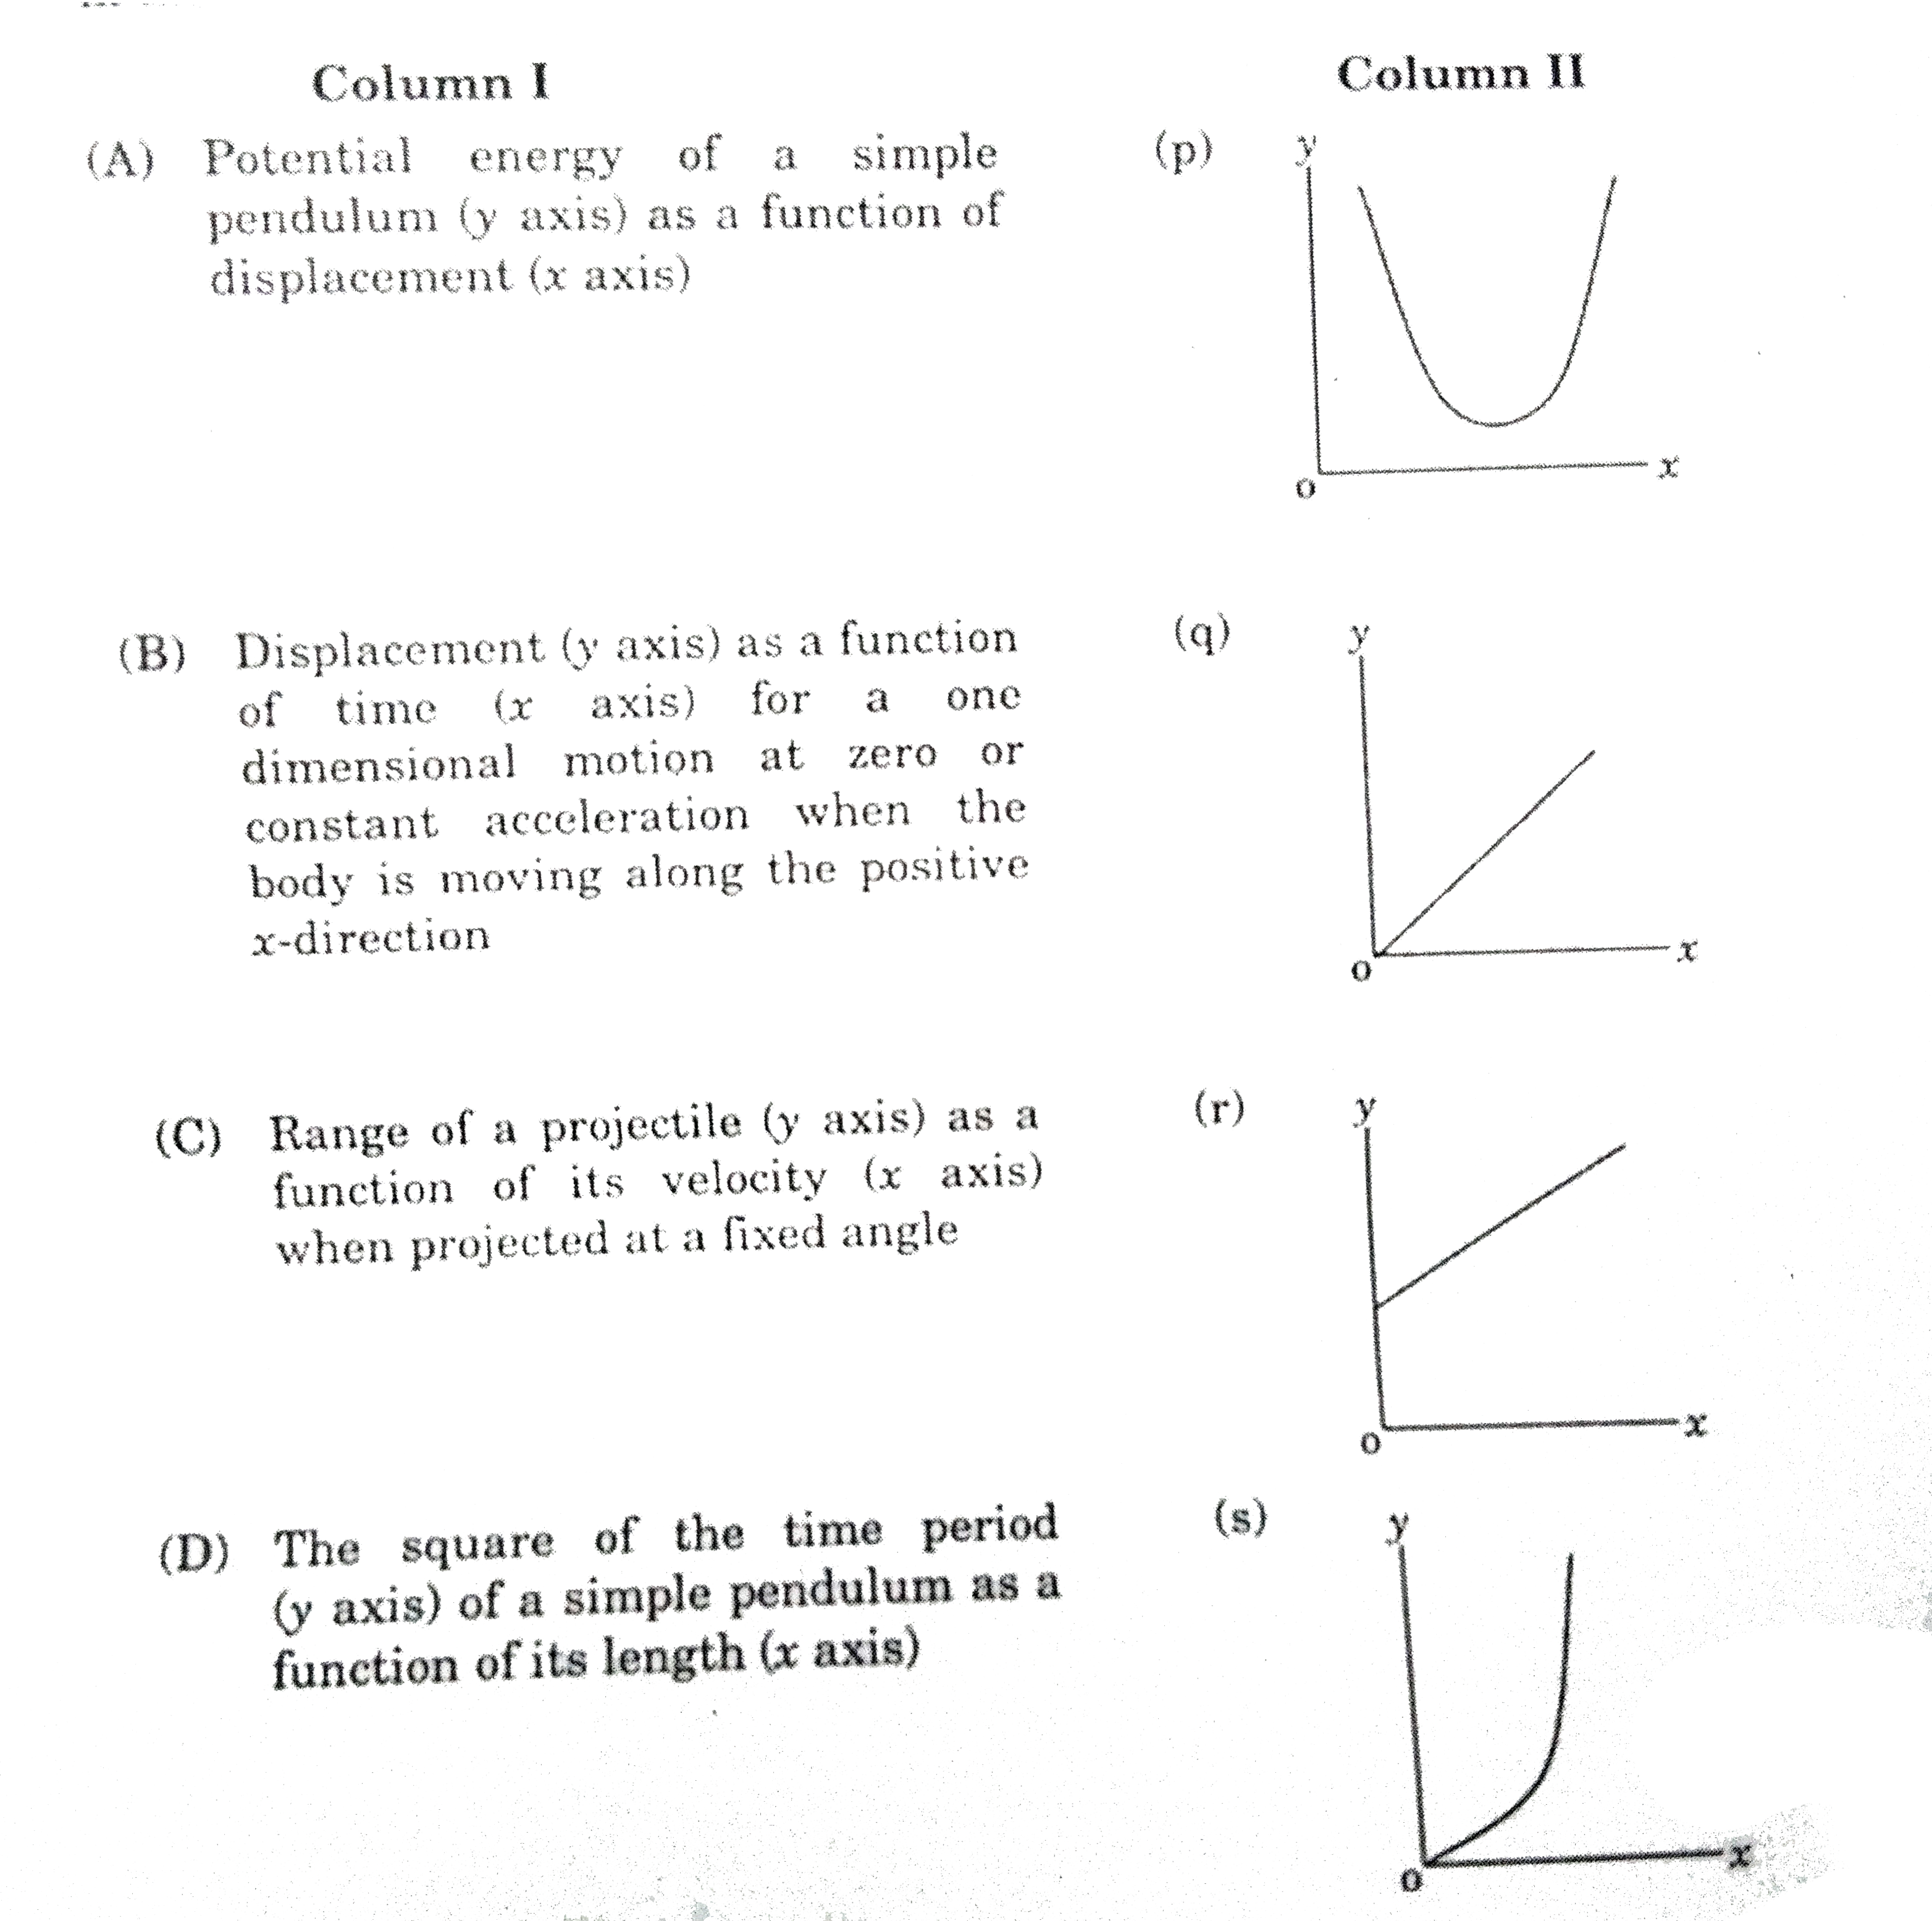
The correct Answer is:A, B, D
Step by step video & image solution for Column I gives a listof possible set of parameters measured in some experiments. The variations of the parameters in the form of graphs are shown in Column II. Match the set of parameters given in Column I with the graphs even in Column II. Indicate your answer by darkening the appropriate bubbles of the 4 xx 4 matrix given in the ORS. by Physics experts to help you in doubts & scoring excellent marks in Class 12 exams.
Updated on:21/07/2023Topper's Solved these Questions
- JEE ADVANCEDBOOK - JEE ADVANCED PREVIOUS YEARCHAPTER - JEE ADVANCEDEXERCISE - MULTIPLE CHOICE QUESTIONS
22 Videos
- JEE ADVANCEDBOOK - JEE ADVANCED PREVIOUS YEARCHAPTER - JEE ADVANCEDEXERCISE - SECTION-III (Comprehension Type )
3 Videos
- JEE (ADVANCE) 2020BOOK - JEE ADVANCED PREVIOUS YEARCHAPTER - JEE (ADVANCE) 2020EXERCISE - SECTION 3
6 Videos
- JEE ADVANCED 2020BOOK - JEE ADVANCED PREVIOUS YEARCHAPTER - JEE ADVANCED 2020EXERCISE - SECTION-3
6 Videos
Similar Questions
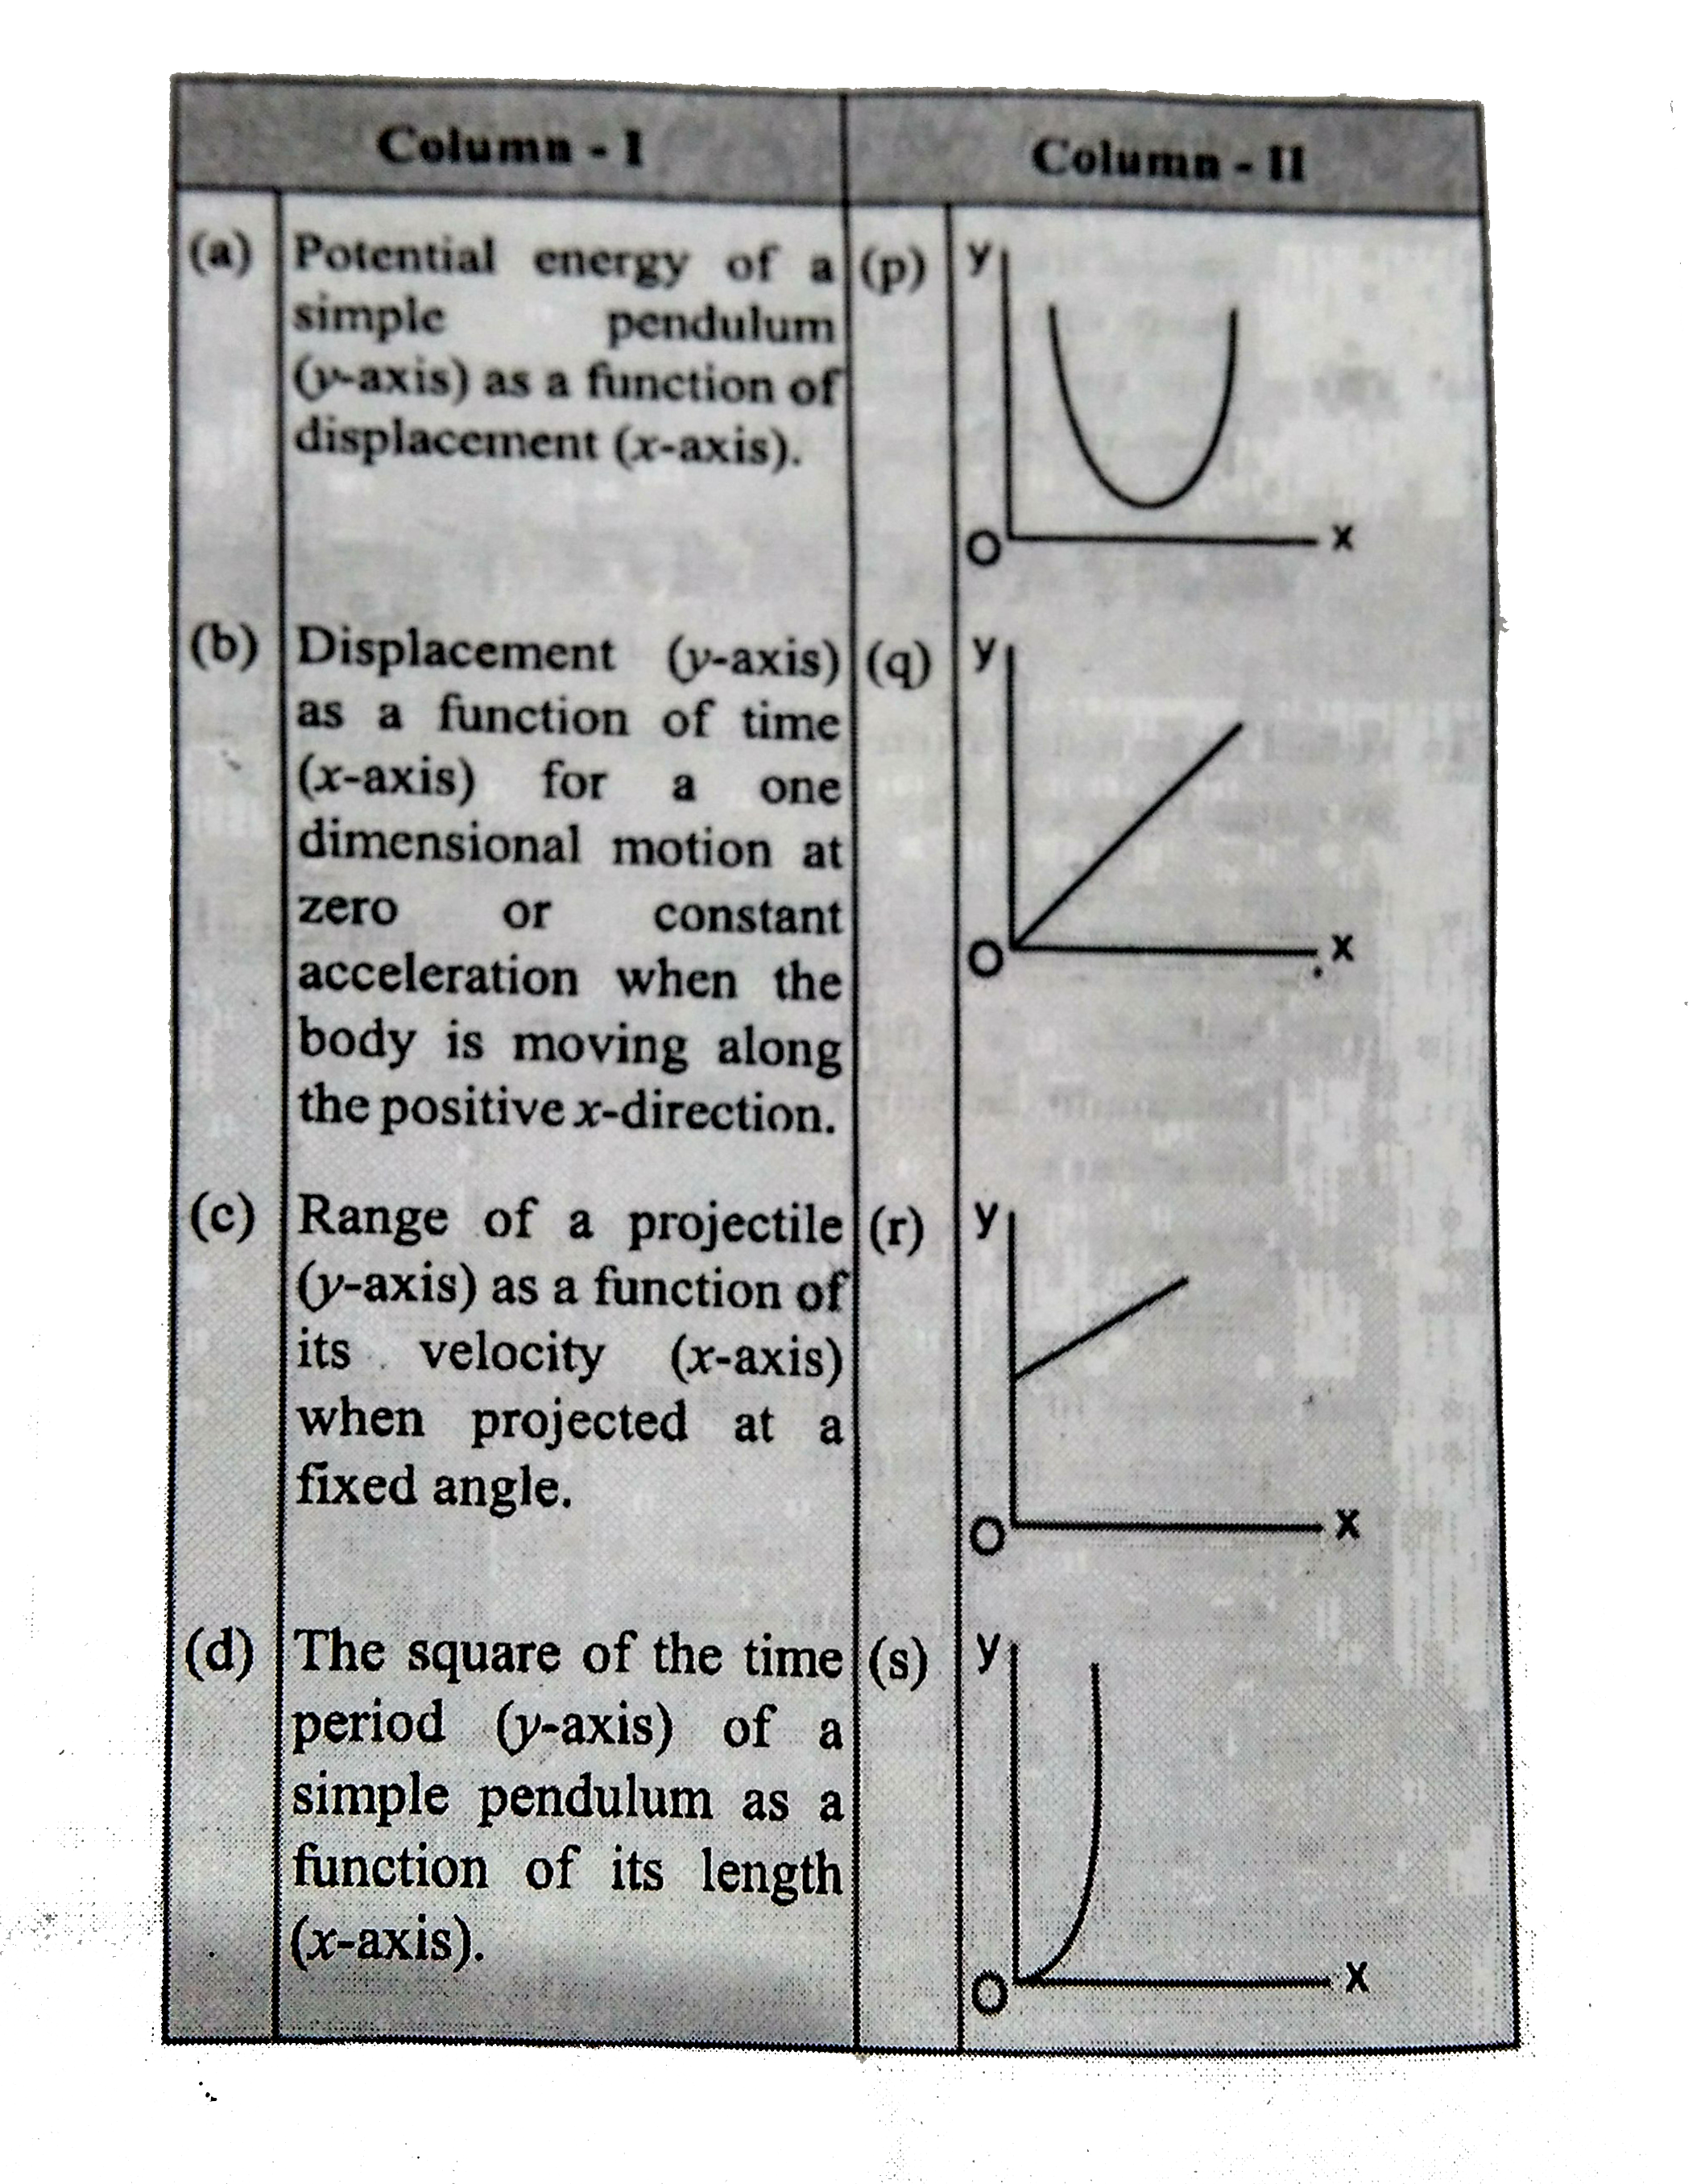
Column I gives a list of possible set of parameters measured in some expreriments. The variations of the parameers in the form of graphs are shown in Column II. Match the set of parameters given in Column I with the graphs given in Column II.
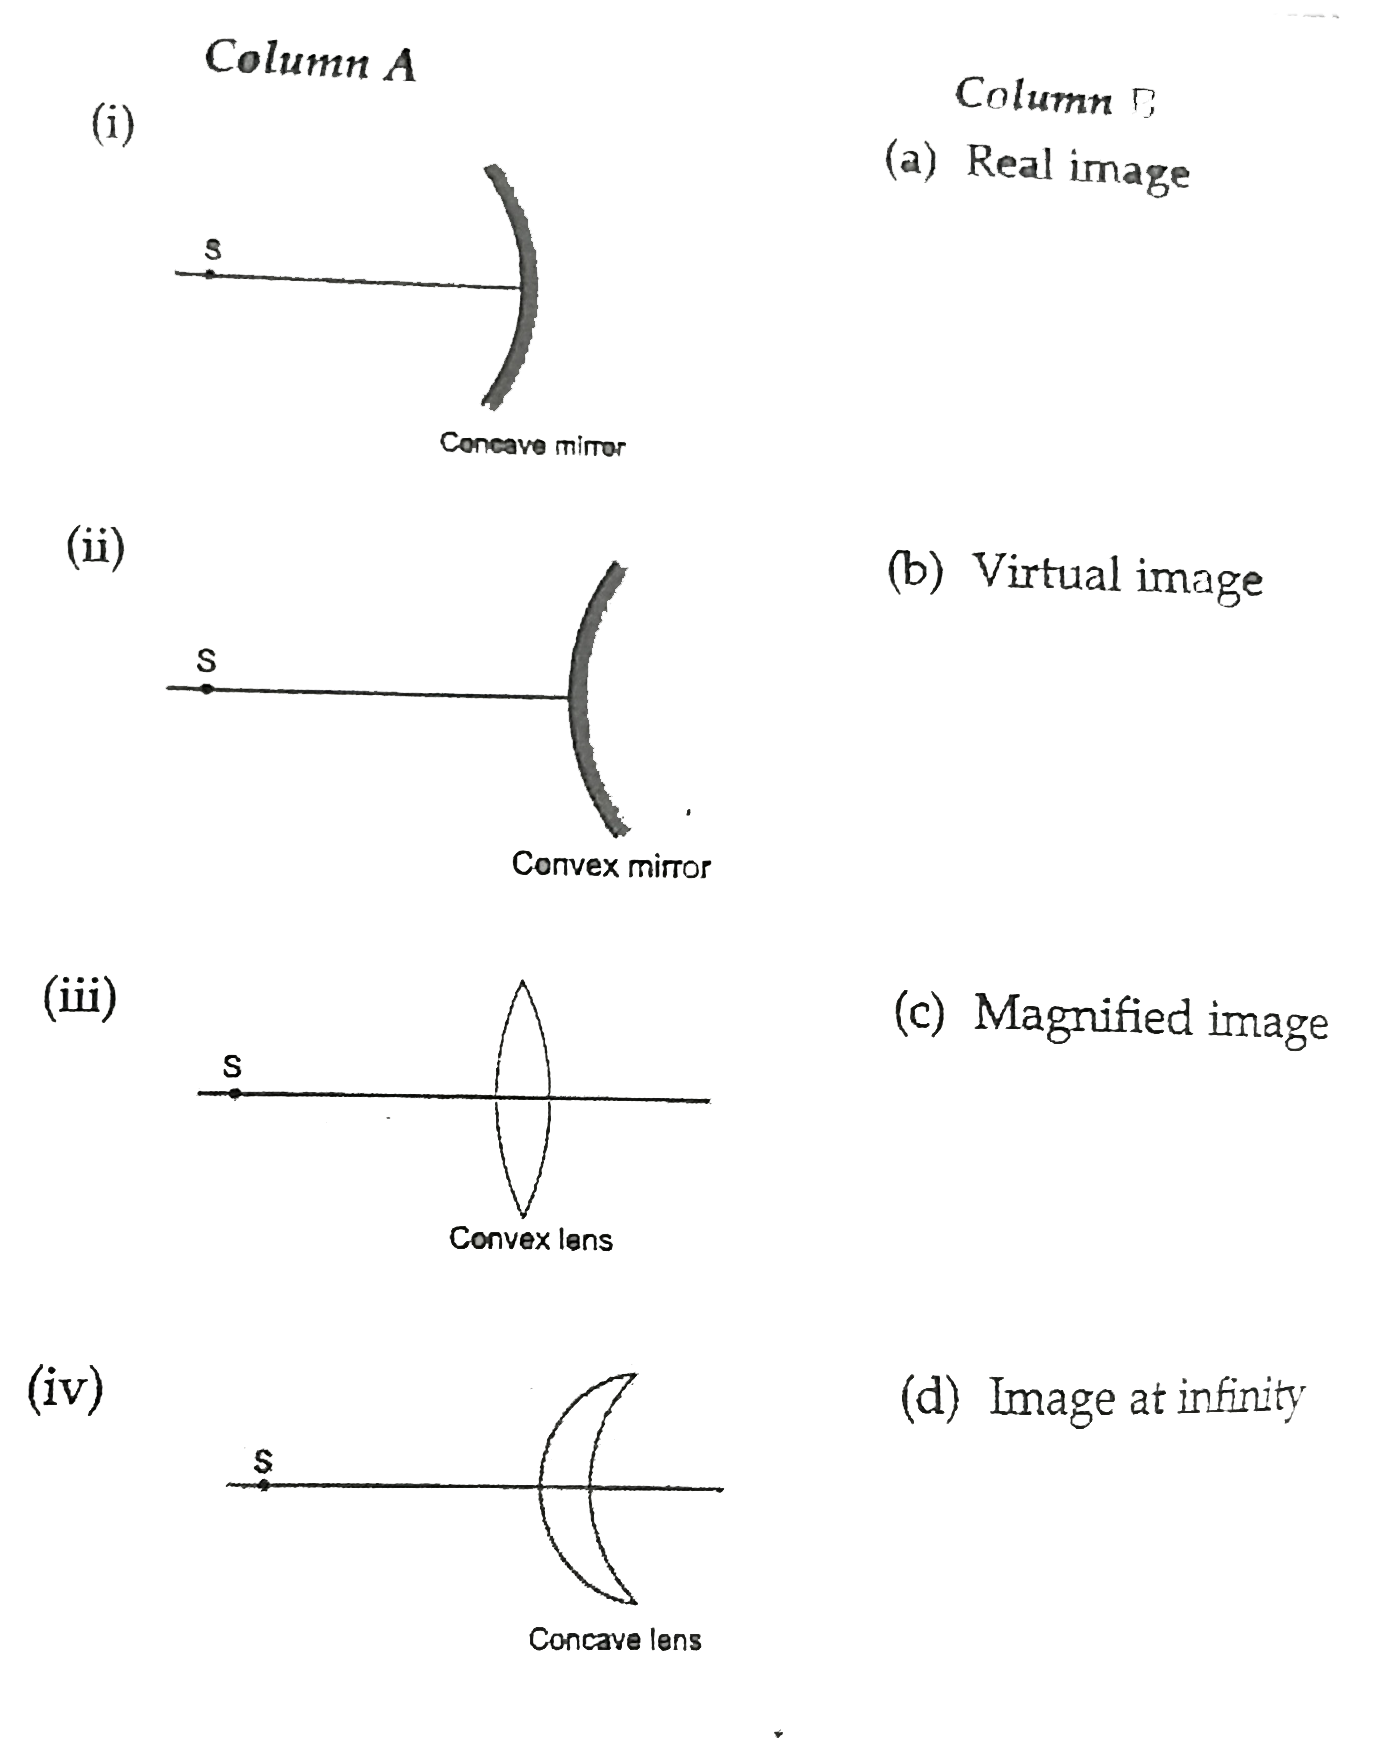
View SolutionColumn A gives a list of possible set of parameters measured in some experiments . The variations of the parameters in the form of graphs are shown in column B.
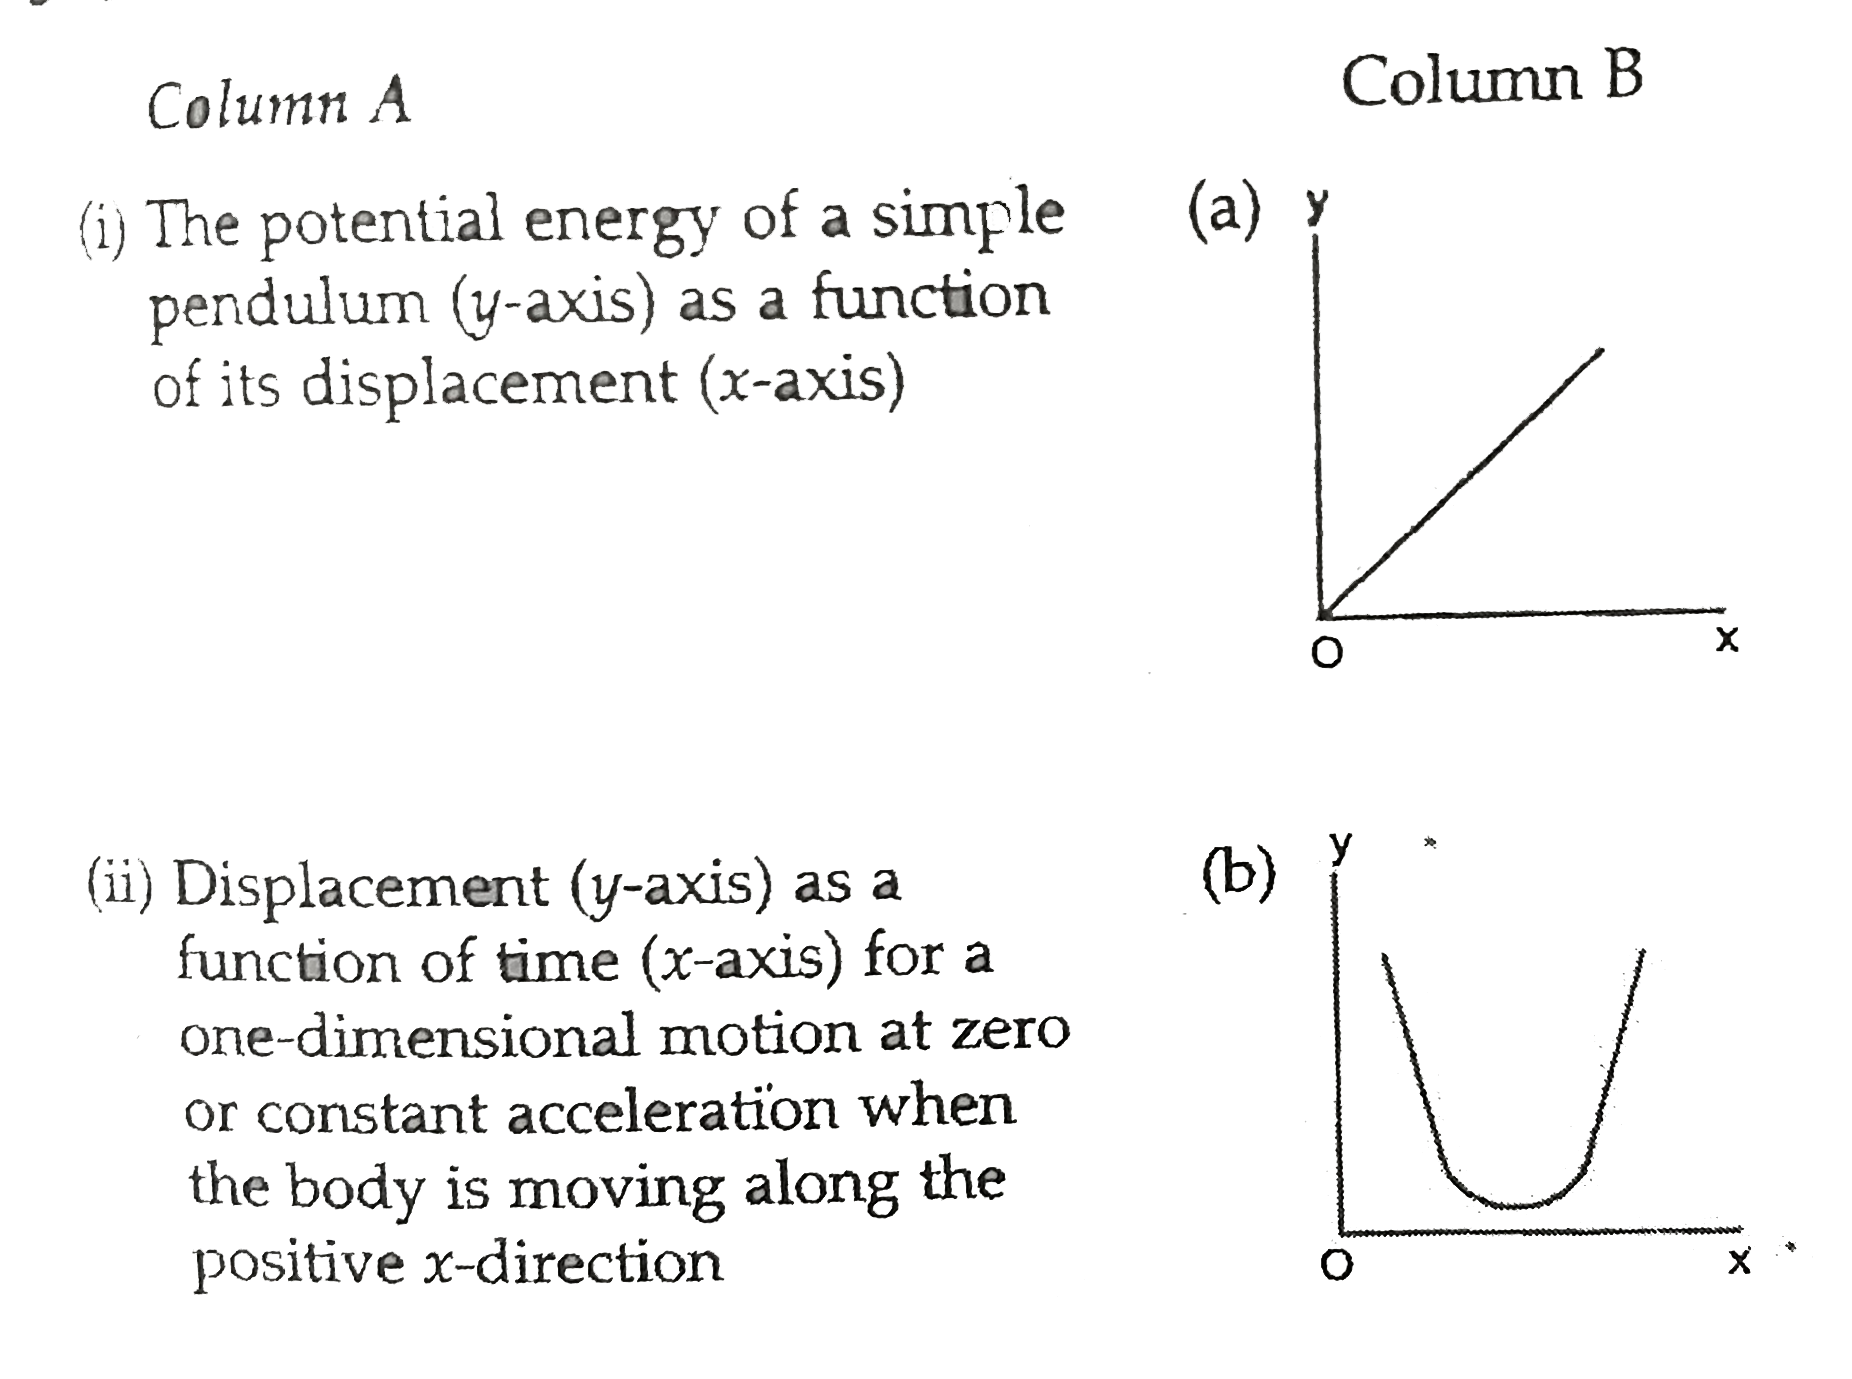
View SolutionColumn A gives a list of possible set of parameters measured in some experiments . The variations of the parameters in the form of graphs are shown in column B.
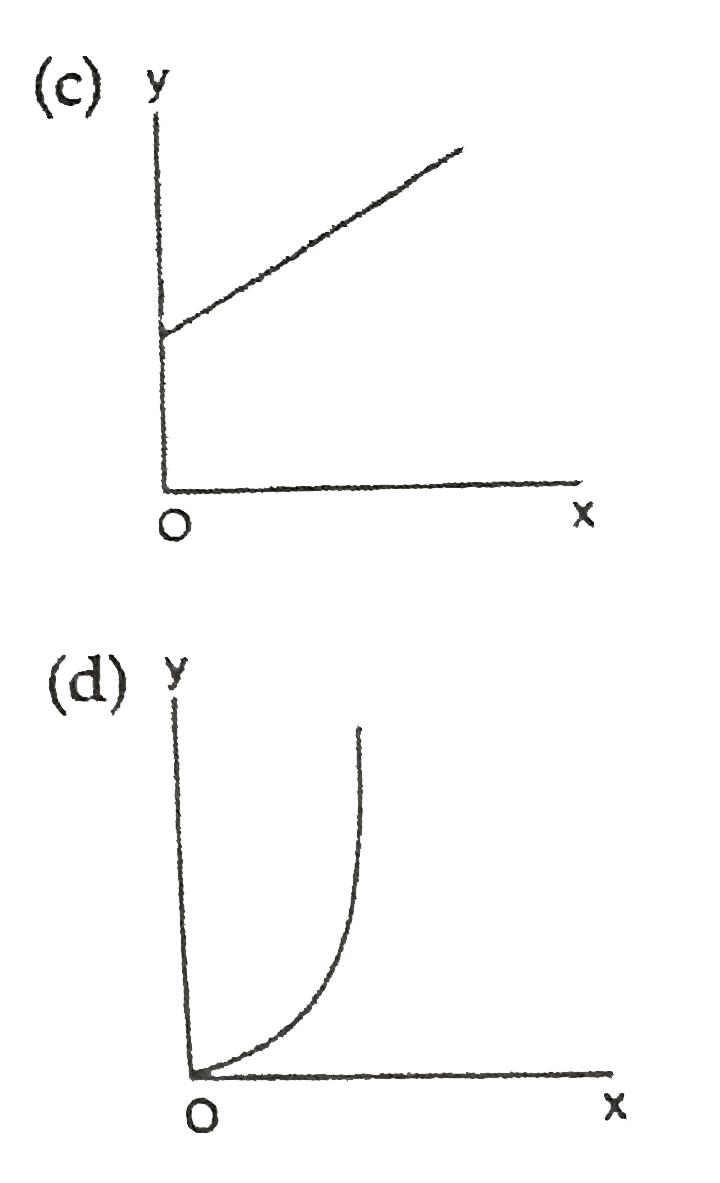
View SolutionColumn I gives a list of possible set of parameters measured in some expermients. The varitions of the parameters in the form of graphs ar shown in Column II. Match the set of parameters given Column I with the graph given in Column II. Indicate your answer by darking the appropriate bubbles of the 4×4 matrix given in the ORS.
_E01_169_Q01.png)
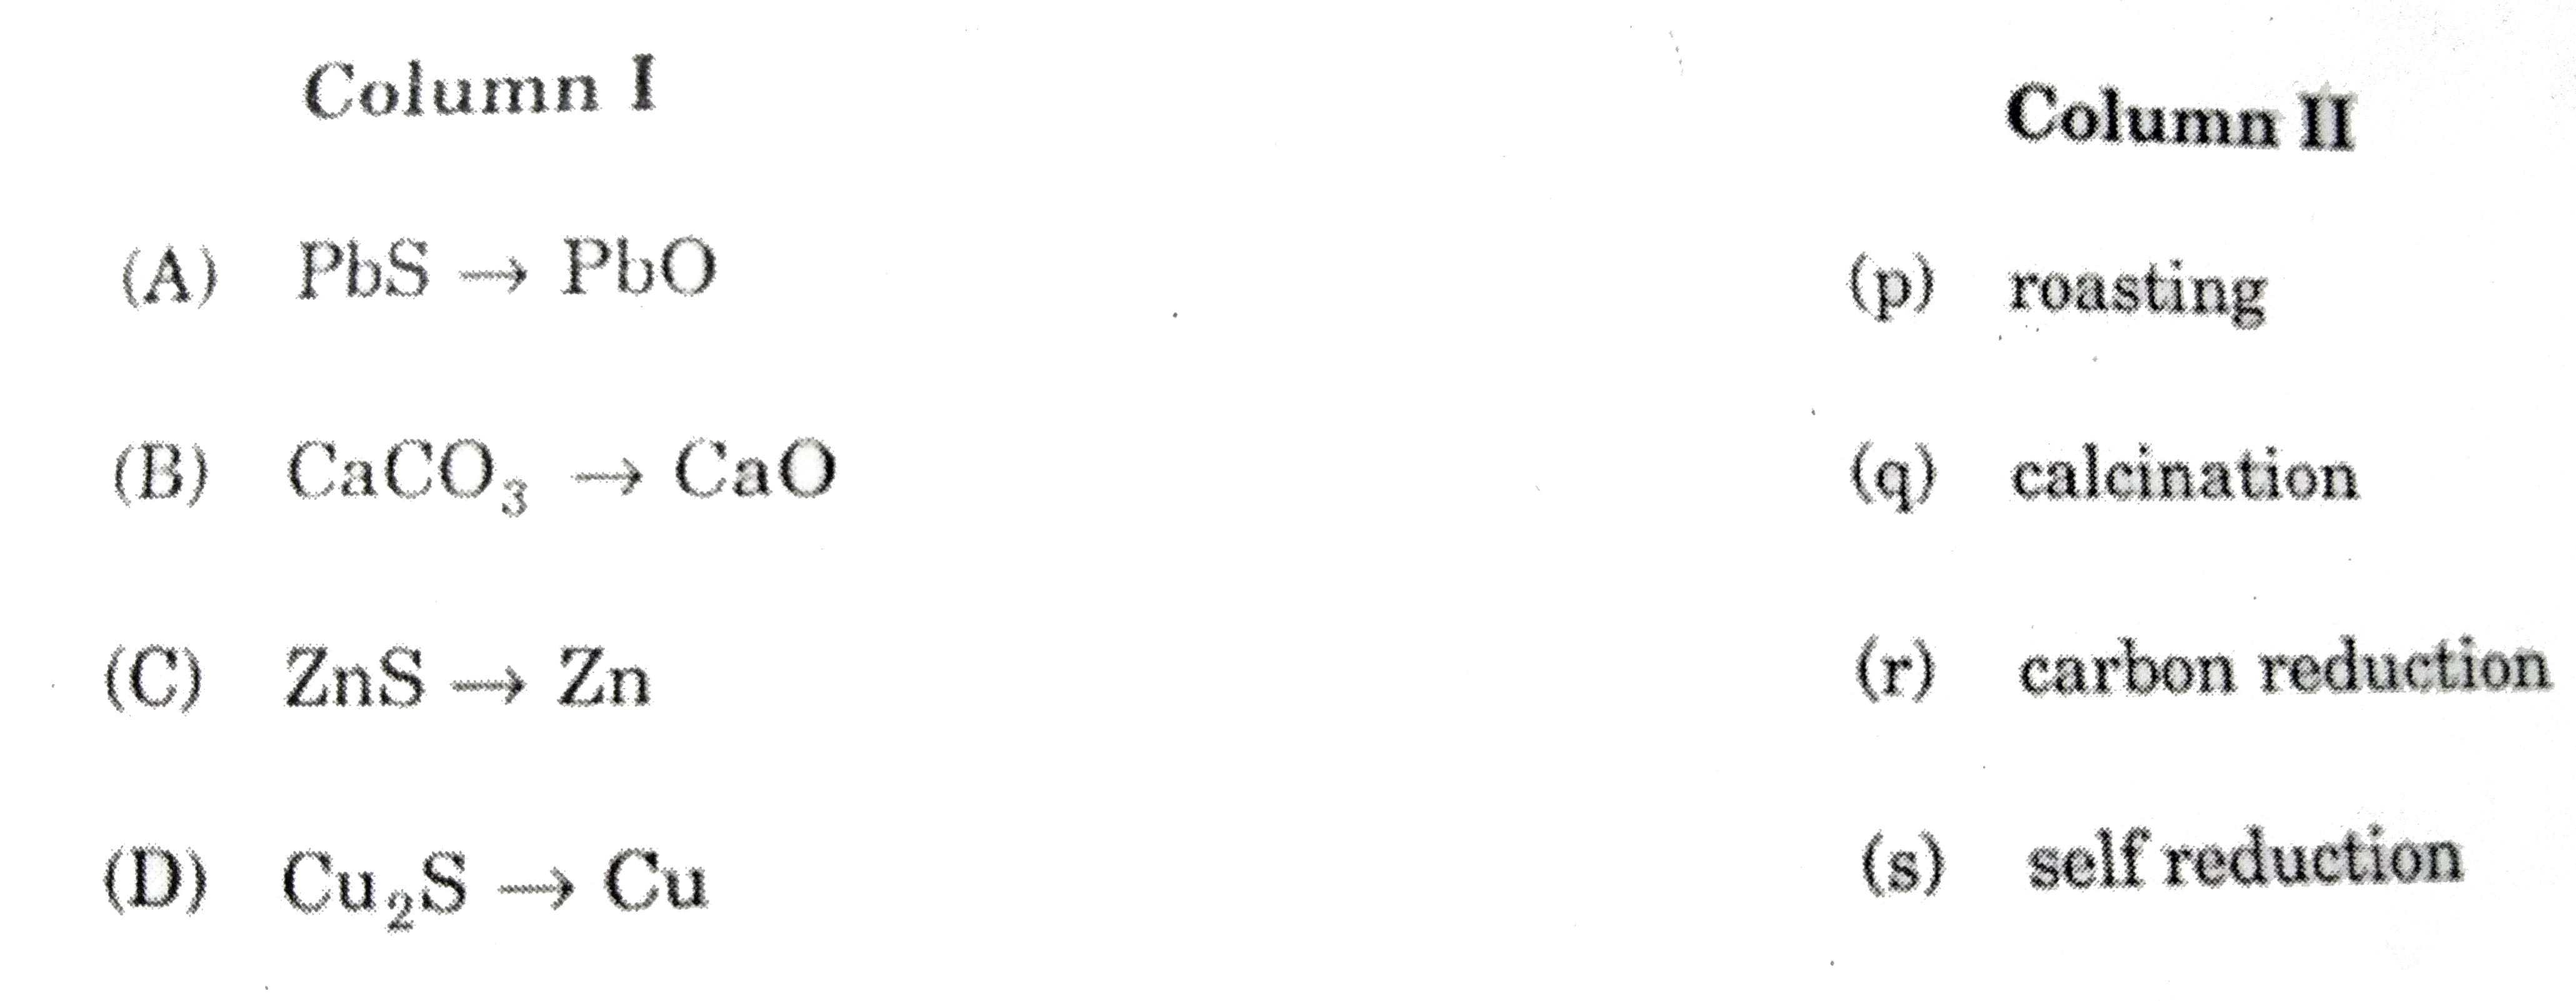
View SolutionMatch the conversions in Column I with the type(s) of reaction(s) given in Column II. Indicate your answer by darkening the appropriate bubbles of the 4×4 matrix given in the ORS.
View SolutionMatch the compounds/ions in Column I with their properties/reactions in Column It. Indicate your answer by darkening the appropriate bubbles of the 4×4 matrix given in the ORS.

View SolutionMatch the complexes in column I with their properties listed in column II. Indicate your answer by darkening the appropriate bubbles of the 4×4 matrix given in the ORS.
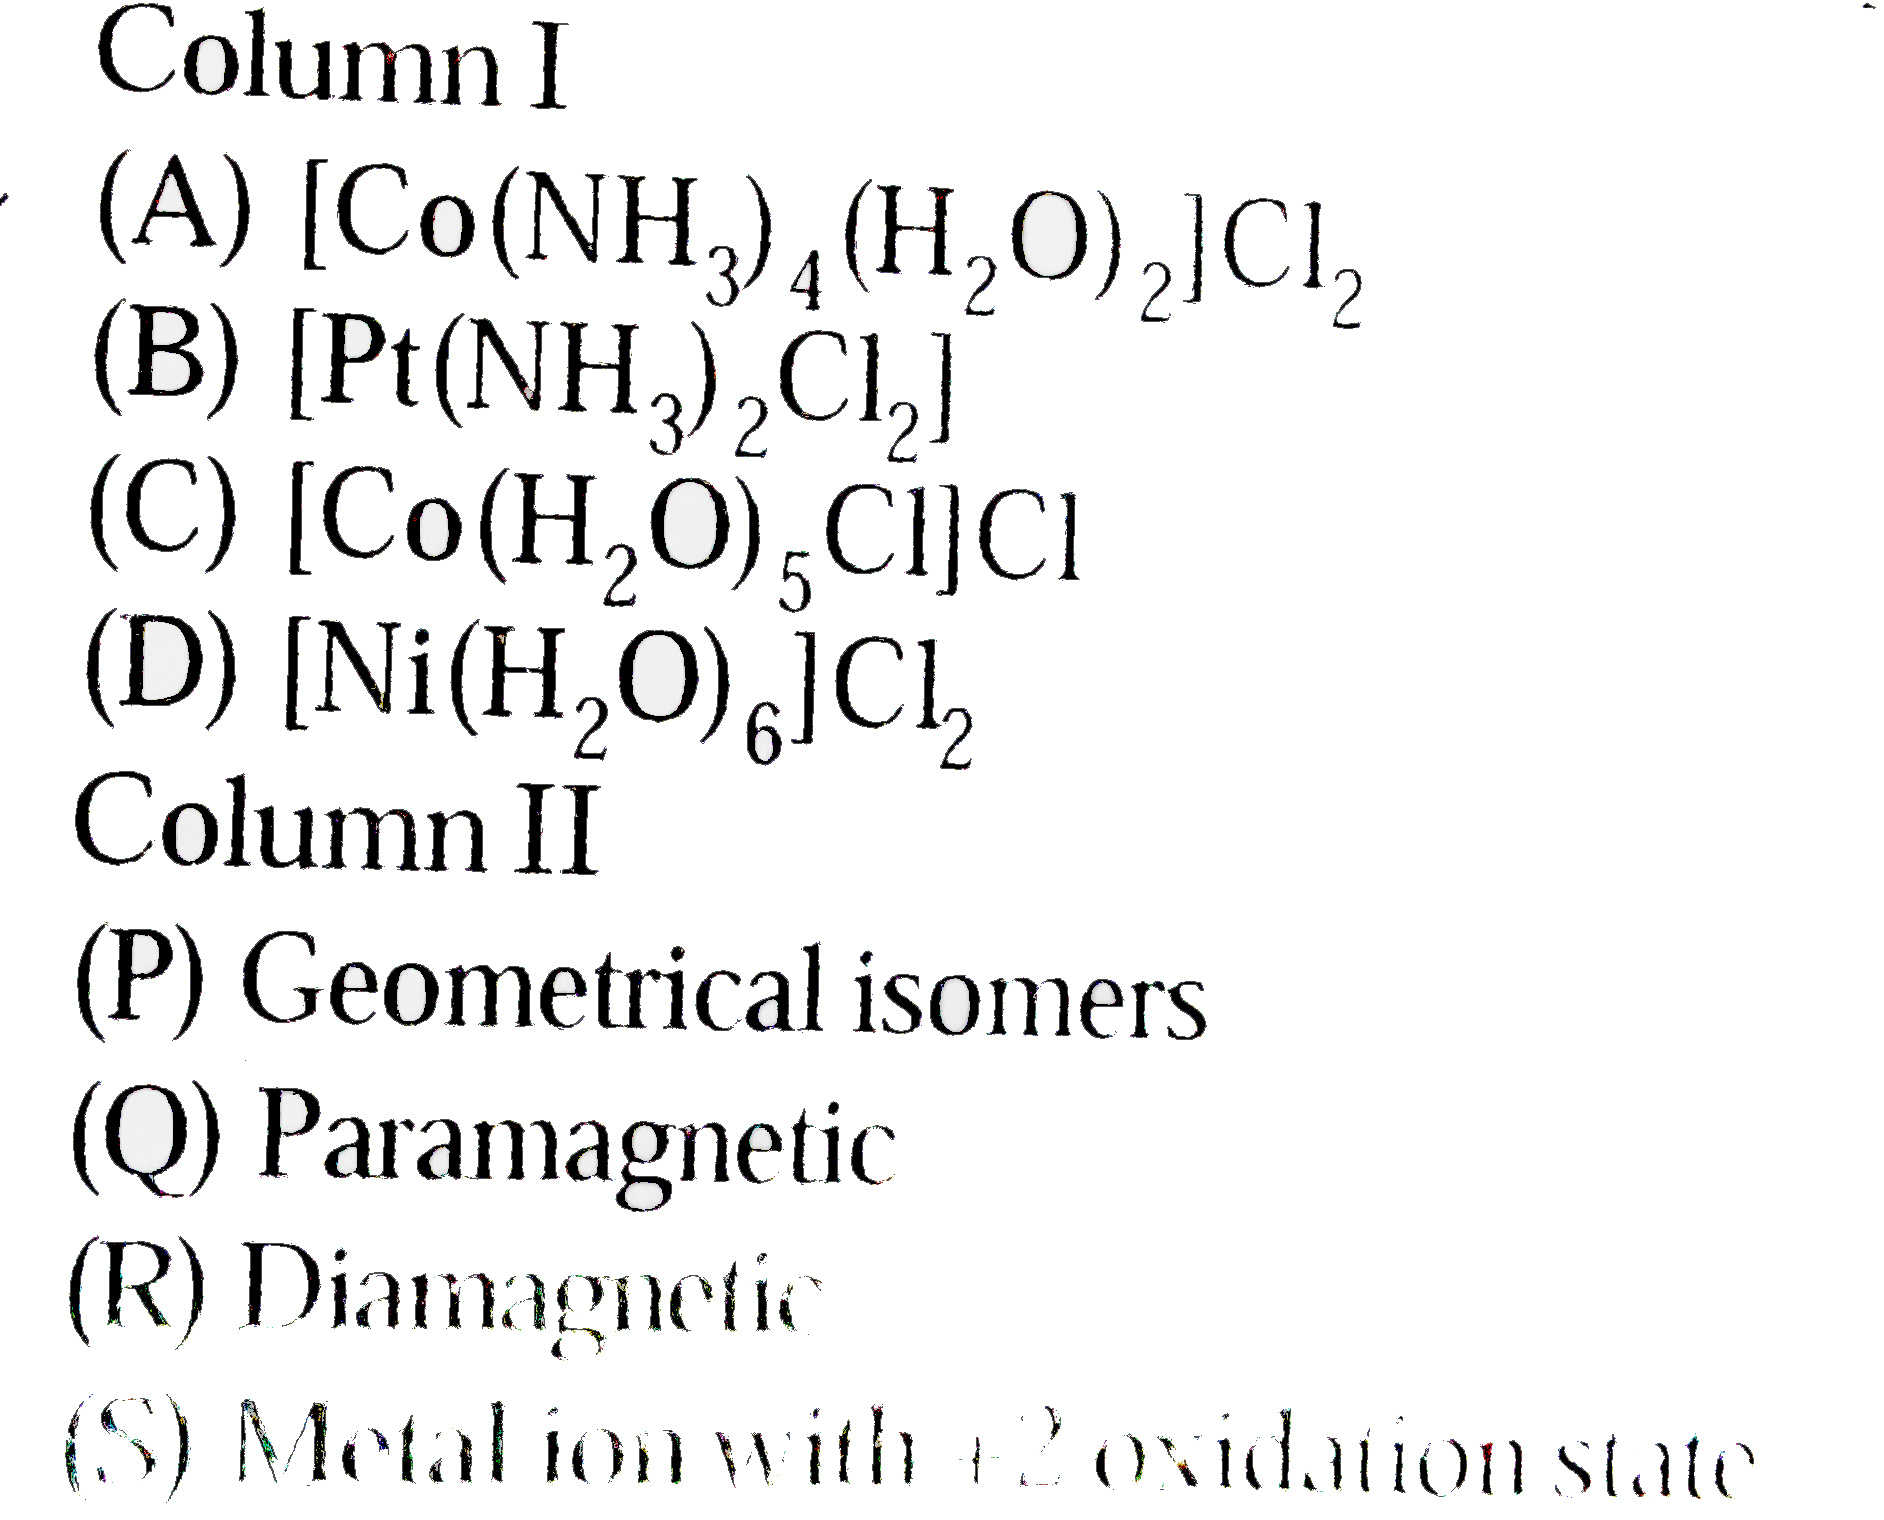
View SolutionMatch the complexes in Column with their properties listed in Column-11. Indicate your answer by darkening the appropriate bubbles of the 4×4 matrix given in the ORS

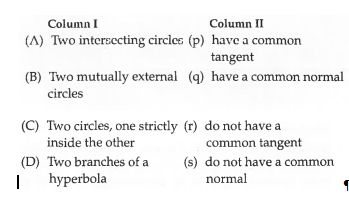
View SolutionMatch the statement in Column I with the properties in Column II and indicate your answer by darkening the appropriate bubbles in the 4×4 matrix.
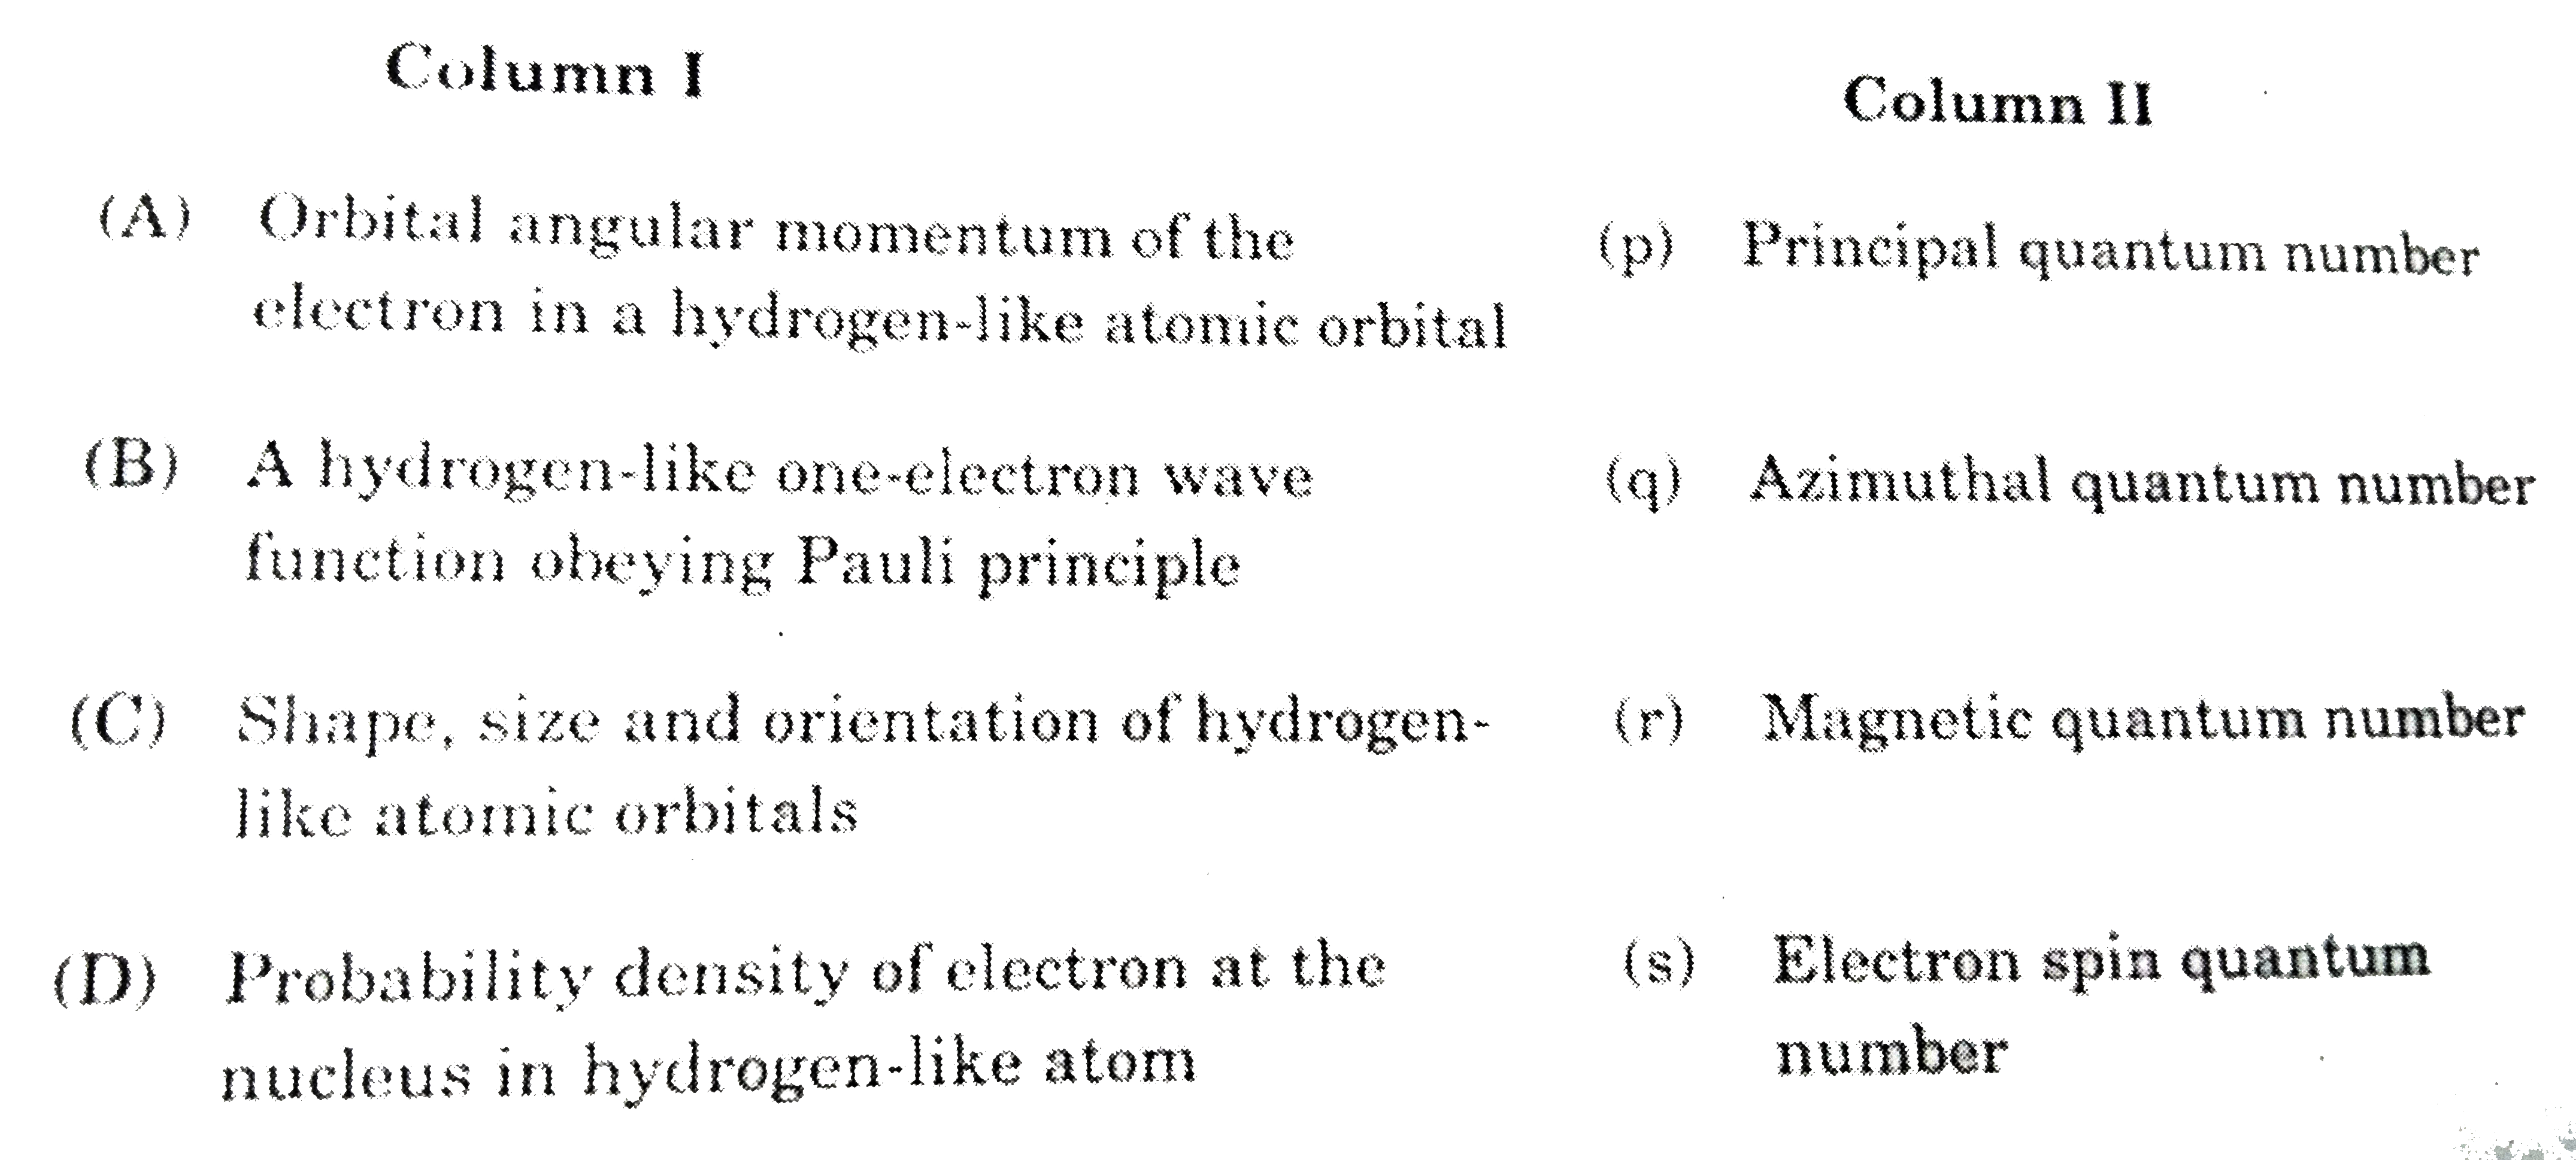
View SolutionMatch the entries in Column I with the correctly related quantum number(s) in Column II. Indicate your answer by darkening the appropriates bubbles of the 4×4 matrix given in the ORS
View Solution
