The ratio of thermionic currents (I/I0) for a metal when the temperature is slowly increased T0 to T as shown in figure. (I and I0 are currents at T and respectively). Then which one is correct?
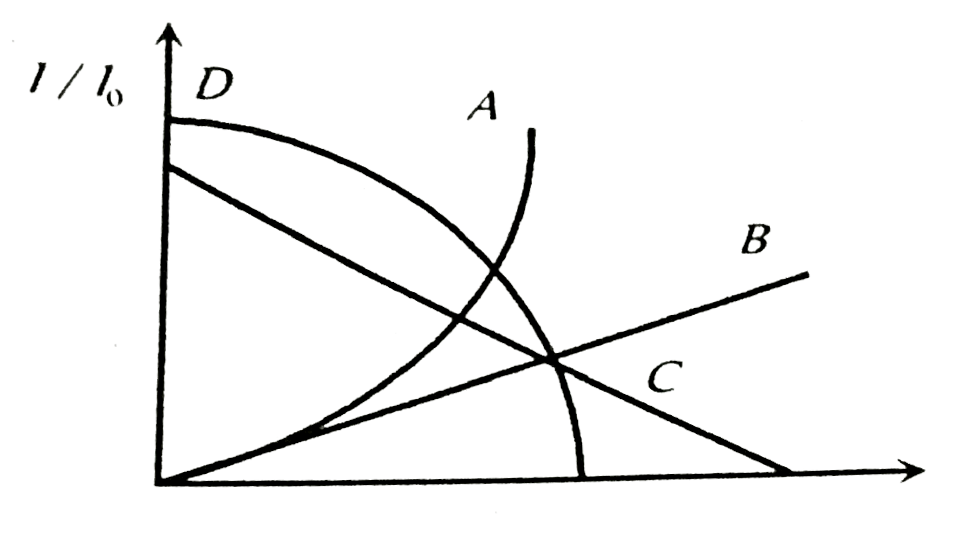
A
B
C
D
The correct Answer is:A
Step by step video, text & image solution for The ratio of thermionic currents (I//I_(0)) for a metal when the temperature is slowly increased T_(0) to T as shown in figure. (I and I_(0) are currents at T and respectively). Then which one is correct? by Physics experts to help you in doubts & scoring excellent marks in Class 12 exams.
Updated on:21/07/2023Topper's Solved these Questions
- ELECTRONICSBOOK - ERRORLESS CHAPTER - ELECTRONICSEXERCISE - Digital Electronics
2 Videos
- ELECTRONICSBOOK - ERRORLESS CHAPTER - ELECTRONICSEXERCISE - Valve Electronics (Diode and Triode)
3 Videos
- ELECTRON, PHOTON, PHOTOELECTRIC EFFECT AND X-RAYSBOOK - ERRORLESS CHAPTER - ELECTRON, PHOTON, PHOTOELECTRIC EFFECT AND X-RAYSEXERCISE - Self Evaluation Test
3 Videos
- ELECTROSTATICS BOOK - ERRORLESS CHAPTER - ELECTROSTATICS EXERCISE - Ordinary Thinking Objective Questions (Electric Flux and Gauss.s Law)
28 Videos
Similar Questions
Knowledge Check
The current (i) at time t= 0 and t=∞ respectively for the given circuit is :
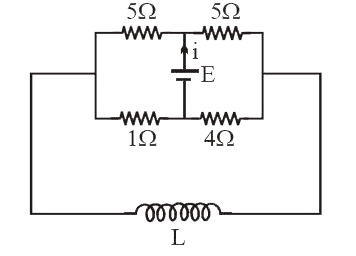 A18E55,5E18B10E33,5E18C5E18,18E55D5E18,10E33
In the circuit as shown in figure, the ratio of current i1/i2 is
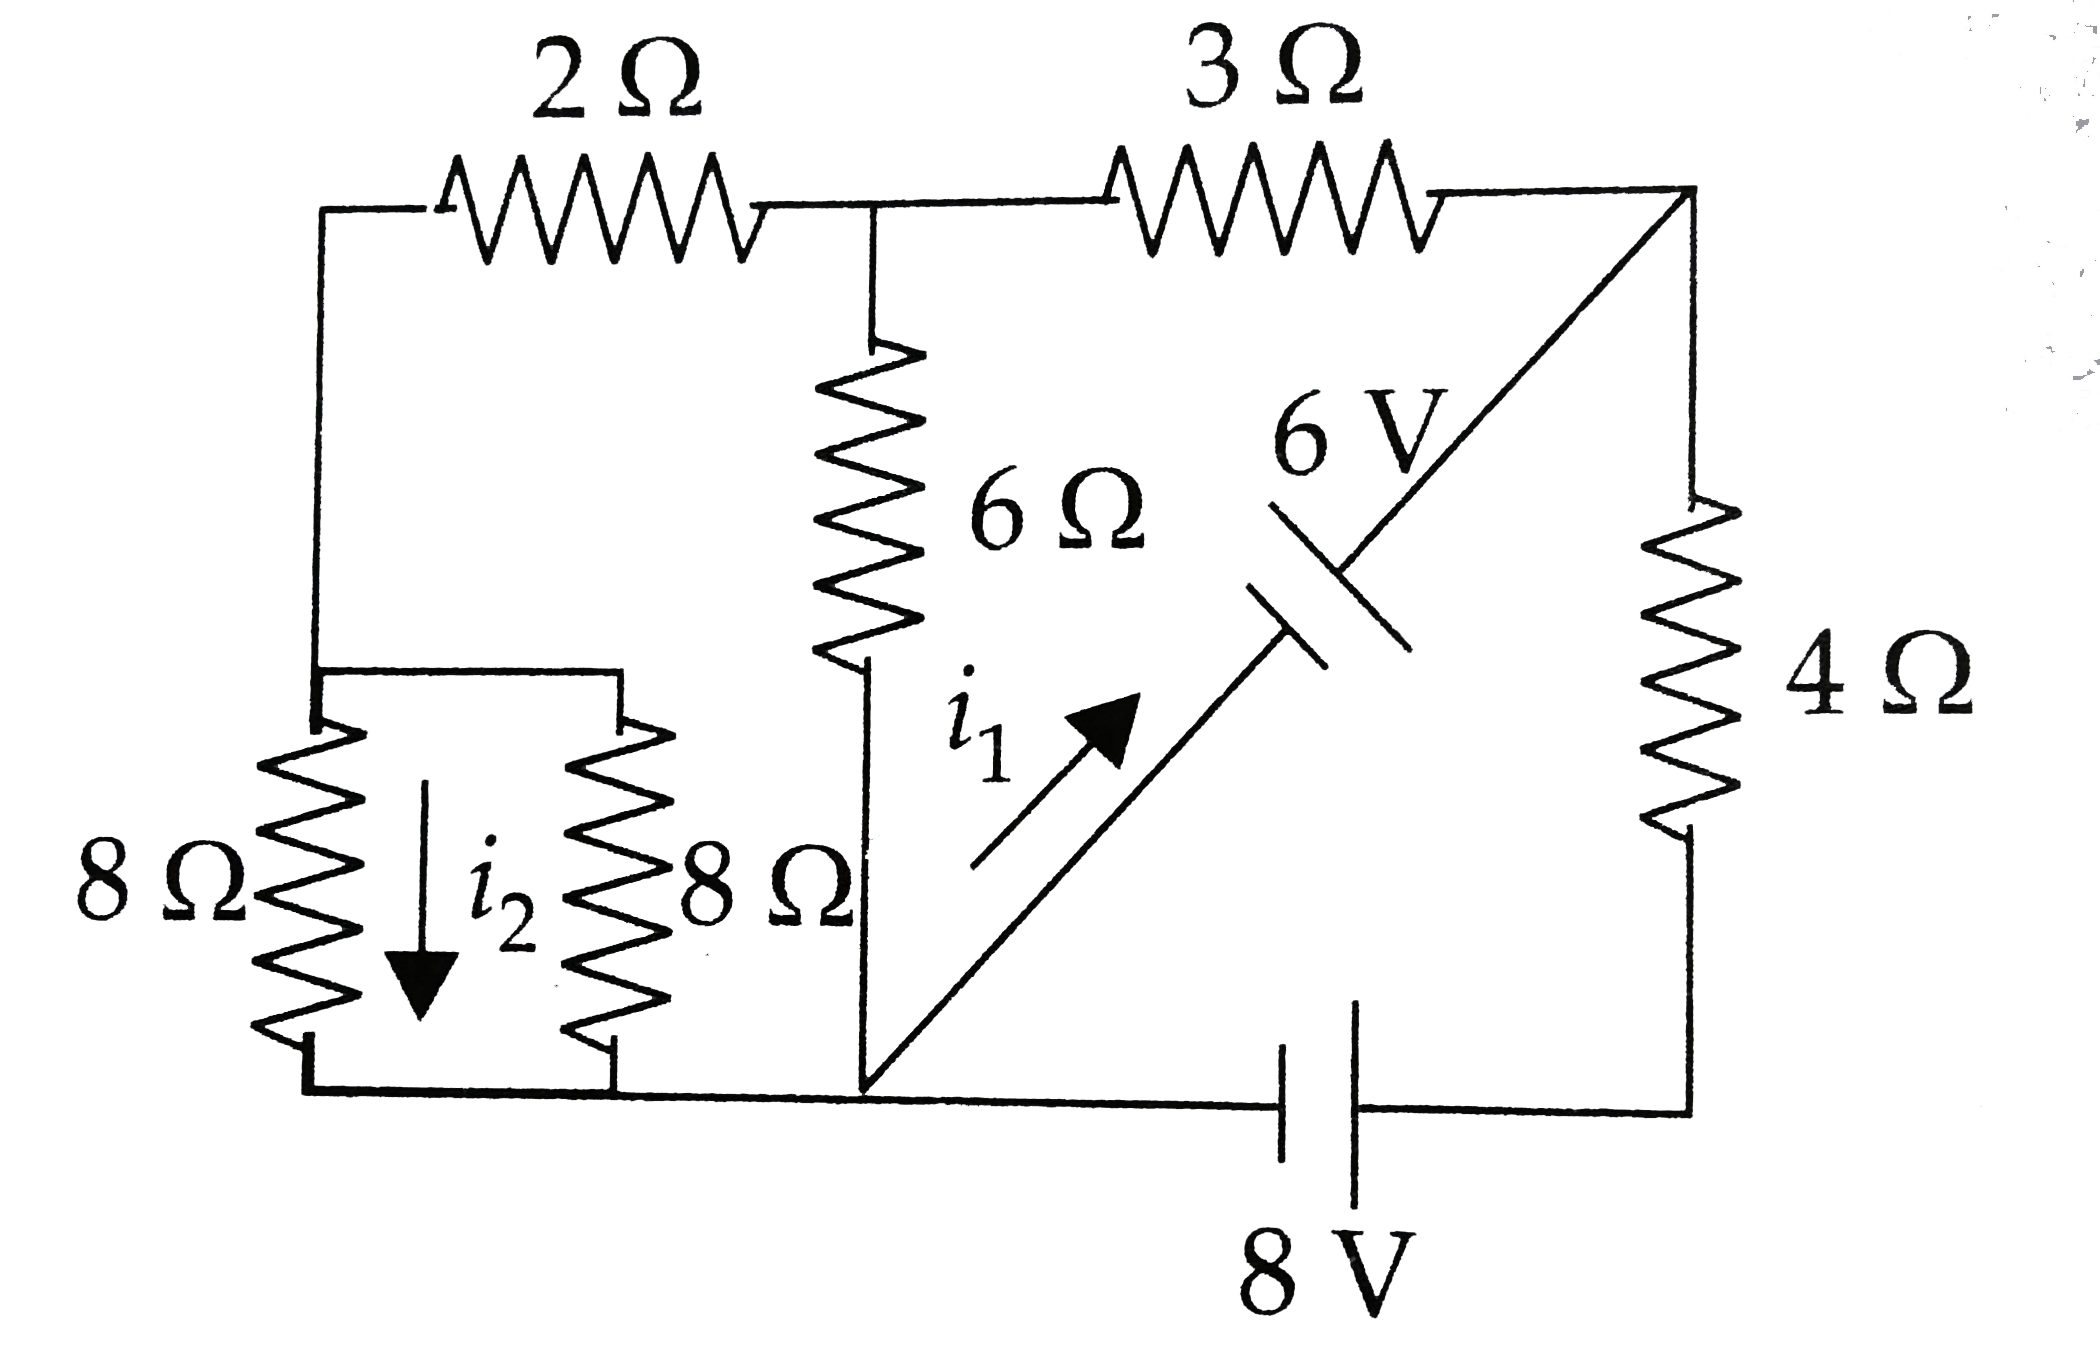 A4/3B1/2C2Dnone of these
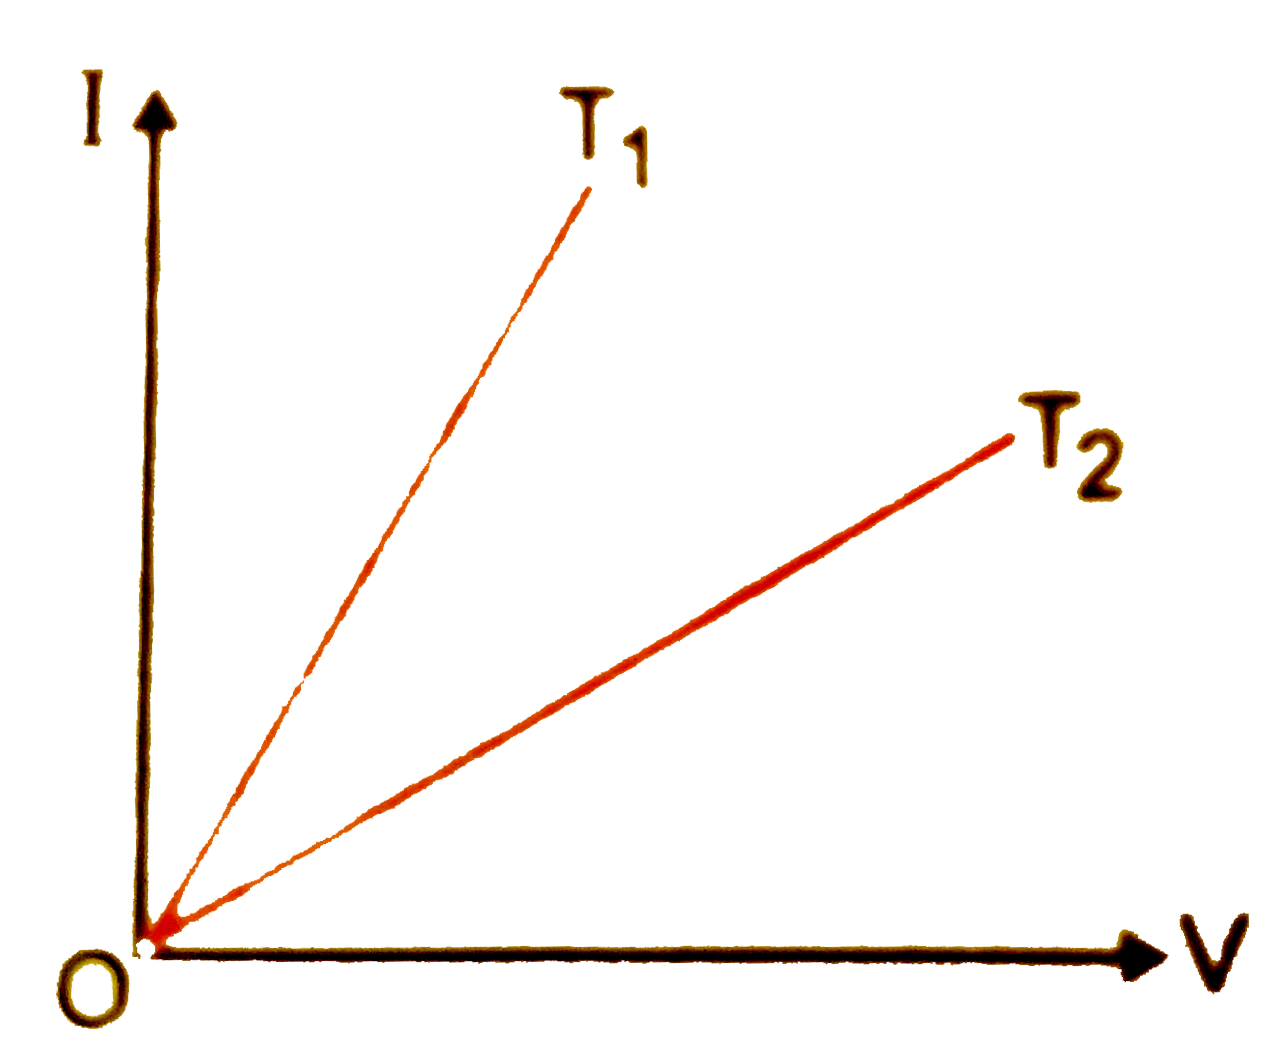
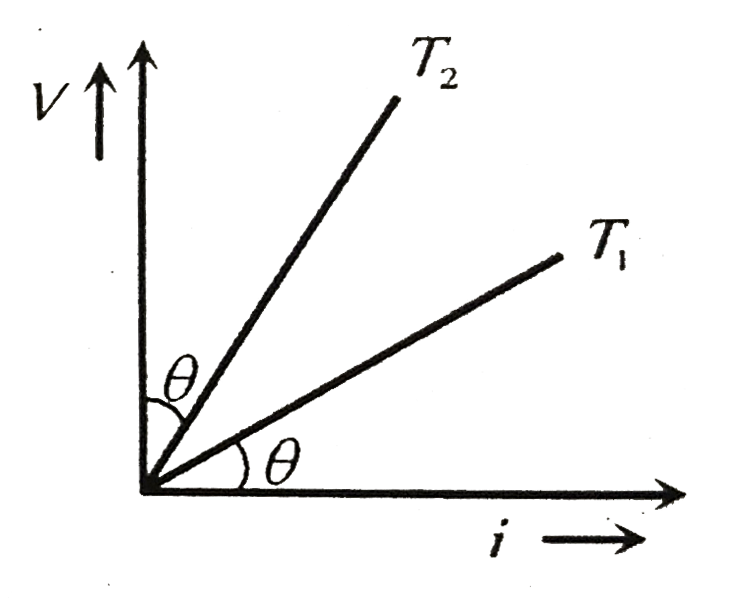
The current (I) and voltage (V) graphs for a given metallic wire at two different temperature (T1) and (T2) are shown in fig. It is concluded that
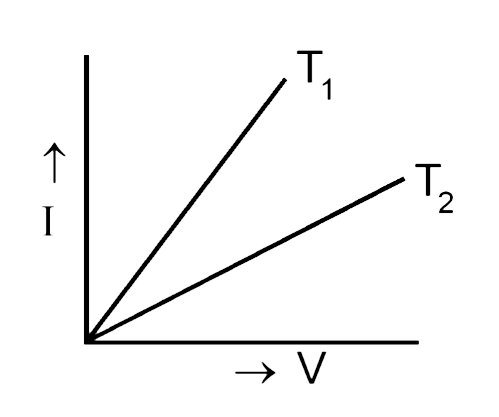 AT1>T2BT1<T2CT1=T2DT1=2T2
The voltage-current (V-I) graph of a metallic conductor at two different temperature T1 and T2 is shown in figure. At which temperature is the resistance higher?
View SolutionThe voltage V and current I v graphs for a conductor at two different temperatures T1andT2 are shown in the figure. The relation between T1andT2 is

View SolutionThe voltage V and current I graph for a conductor at two different temperatures T1 and T2 are shown in the figure. The relation between T1 and T2 is
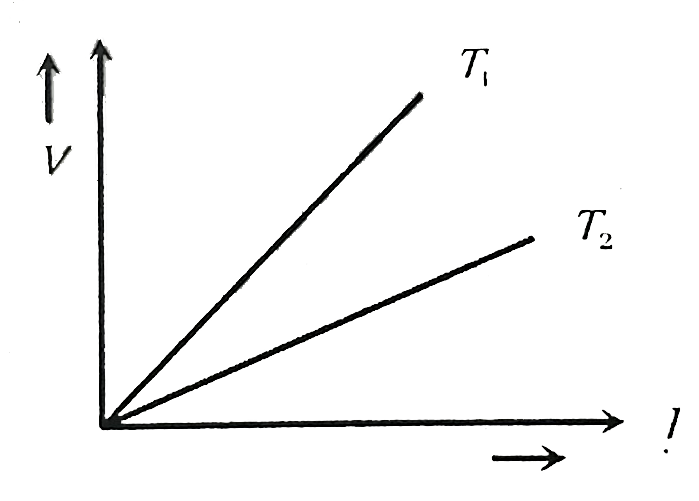
View SolutionThe V - i graph for a conductor at temperature T1 and T2 are as shown in the figure. (T2−T1) is proportional to
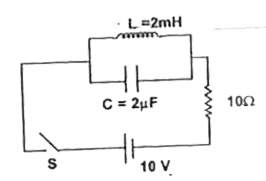
View SolutionThe switch S is closed in the circuit shown at time t=0 . The current in the resistor at t=0 and t=∞ are respectively .
View Solution

