The figure represents variation of triode parameter (μ or r or g_(m))withtheplatecurrent.Thecorrectvariationofmuandr_(p) are given, respectively by the curves
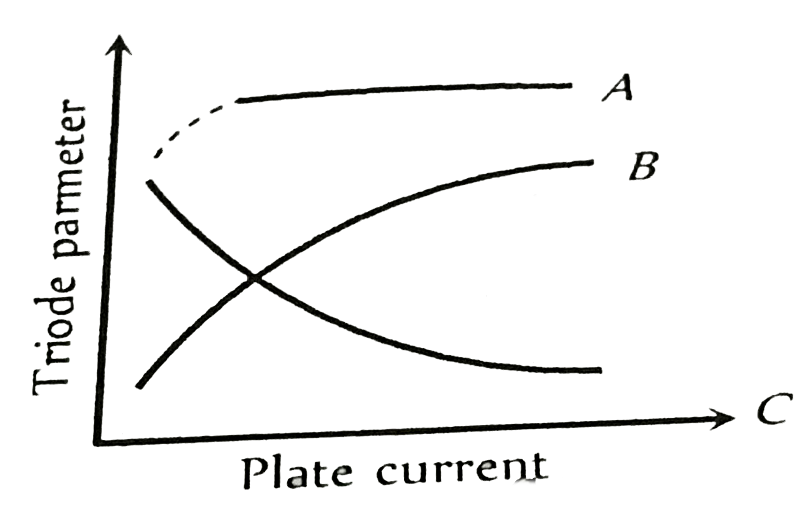
A and B
B and C
A and C
None of the above
The correct Answer is:C
Step by step video, text & image solution for The figure represents variation of triode parameter (mu or r or g_(m)) with the plate current. The correct variation of mu and r_(p) are given, respectively by the curves by Physics experts to help you in doubts & scoring excellent marks in Class 12 exams.
Updated on:21/07/2023Topper's Solved these Questions
- ELECTRONICSBOOK - ERRORLESS CHAPTER - ELECTRONICSEXERCISE - Digital Electronics
2 Videos
- ELECTRONICSBOOK - ERRORLESS CHAPTER - ELECTRONICSEXERCISE - Valve Electronics (Diode and Triode)
3 Videos
- ELECTRON, PHOTON, PHOTOELECTRIC EFFECT AND X-RAYSBOOK - ERRORLESS CHAPTER - ELECTRON, PHOTON, PHOTOELECTRIC EFFECT AND X-RAYSEXERCISE - Self Evaluation Test
3 Videos
- ELECTROSTATICS BOOK - ERRORLESS CHAPTER - ELECTROSTATICS EXERCISE - Ordinary Thinking Objective Questions (Electric Flux and Gauss.s Law)
28 Videos
Similar Questions
The given plots represent the variation of the concentration of a reactant R with time for two different reaction (i) and (ii) The respective orders of the reactions are
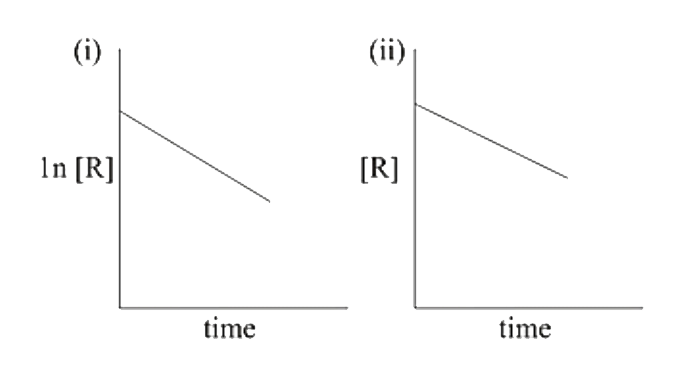
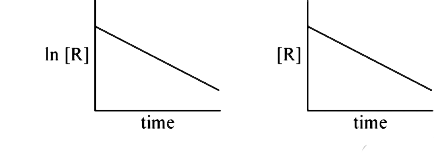
View SolutionThe given plots represent the variation of the concentration of a reactant R with time for different reactions (i) and (ii). The respective orders of the reactions are:
View Solution
Knowledge Check
The correct variation of resistance R with frequency f is given by
A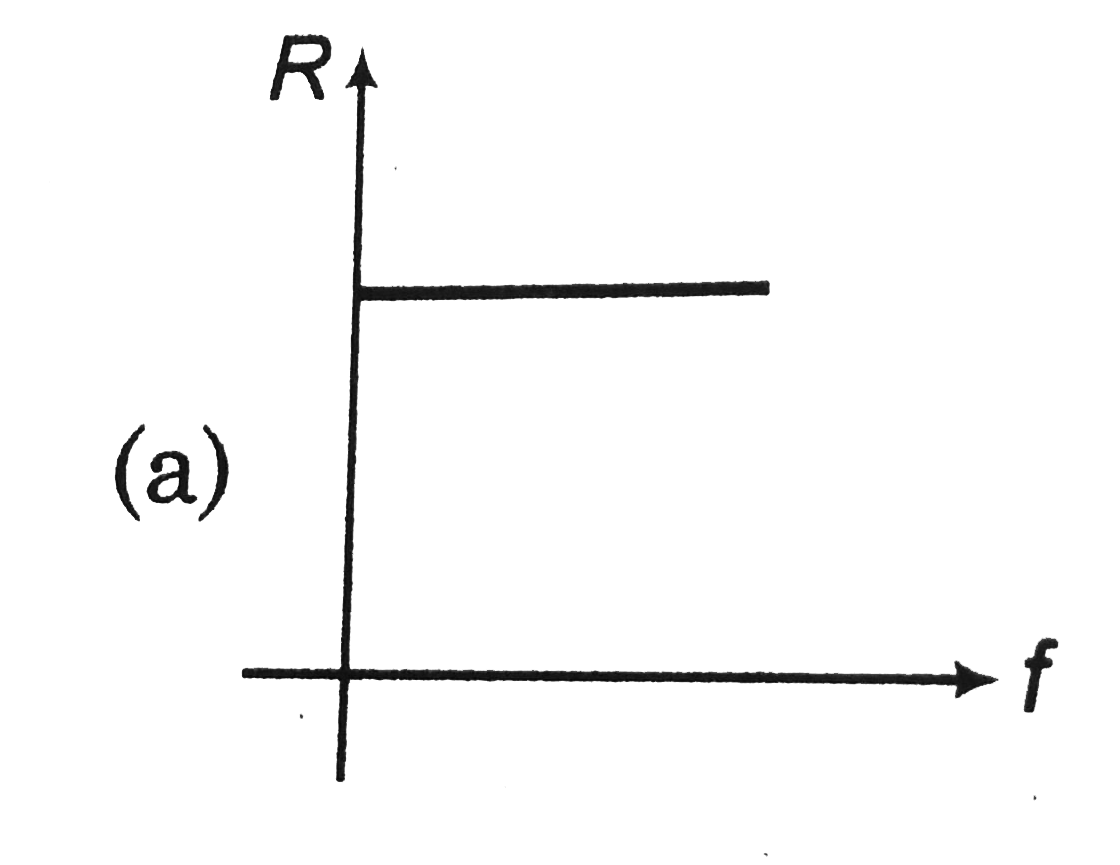 B
B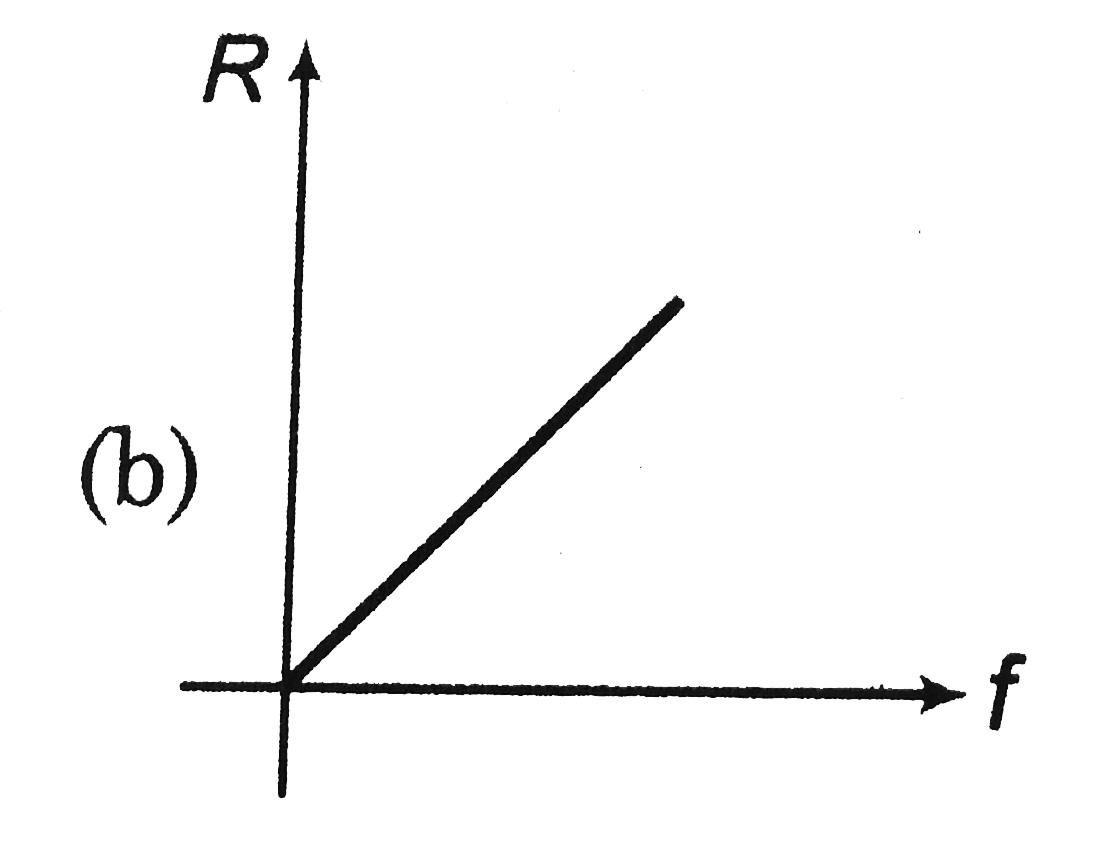 C
C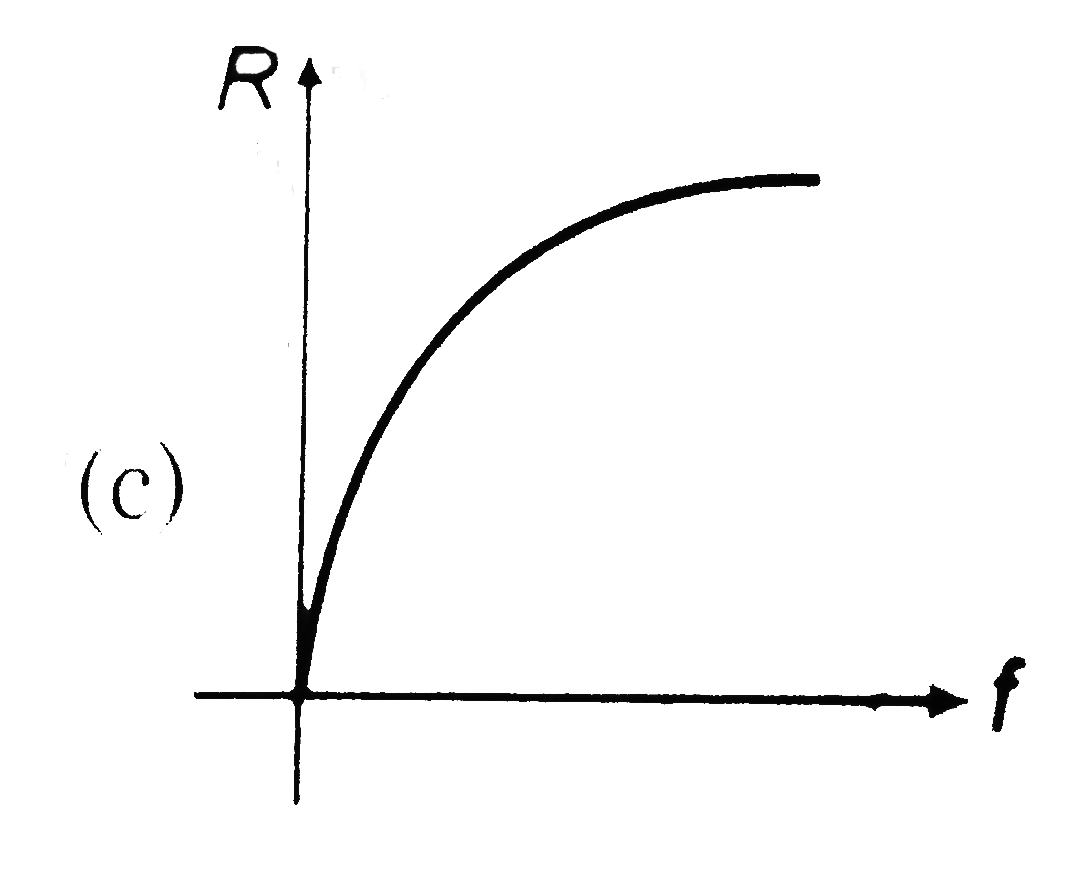 D
D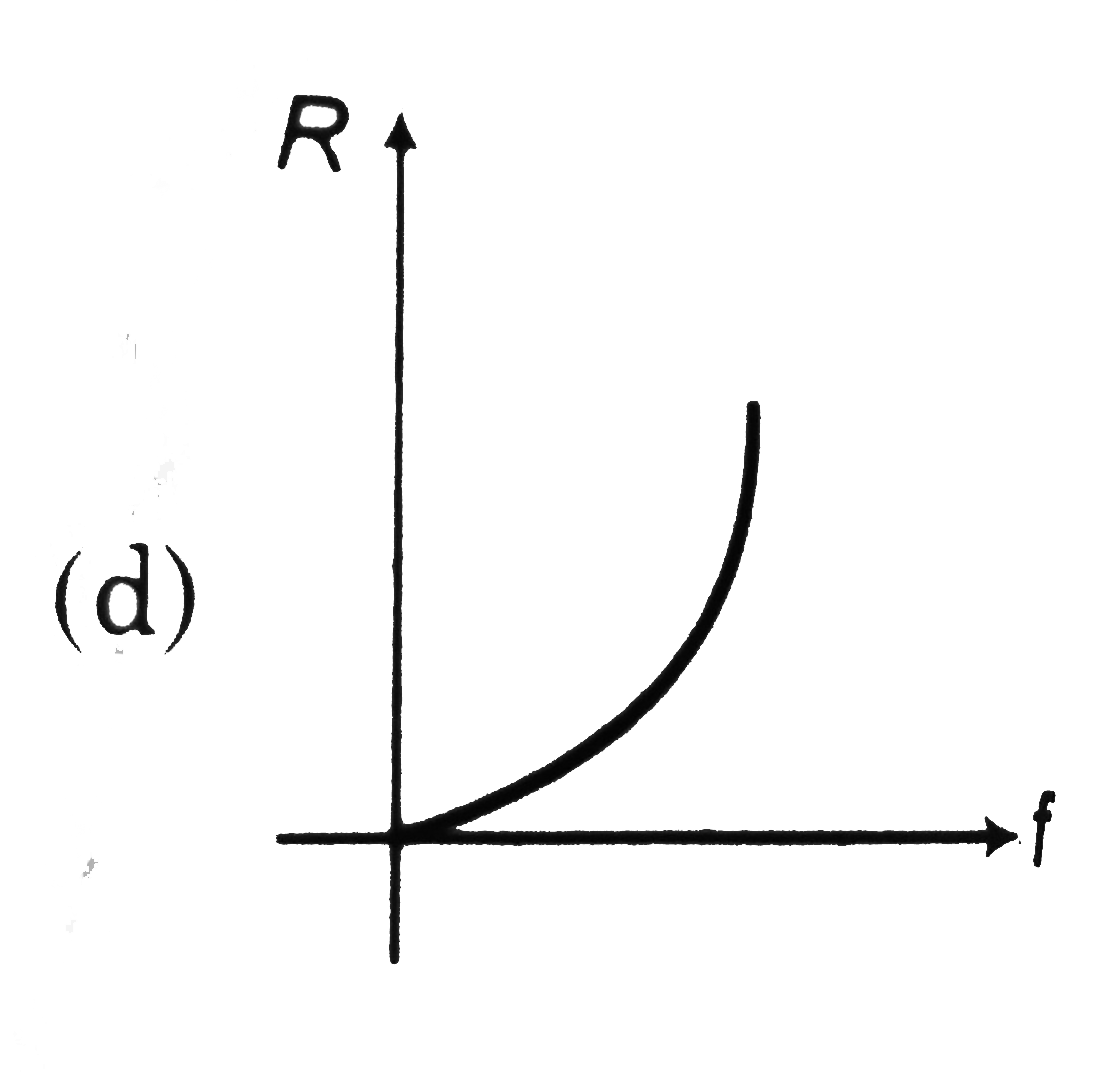
For a vacuum triode, the values of Ec, Eb and lb are given as under

The values of μ and rp are given byAμ=12,rp=10kΩBμ=12,rp=20kΩCμ=10,rp=20kΩDμ=20,rp=10kΩWhich of the following curve represents the variation of λm with √C for AgNO3?
A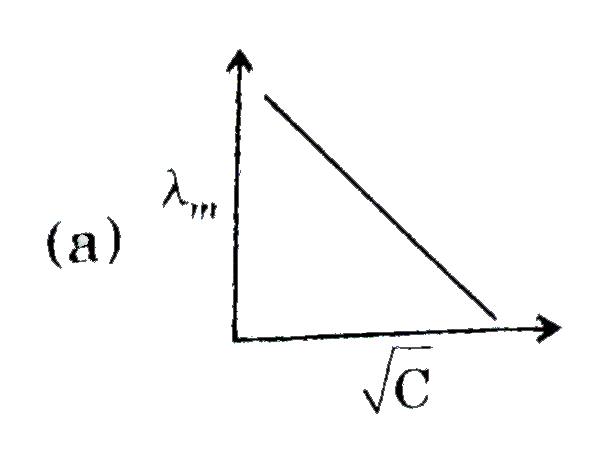 B
B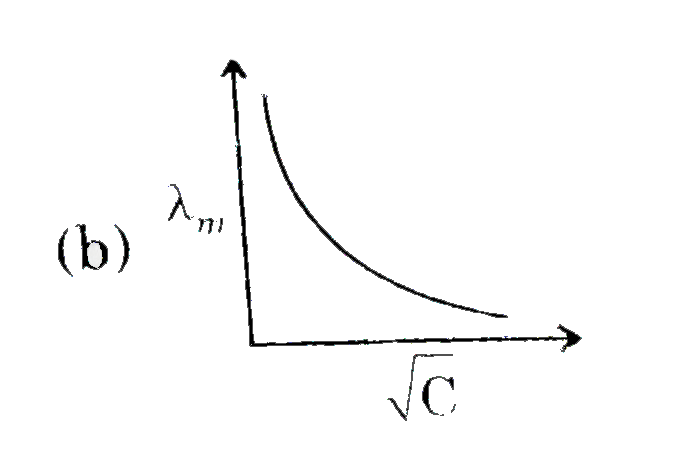 C
C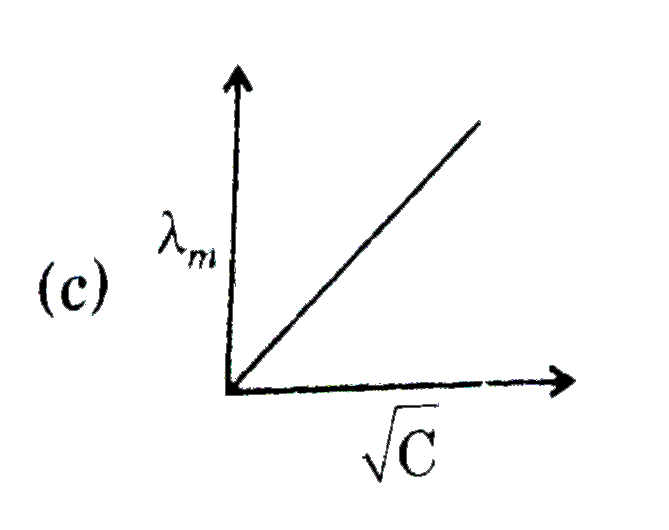 D
D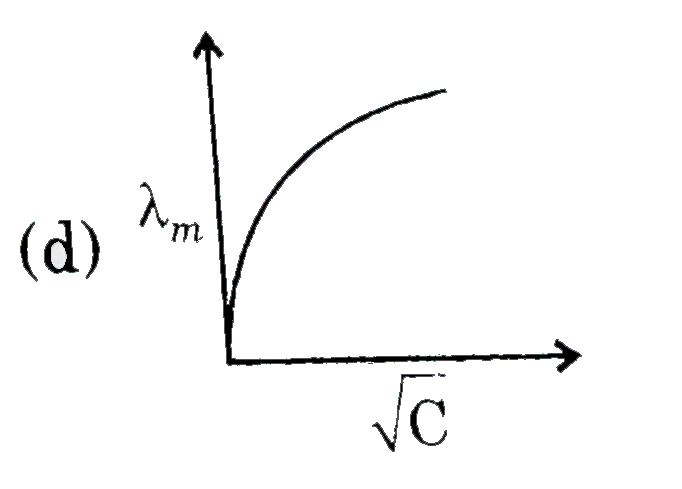
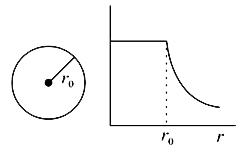
The given graph shows variation (with distance r form center) of :
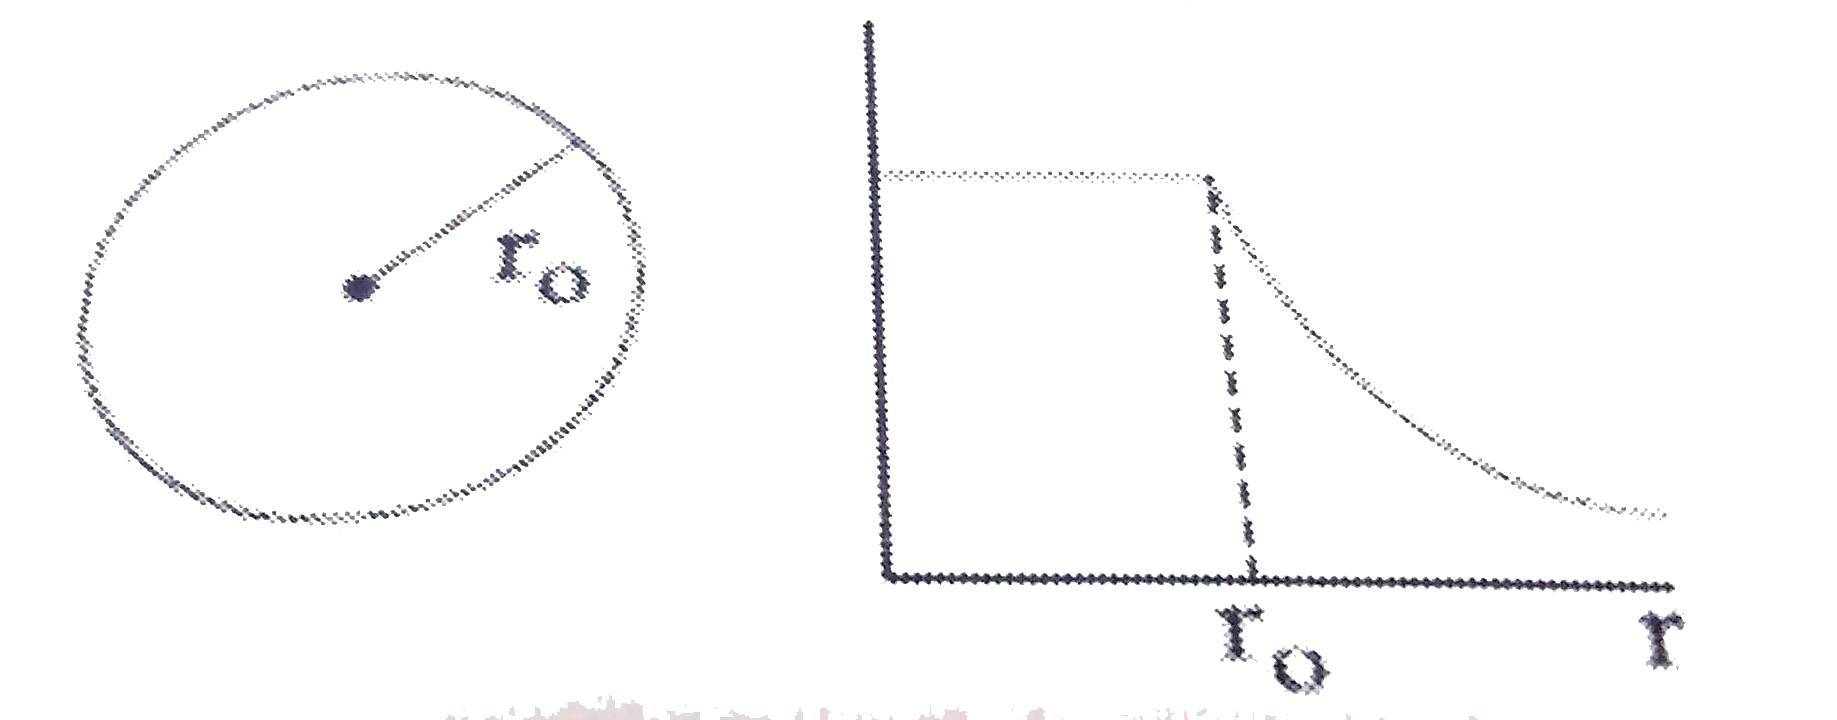
View SolutionThe given graph shows variation (with distance r from centre) of:
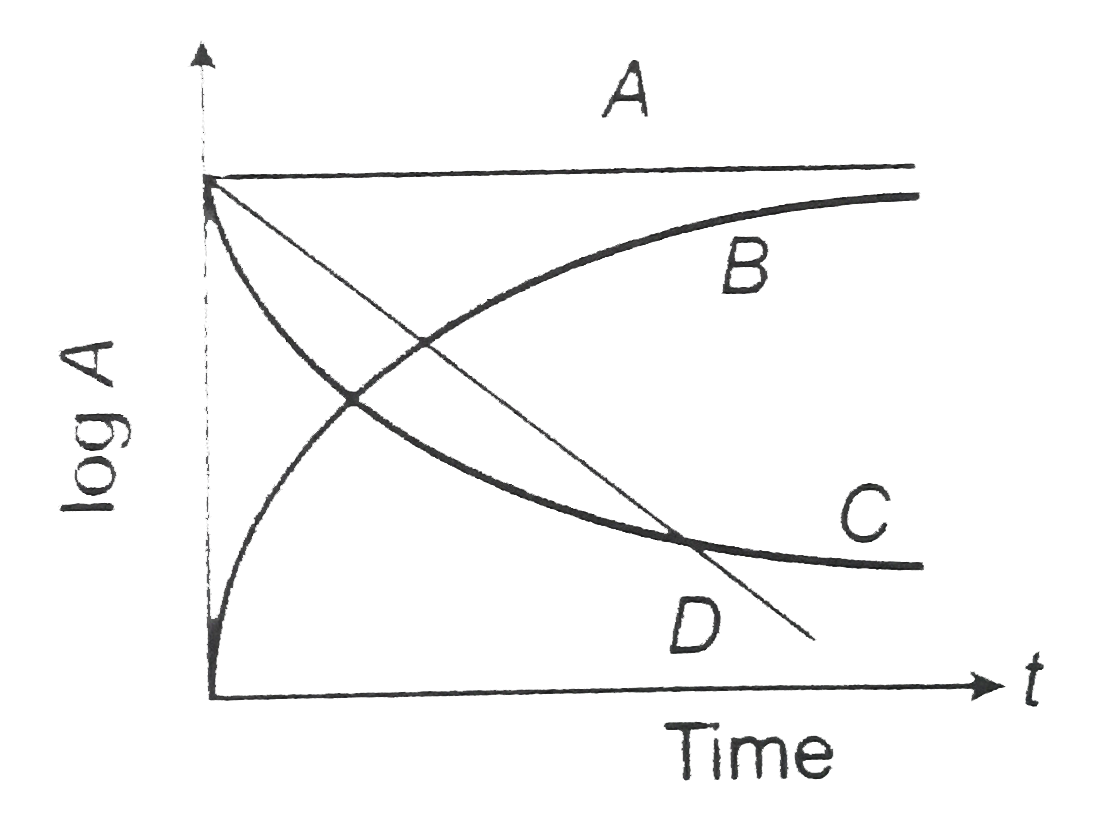
View SolutionThe graph which represents the correct variation of logarithm of activity (log A) versus time, in figure is.
 .
.
View SolutionWhich of the following curve represents the variation of λM with √C for AgNO3?
View SolutionThe given curve represents the variation of temperatue as a function of volume for one mole of an ideal gas. Which of the following curves best represents the variation of pressure as a function of volume ?
(##DCP_V03_C20_E01_099_Q01##).
View Solution
