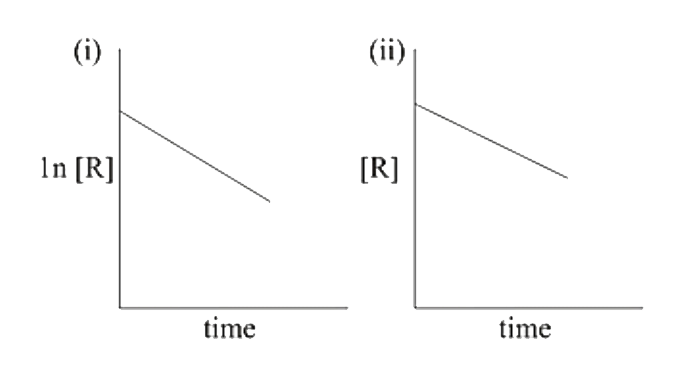
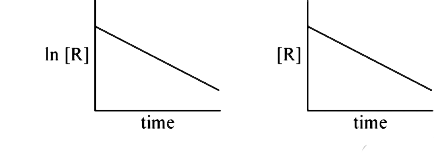
The given plots represent the variation of the concentration of a reactant R with time for two different reaction (i) and (ii) The respective orders of the reactions are

1, 0
1, 1
0, 1
0, 2
The correct Answer is:A
Step by step video & image solution for The given plots represent the variation of the concentration of a reactant R with time for two different reaction (i) and (ii) The respective orders of the reactions are by Chemistry experts to help you in doubts & scoring excellent marks in Class 12 exams.
Updated on:21/07/2023Topper's Solved these Questions
Similar Questions
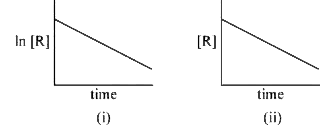
The given plots represent the variation of the concentration of a reactant R with time for different reactions (i) and (ii). The respective orders of the reactions are:

View SolutionThe given plots represent the variation of the concentration of a reactant R with time for different reactions (i) and (ii). The sum of orders of the reactions is ________ .

View Solution
Knowledge Check
The given plots represent the variation of the concentration of a reactant R with time for two different reaction (i) and (ii) The respective orders of the reactions are
 A1,0B1,1C0,1D0,2
For a first order reaction, the concentration of reactant :
Ais independent of timeBvaries linearly with timeCvaries exponentially with timeDNoneFor a second order reaction, half-life concentration of reactants:
AIndependent of initial concentration of reactantsBDirectly proportional to concentration of reactantsCInversely proportional to concentration of reactantsDInversely proportional to the square of concentration of reactants
In a reaction if the concentration of reactant A is tripled, the rate of reaction becomes twenty seven times. What is the order of reaction?
View SolutionIn a reaction if the concentration of reactant A is tripled, the rate of reaction becomes twenty seven times. What is the order of reaction?
View SolutionFor a given reaction the logarithm of the concentration of the reactant plotted against time gave a straight line with negative slope . The order of the reaction is
View SolutionIf the concentration of the reactants is increased, the rate of reaction for first order-
View SolutionIn a reaction, when the concentration of reactant is increased two times, the increase in rate of reaction was four times. Order of reaction is :
View Solution
