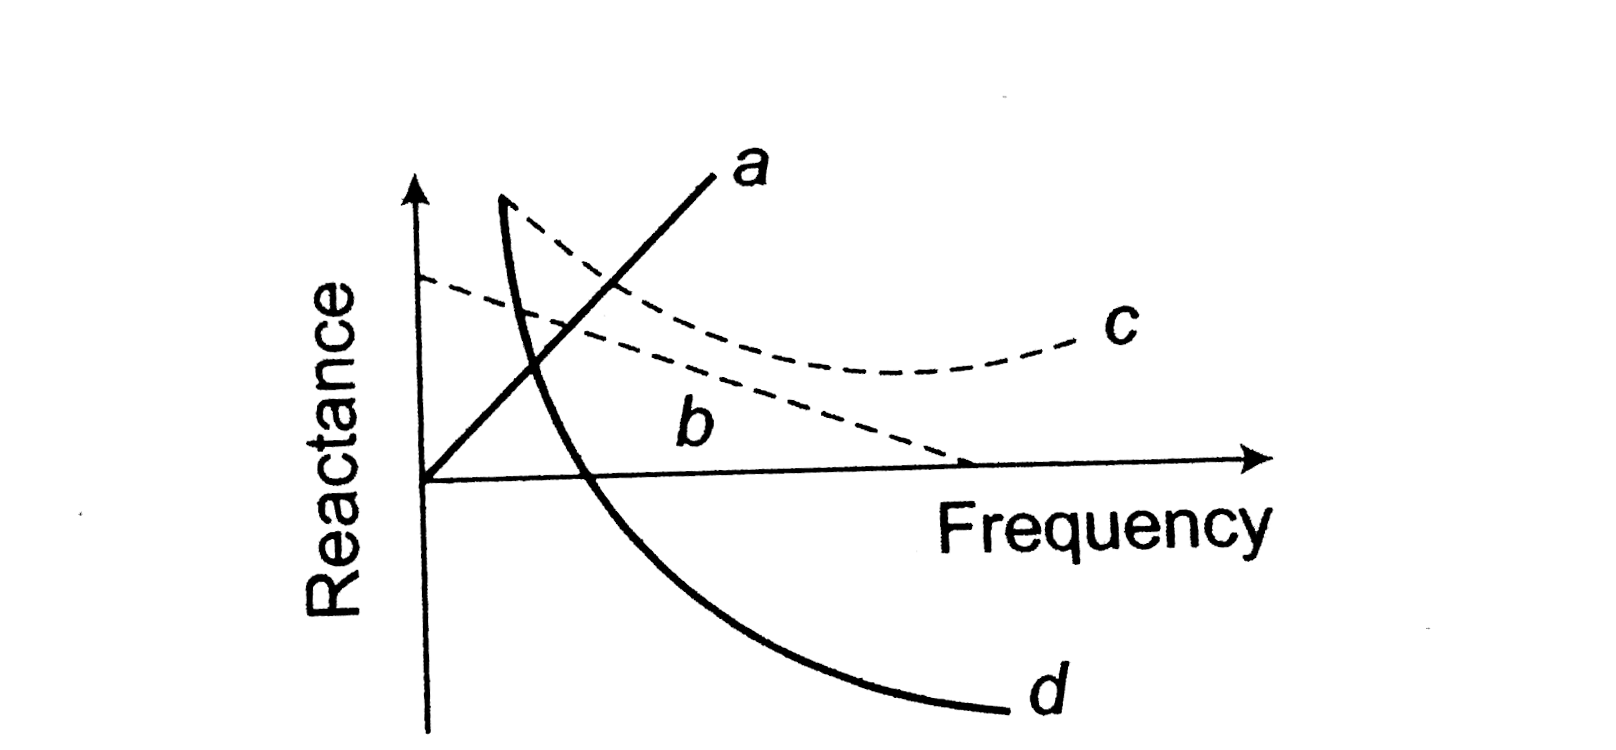
Which of the following plots may represent the thermal energy produced in a resistor for a given current as a function of time?

a
b
c
d
The correct Answer is:D
Step by step video, text & image solution for Which of the following plots may represent the thermal energy produced in a resistor for a given current as a function of time? by Physics experts to help you in doubts & scoring excellent marks in Class 12 exams.
Updated on:21/07/2023Topper's Solved these Questions
- HEATING EFFECT OF CURRENTBook:CENGAGE PHYSICSChapter:HEATING EFFECT OF CURRENTExercise:Thermal Power in Resistance Connected in Circuit
Explore 28 Videos
- HEATING EFFECT OF CURRENTBook:CENGAGE PHYSICSChapter:HEATING EFFECT OF CURRENTExercise:Integer
Explore 5 Videos
- GRAVITATIONBook:CENGAGE PHYSICSChapter:GRAVITATIONExercise:Question Bank
Explore 39 Videos
- INDUCTANCEBook:CENGAGE PHYSICSChapter:INDUCTANCEExercise:Concept Based
Explore 9 Videos
Similar Questions
Knowledge Check
Which of the following plots represents an ideal binary mixture?
Aplot of Ptotalv/s1/XB is linear (XB= mole fraction of 'B' in liquid phase)Bplot of Ptotalv/sYA is linear (YB= mole fraction of 'A' in vapour phase)Cplot of 1Ptotalv/sYA is linearDplot of 1Ptotalv/sYB is non linearWhich of the following plots represents an ideal binary mixture?
APlot of Ptotal v/s 1/XB is linear (XB= mole fraction of 'B' in liquid phase).BPlot of Ptotal v/s 1/XB is linear (YB= mole fraction of 'A' in vapour phase)CPlot of 1Ptotalv/s YA is linearDPlot of 1Ptotalv/s YB is non linearWhich of the following plots represents an exothermic reaction?
A B
B C
C D
D
Which of the following plots represents an ideal binary mixture ?
View SolutionWhich of the following plots may represent the reactance of a series LC combination?

View SolutionWhich of the following plots does not represent Boyle's law?
View SolutionWhich of the following plots may represent is impedence of a series LCR combination?
View SolutionWhich of the following curves may represent the speed of the electron in a hydrogen atom as a function of the principal quantum number n ?
View Solution

