The cyclic process form a circle on a pV diagram as shown in figure. The work done by the gas is 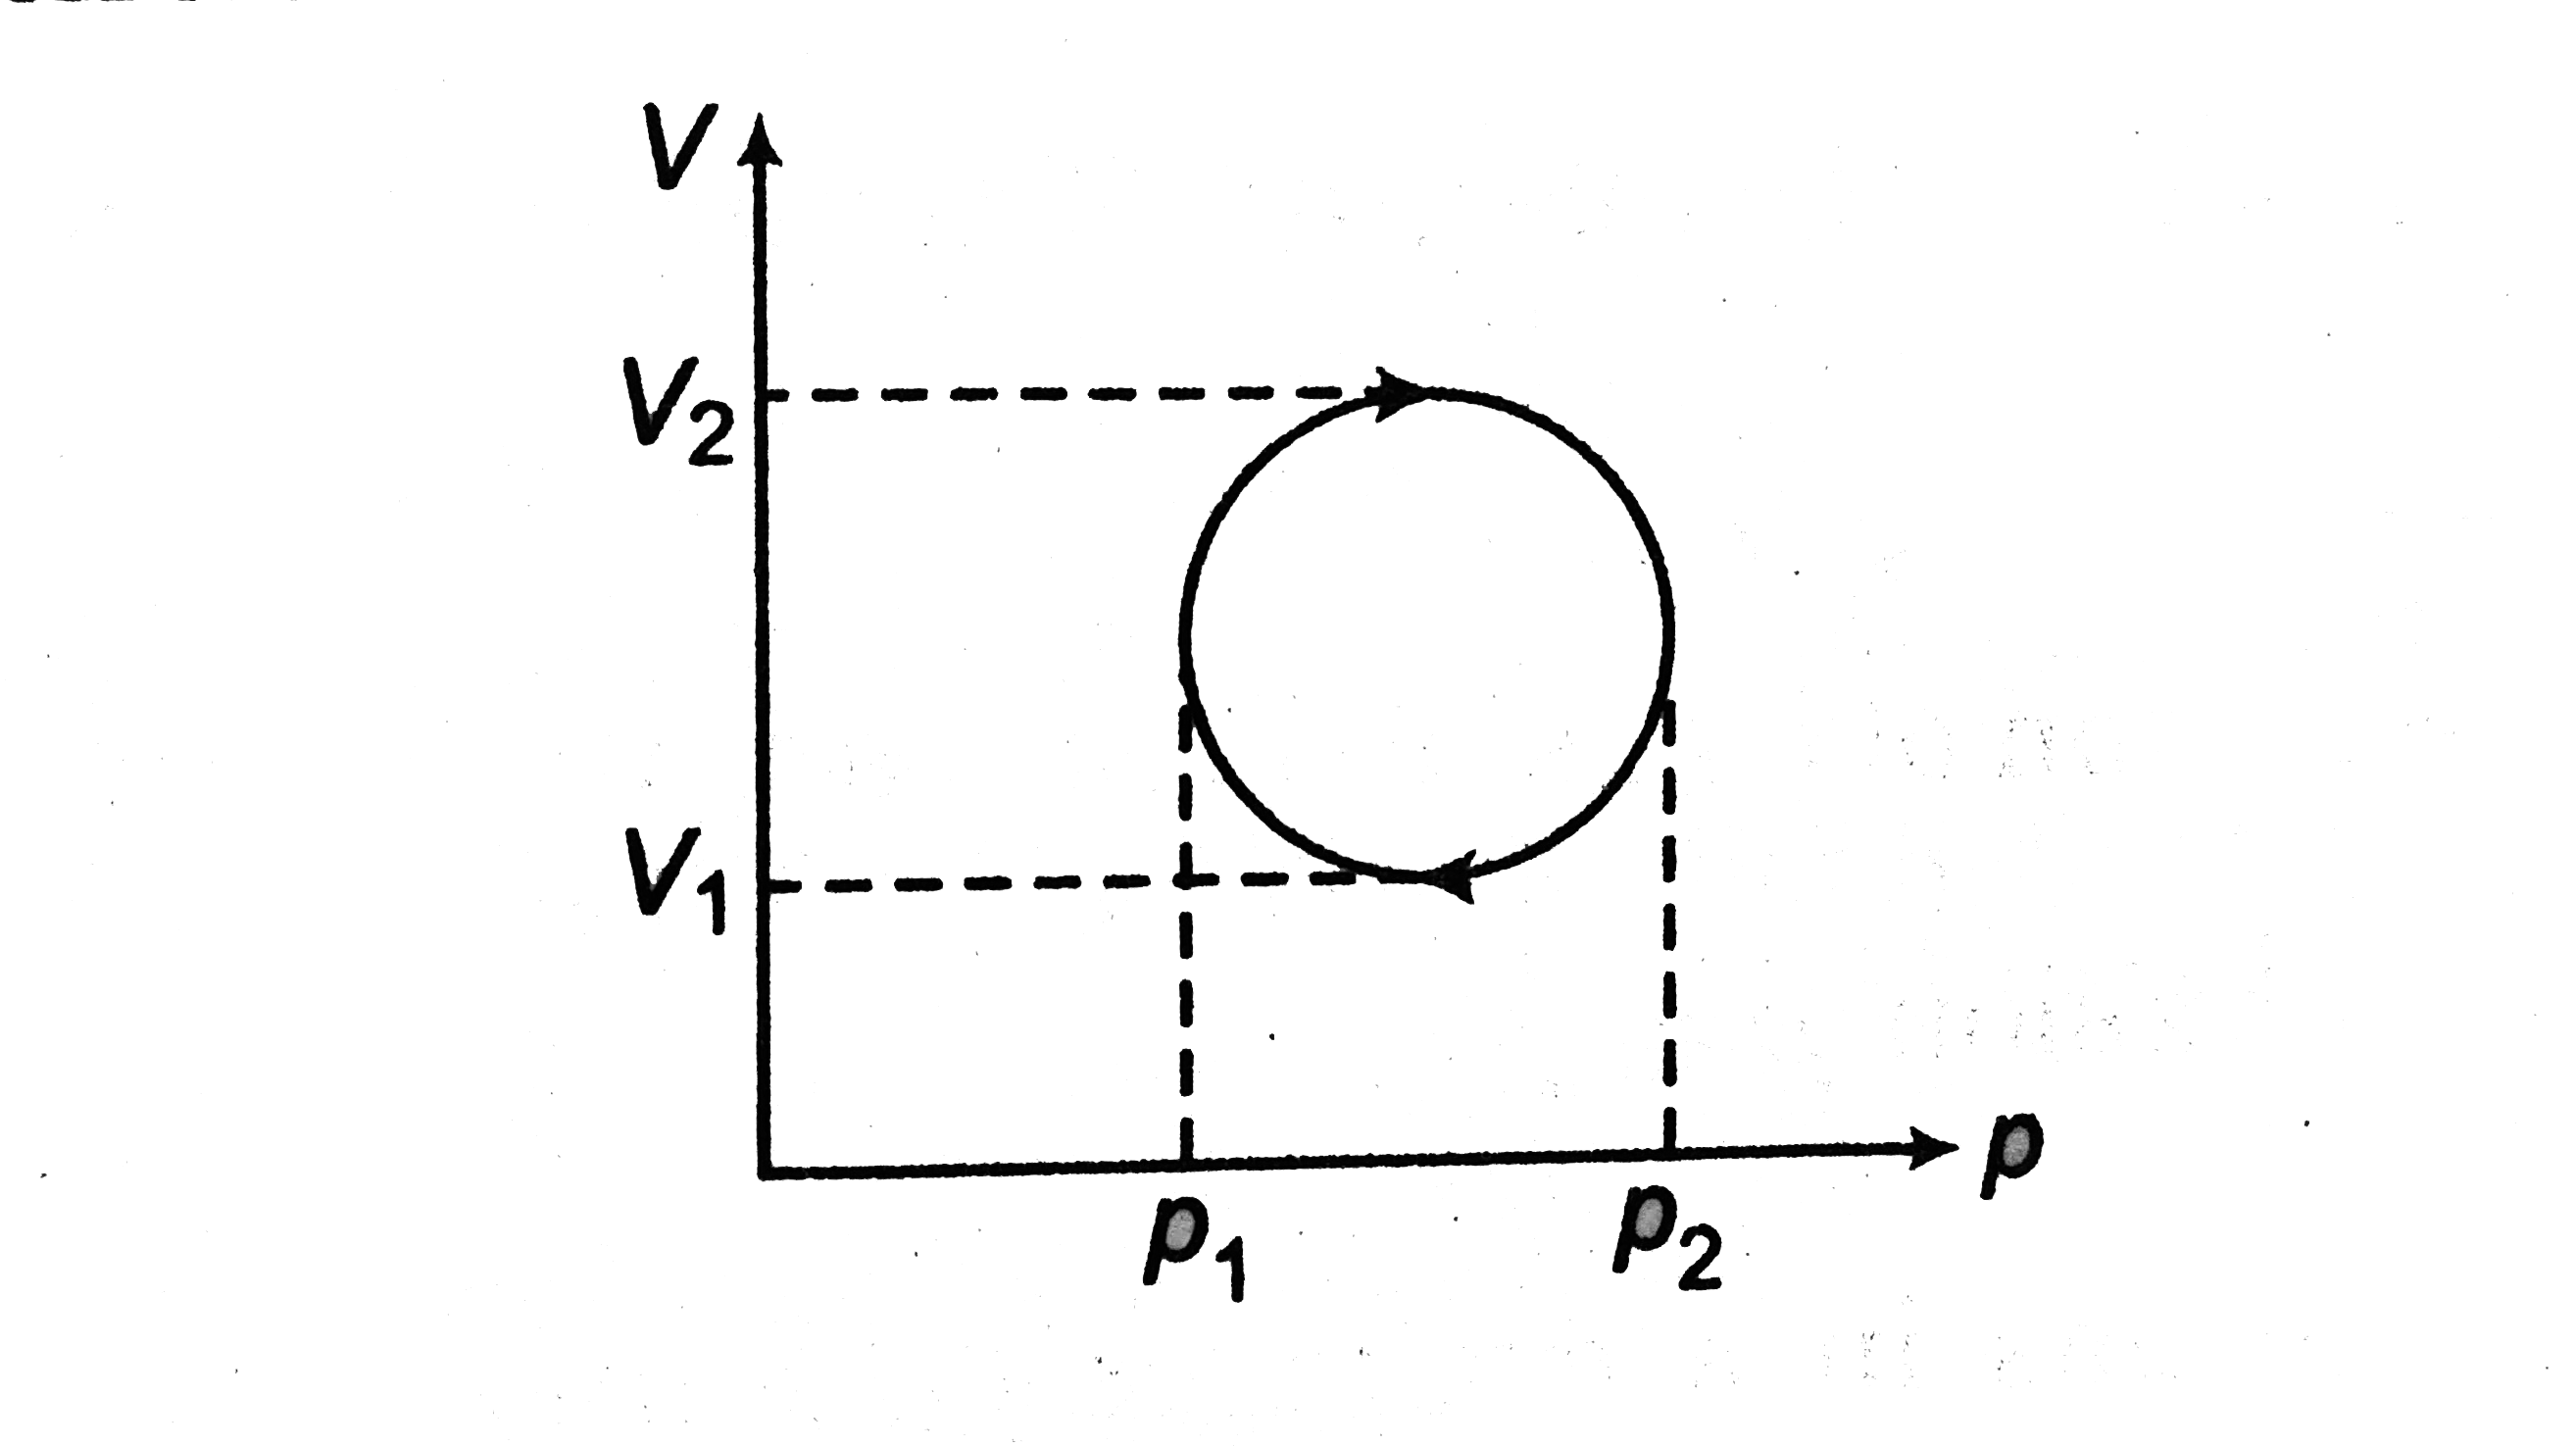
A
(a) π4(p2−p1)2
B
(b) π4(V2−V1)2
C
(c) π2(p2−p1)(V2−V1)
D
(d) π4(p2−p1)(V1−V2)
Video Solution
Text Solution
The correct Answer is:D
W=−π(Radius)2
=−π(Radius)(Radius)
=−π(p2−p12)(V2−V12)
|
Updated on:21/07/2023
Topper's Solved these Questions
- BOOK - DC PANDEYCHAPTER - LAWS OF THERMODYNAMICSEXERCISE - Level 1 Objective Questions1videos
LAWS OF THERMODYNAMICS
- BOOK - DC PANDEYCHAPTER - LAWS OF THERMODYNAMICSEXERCISE - Level 1 Subjective24videos
LAWS OF THERMODYNAMICS
- BOOK - DC PANDEYCHAPTER - LAWS OF THERMODYNAMICSEXERCISE - Level 1 Assertion And Reason10videos
LAWS OF THERMODYNAMICS
- BOOK - DC PANDEYCHAPTER - LAWS OF MOTIONEXERCISE - Medical entrances gallery39videos
LAWS OF MOTION
- BOOK - DC PANDEYCHAPTER - MAGNETIC EFFECT OF CURRENT AND MAGNETISMEXERCISE - Integer type Questions10videos
MAGNETIC EFFECT OF CURRENT AND MAGNETISM
Similar Questions
Knowledge Check
- Question 1 - Select One
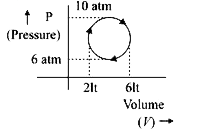
An ideal gas undergoes a cyclic process whose indicator diagram is as shown in the figure. Find the work done by the gas in 1 complete cycle.
 A4π lt-atmB16lt - atmC8π lt - atmD16π lt - atm
 - Question 2 - Select One
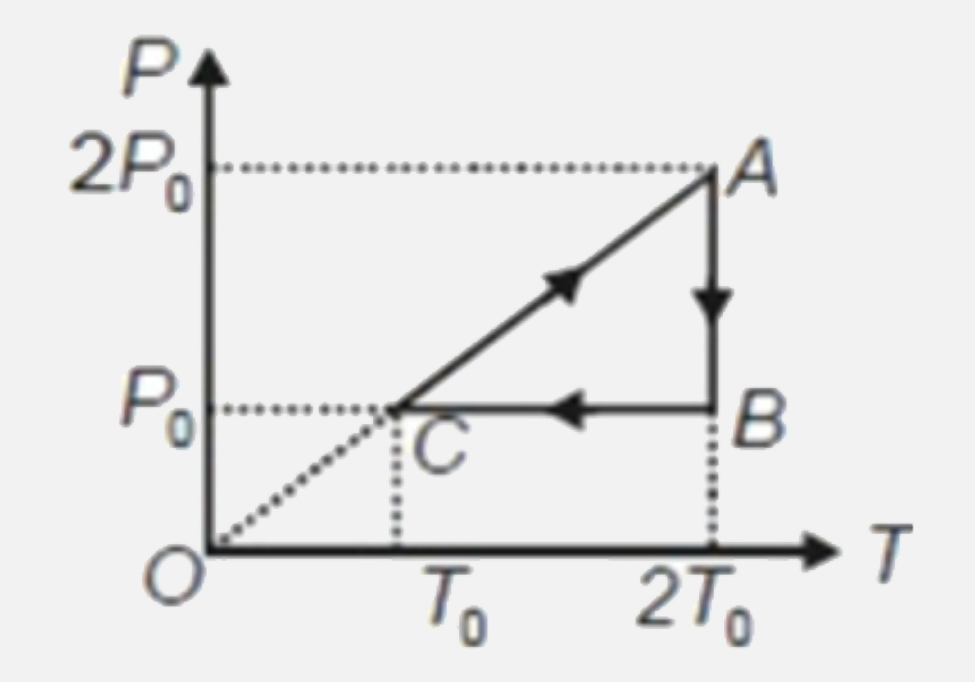
One mole of an ideal diatomic gas is taken through a process whose P−V diagram is shown in the figure. The work done by the gas is
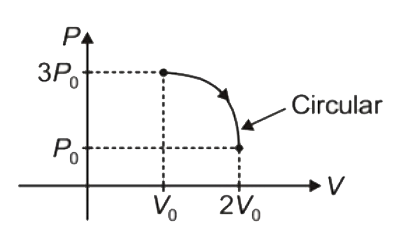 AπP0V0+2P0V0BπP0V02+P0V0C2πP0V0+P0V0DπP0V0√2+P0V0
 - Question 3 - Select One
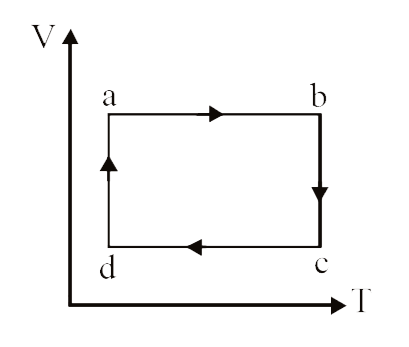
The cyclic process for 1 mole of an ideal gas is shown in the V-T diagram. The work done in AB, BC and CA respectively is
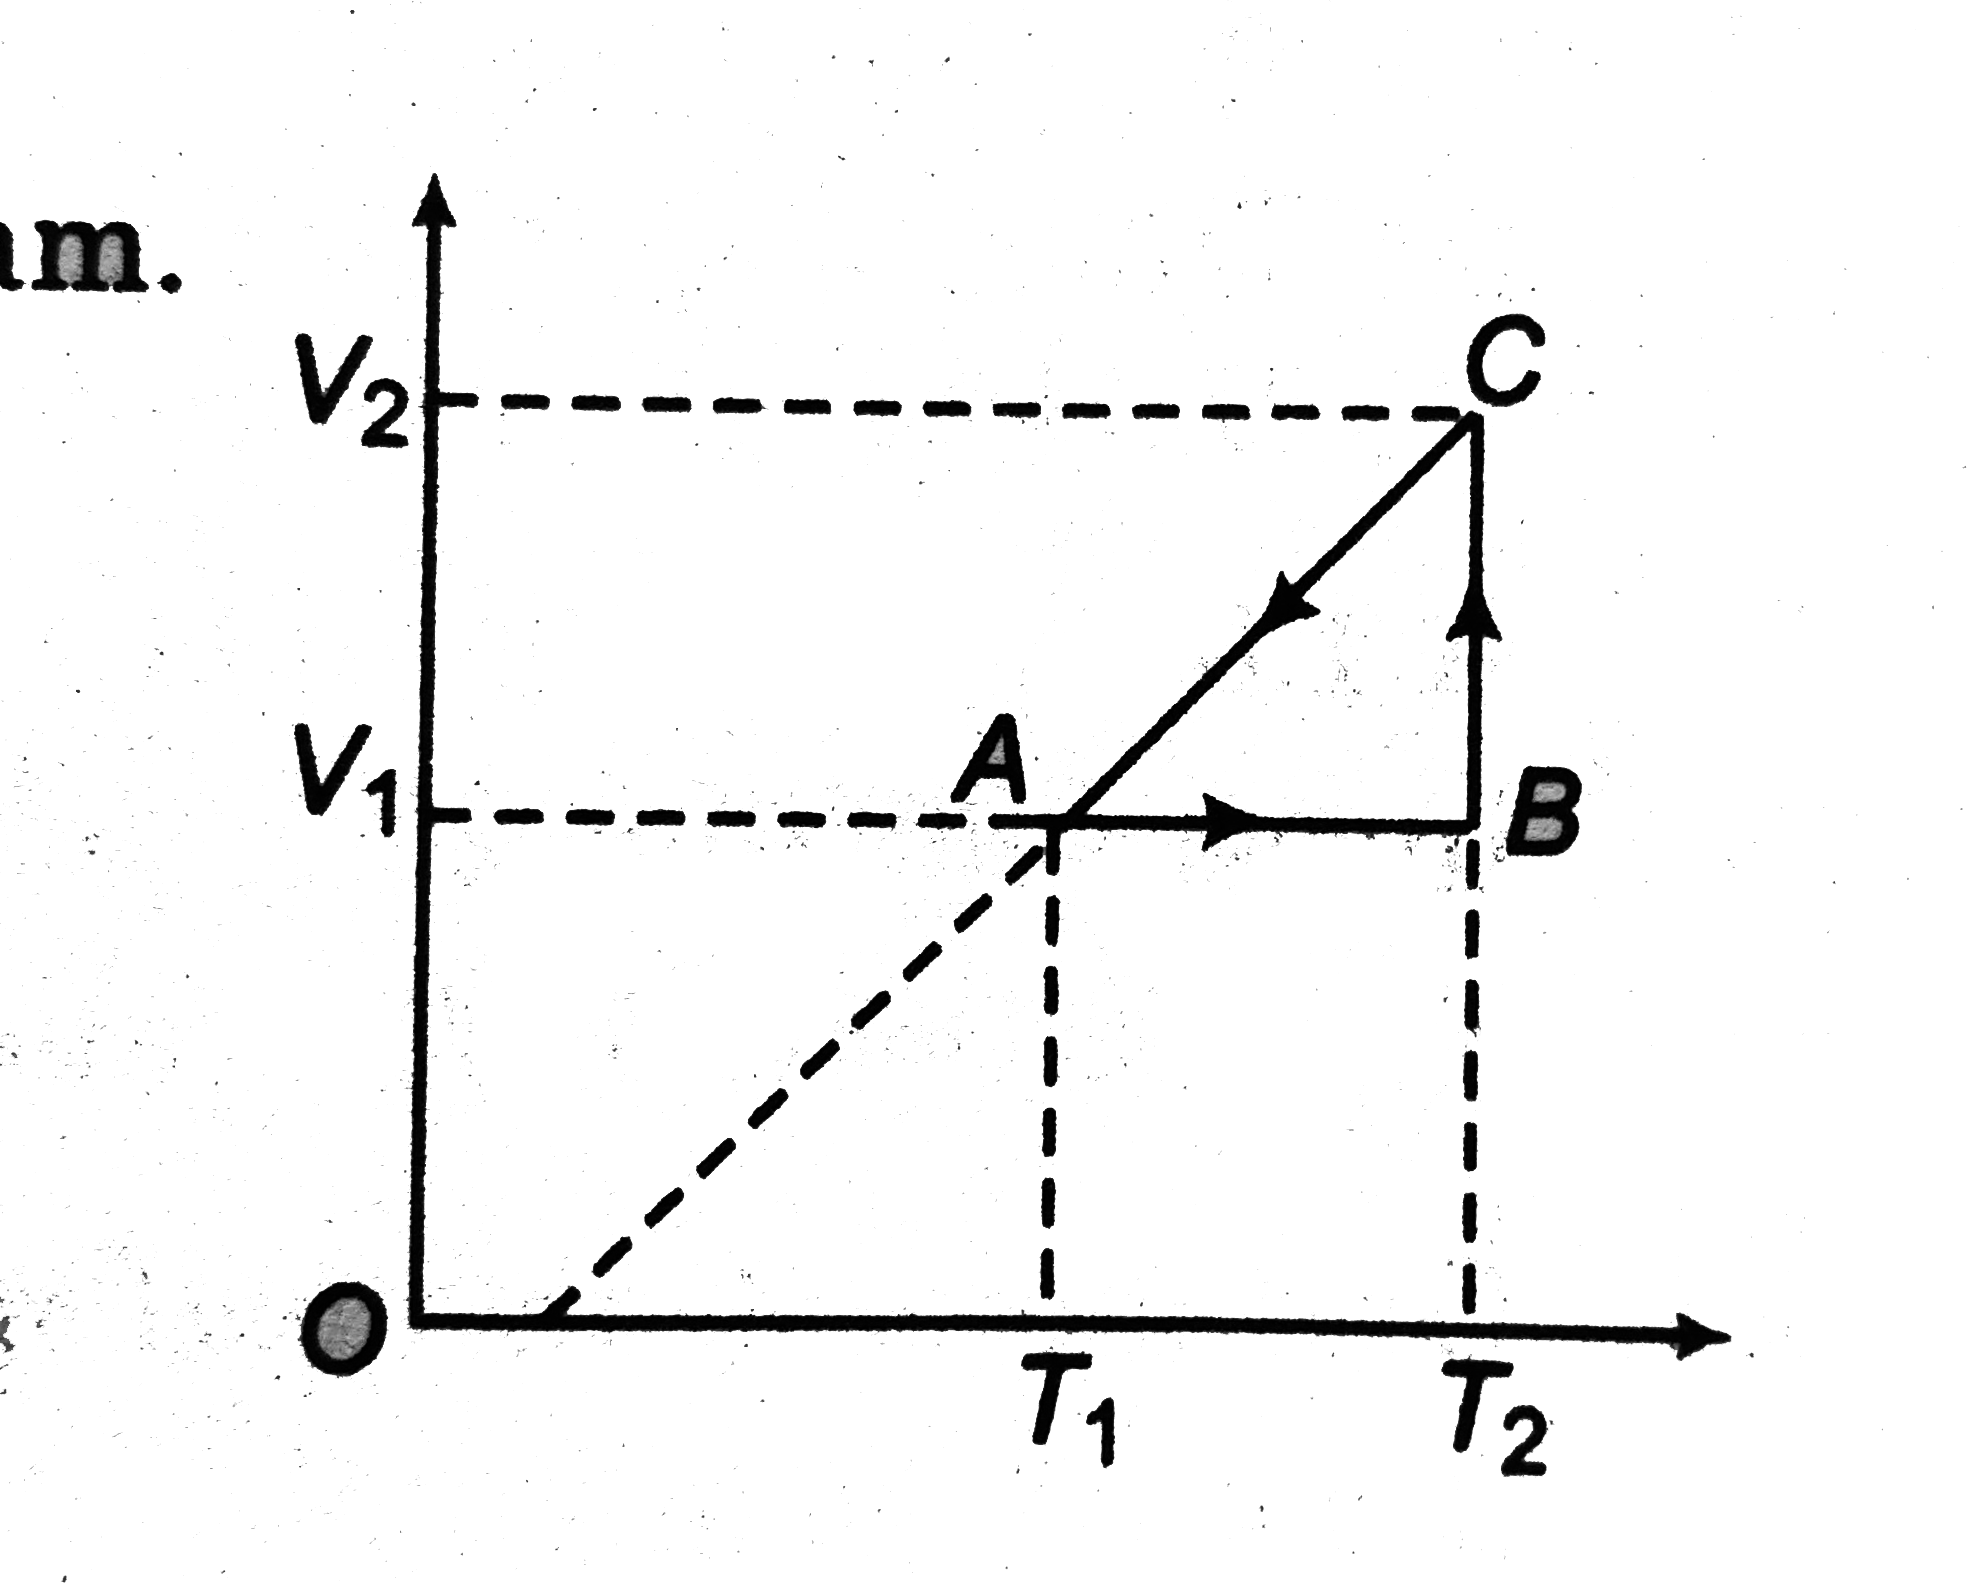 A(a) 0, RT2In∣∣∣V2V1∣∣∣,R(T1−T2)B(b) R(T1−T2),0,RT1In∣∣∣V1V2∣∣∣C(c) 0,RT1In∣∣∣V1V2∣∣∣,R(T1−T2)D(d) 0,RT_(2)In|V_2/V_1|,R(T_2-T_1)
An ideal gas undergoes cyclic process ACBC as shown is given PV diagram
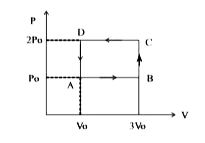
The amount of work done by the gas isView SolutionA cyclic process for 1 mole of an ideal gas is shown in the V-T diagram. The work done in AB, BC and CA respectively are
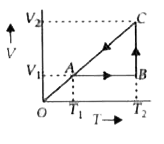 View Solution
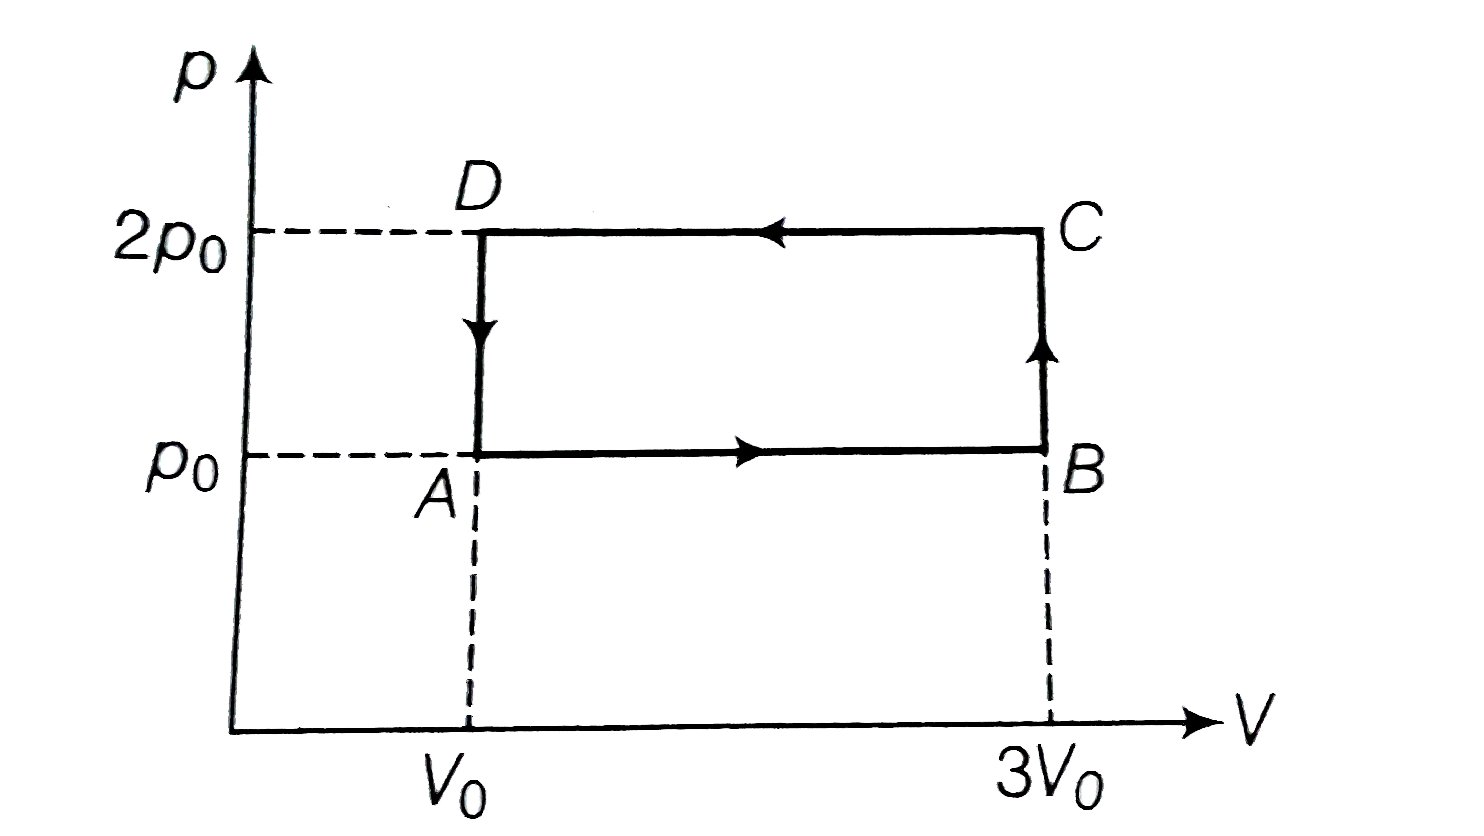
An ideal gas undergoes cyclic process ABCDA as shown in givend p−V diagram. The amount of work done by the gas is
 View Solution
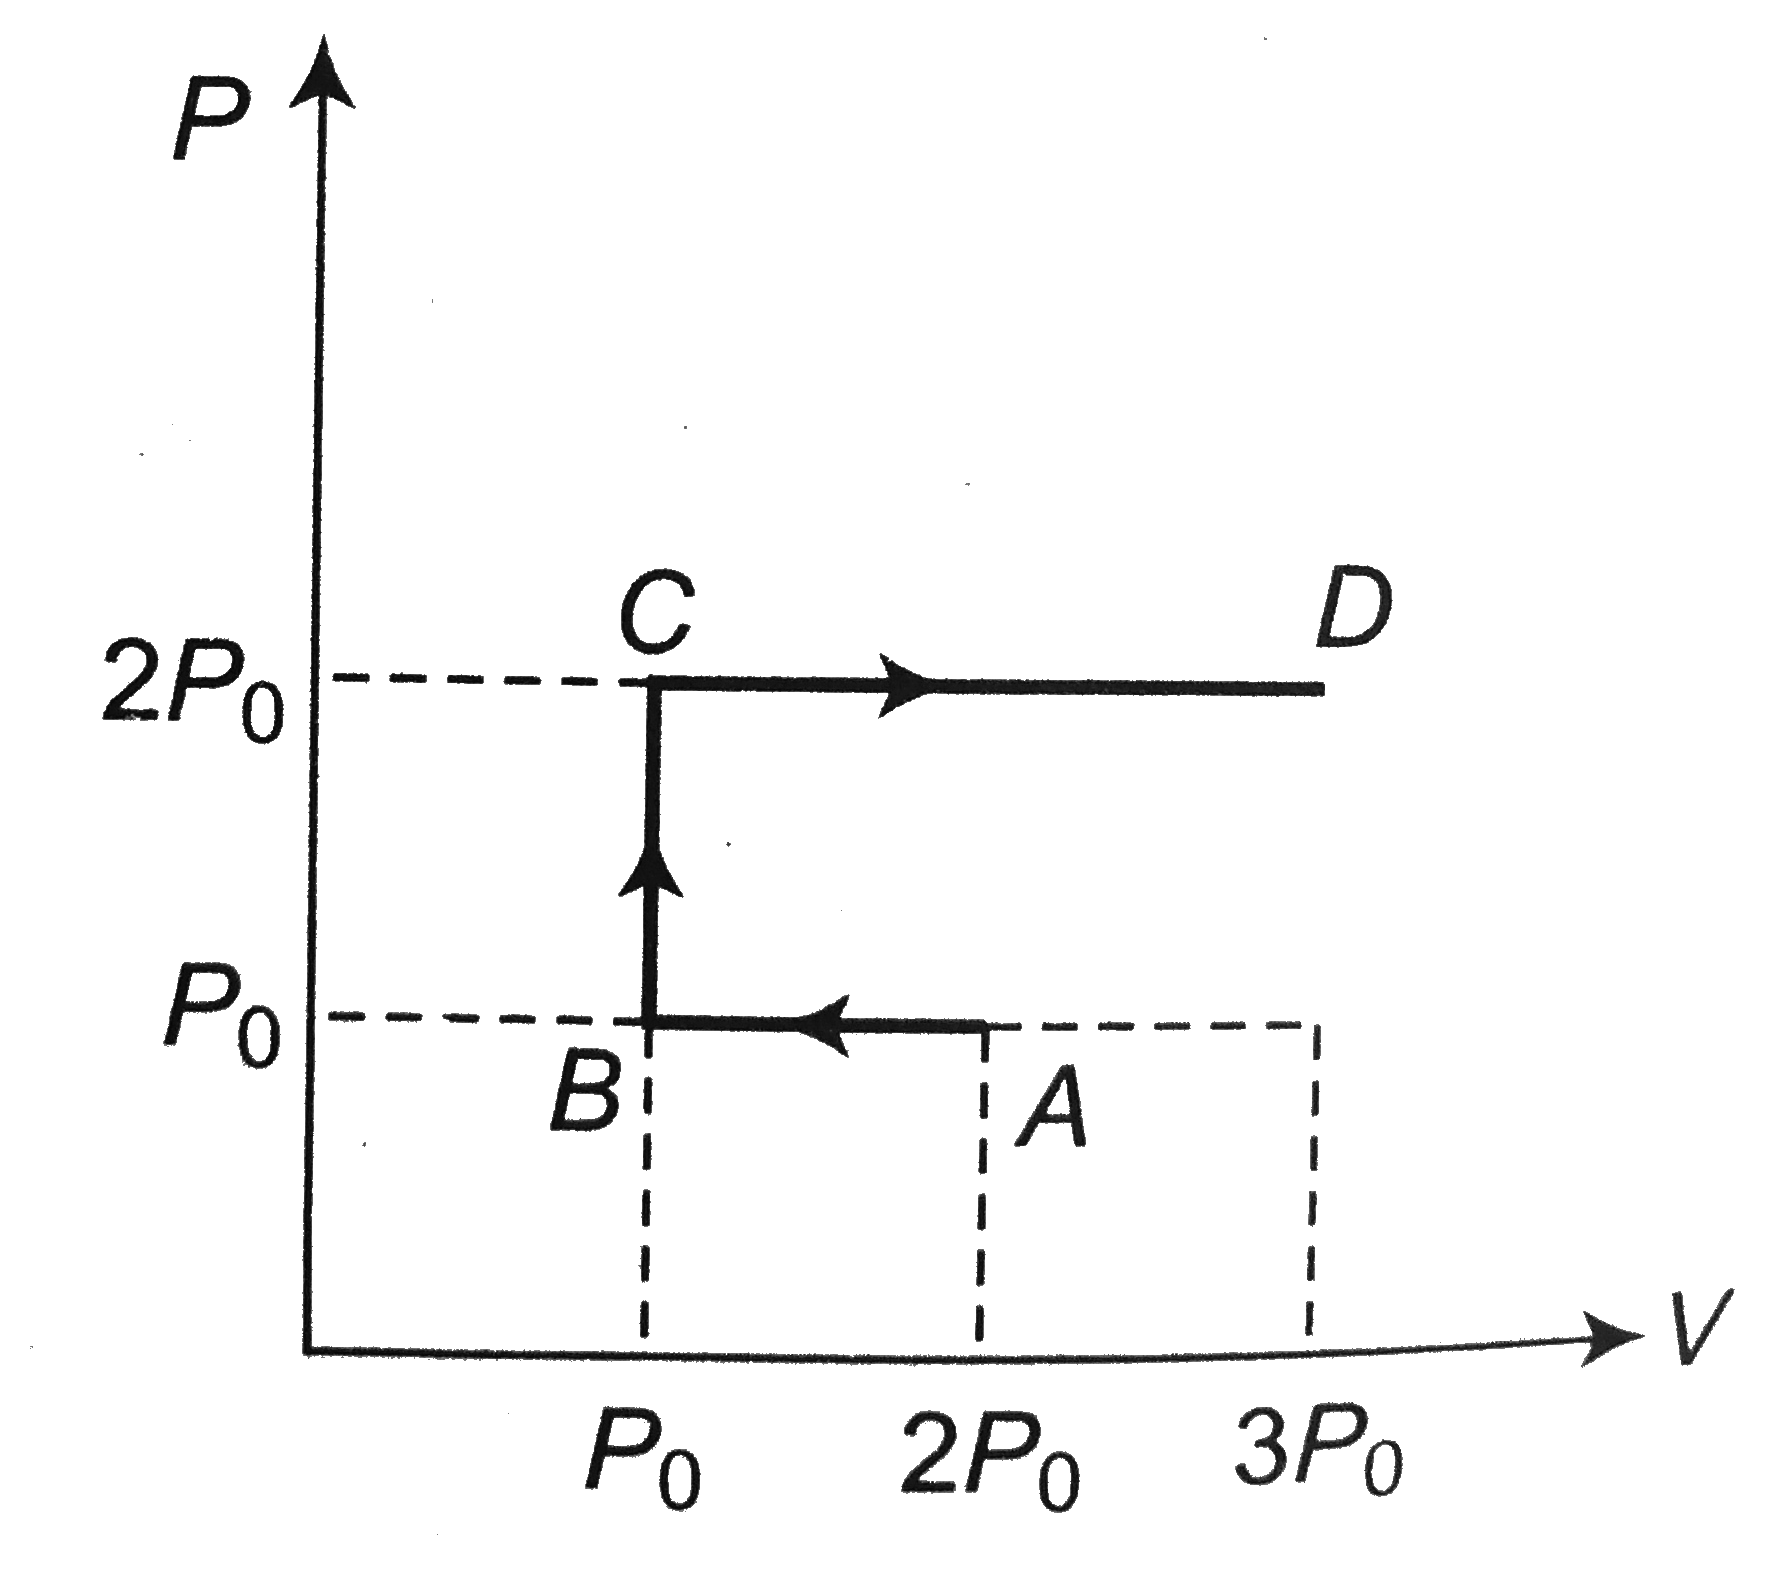
P−V diagram of an ideal gas is as shown in figure. Work done by the gas in process ABCD is
 View Solution
P−V diagram of an ideal gas is as shown in figure. Work done by the gas in process ABCD is
 View Solution


