The slope of the stopping potential versus frequency graph for photoelectric effect is equal to:
h
he
h/e
e
The correct Answer is:C
To solve the question regarding the slope of the stopping potential versus frequency graph in the photoelectric effect, we can follow these steps:
1. Understanding Stopping Potential:
The stopping potential (V₀) is the potential required to stop the photoelectrons emitted from a surface when illuminated by light of frequency (ν). It is related to the kinetic energy of the emitted electrons.
2. Kinetic Energy Relation:
The kinetic energy (KE) of the emitted electrons can be expressed as:
KE=eV₀
where e is the charge of the electron.
3. Energy from Light:
According to the photoelectric effect, the energy of the incoming photons can be expressed as:
E=hν
where h is Planck's constant and ν is the frequency of the incident light.
4. Photoelectric Equation:
The energy conservation principle leads to the equation:
hν=W+eV₀
where W is the work function of the material.
5. Rearranging the Equation:
Rearranging the above equation gives:
eV₀=hν−W
or
V₀=heν−We
6. Identifying the Slope:
The equation V₀=heν−We resembles the linear equation y=mx+c, where:
- y is the stopping potential V₀,
- x is the frequency ν,
- m (the slope) is he,
- c (the y-intercept) is −We.
7. Conclusion:
Therefore, the slope of the stopping potential versus frequency graph is:
Slope=he
Final Answer:
The slope of the stopping potential versus frequency graph for the photoelectric effect is equal to he.
---
The stopping potential (V₀) is the potential required to stop the photoelectrons emitted from a surface when illuminated by light of frequency (ν). It is related to the kinetic energy of the emitted electrons.
The kinetic energy (KE) of the emitted electrons can be expressed as:
KE=eV₀
where e is the charge of the electron.
According to the photoelectric effect, the energy of the incoming photons can be expressed as:
E=hν
where h is Planck's constant and ν is the frequency of the incident light.
The energy conservation principle leads to the equation:
hν=W+eV₀
where W is the work function of the material.
Rearranging the above equation gives:
eV₀=hν−W
or
V₀=heν−We
The equation V₀=heν−We resembles the linear equation y=mx+c, where:
- y is the stopping potential V₀,
- x is the frequency ν,
- m (the slope) is he,
- c (the y-intercept) is −We.
Therefore, the slope of the stopping potential versus frequency graph is:
Slope=he
The slope of the stopping potential versus frequency graph for the photoelectric effect is equal to he.
Topper's Solved these Questions
- PHOTOELECTRIC EFFECT AND MATTER WAVESBOOK - PHYSICS GALAXY - ASHISH ARORACHAPTER - PHOTOELECTRIC EFFECT AND MATTER WAVESEXERCISE - Numerical MCQs
60 Videos
- PHOTOELECTRIC EFFECT AND MATTER WAVESBOOK - PHYSICS GALAXY - ASHISH ARORACHAPTER - PHOTOELECTRIC EFFECT AND MATTER WAVESEXERCISE - Advance MCQ
28 Videos
- PHOTOELECTRIC EFFECT AND MATTER WAVESBOOK - PHYSICS GALAXY - ASHISH ARORACHAPTER - PHOTOELECTRIC EFFECT AND MATTER WAVESEXERCISE - Discussion question
50 Videos
- NUCLEAR PHYSICS AND RADIOACTIVITYBOOK - PHYSICS GALAXY - ASHISH ARORACHAPTER - NUCLEAR PHYSICS AND RADIOACTIVITYEXERCISE - Concptual MCQs
48 Videos
- THERMODYNAMICS LAWS & SPECIFIC HEATS OF GASES BOOK - PHYSICS GALAXY - ASHISH ARORACHAPTER - THERMODYNAMICS LAWS & SPECIFIC HEATS OF GASES EXERCISE - Practice Exercise 3.4
11 Videos
Similar Questions
Knowledge Check
Which is correct graph for photoelectric effect.
A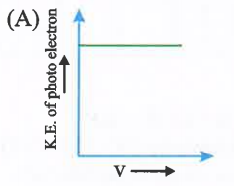 B
B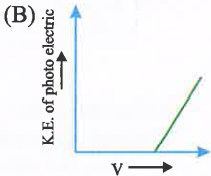 C
C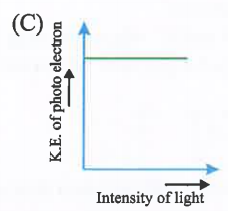 D
D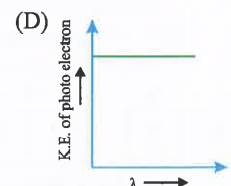
The graph between stopping potential and intensity of light in photoelectric effect is
A B
B C
C D
D
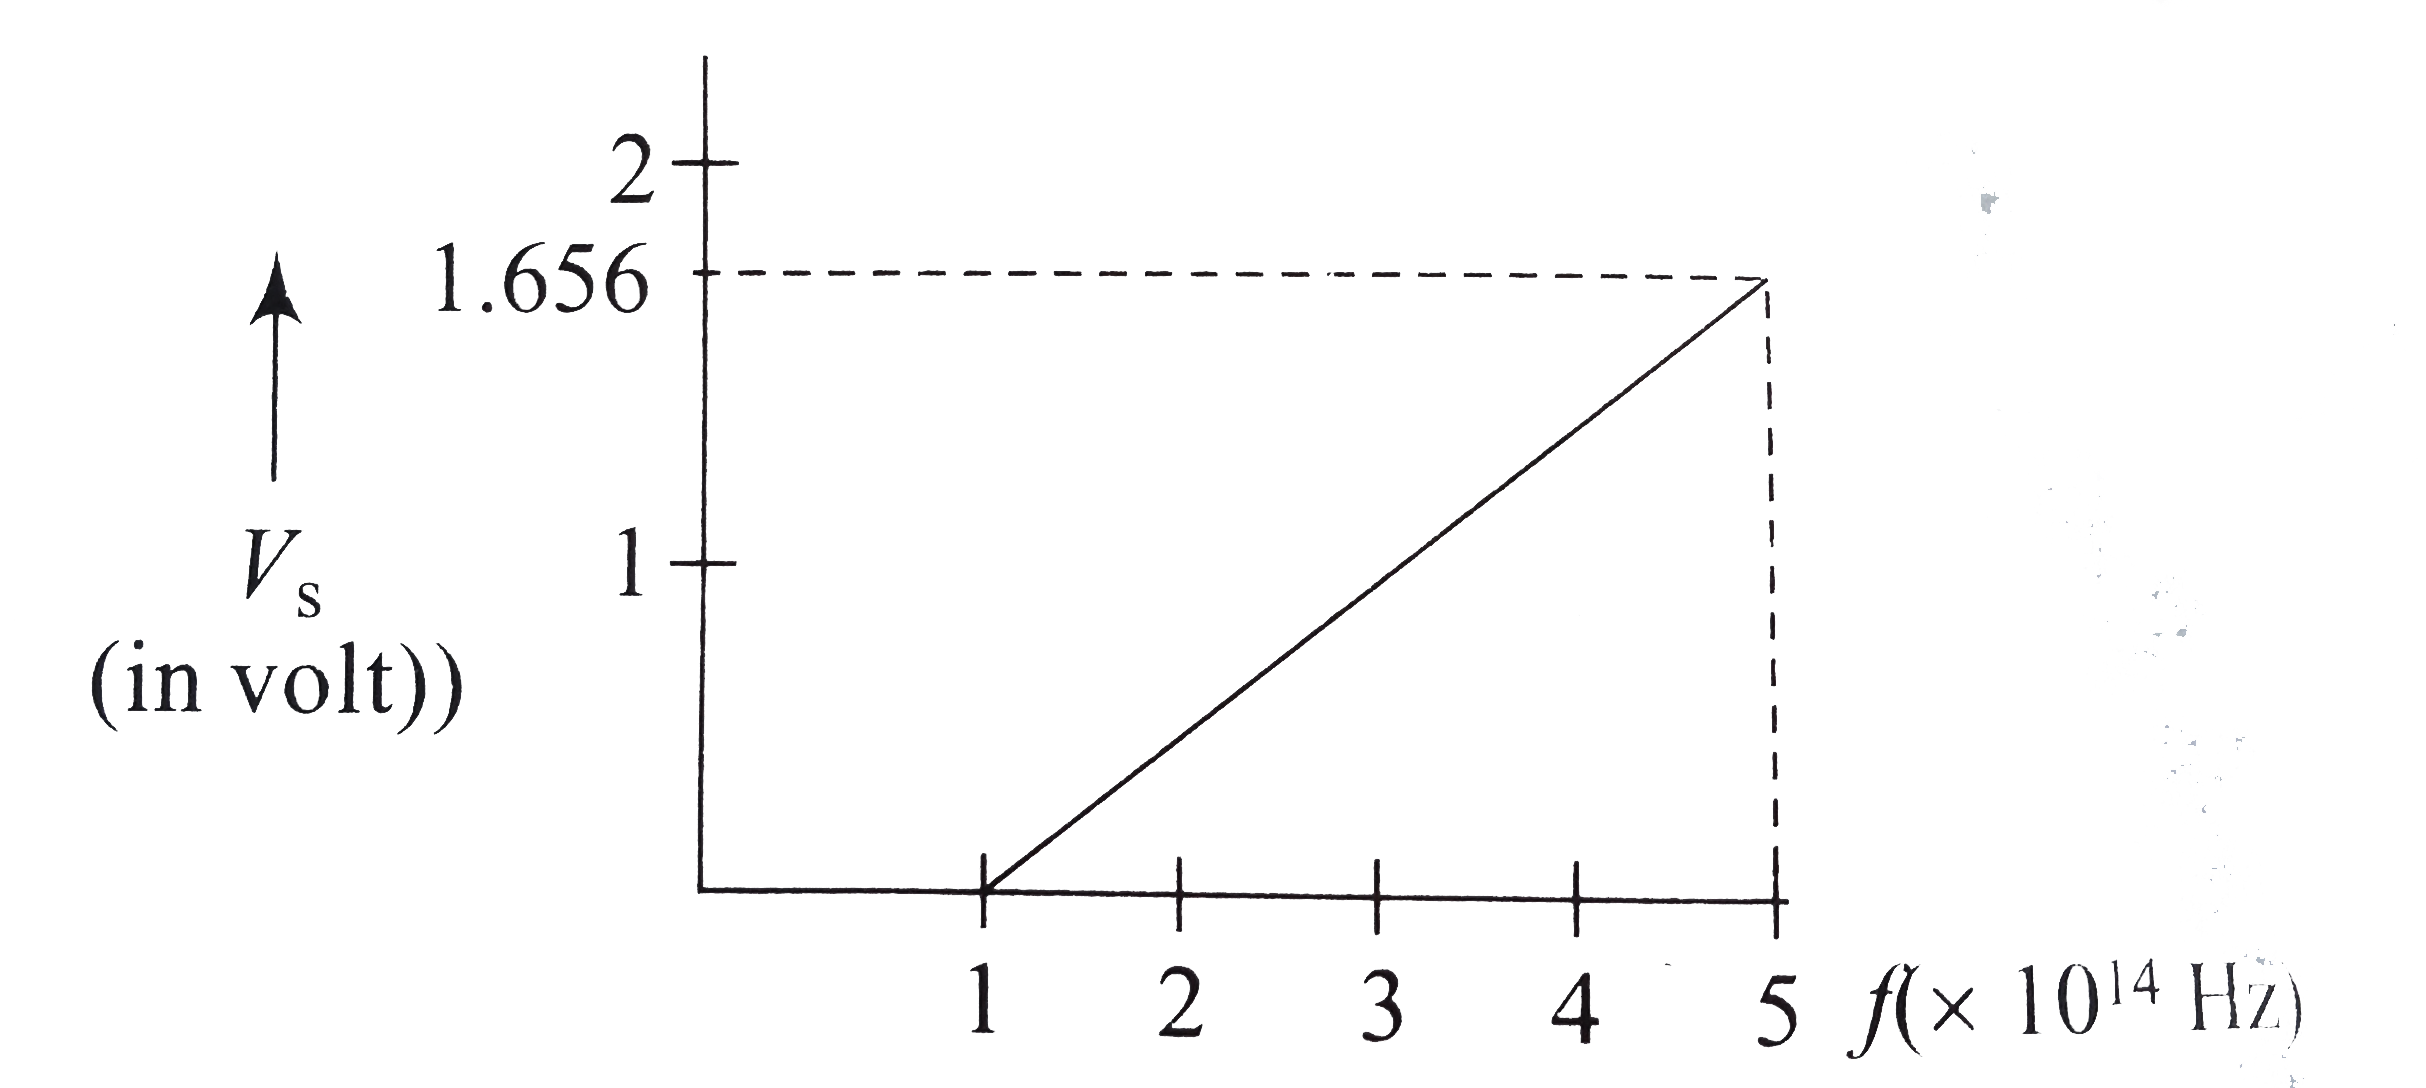
Figure shows the plot of the stopping potential versus the frequency of the light used in an experiment on photoelectric effect. The ratio he isA10−15Vs−15VsB2×10−15VsC3×10−15VsD4.14×10−15Vs
Define the term 'stopping potential' in relation to photoelectric effect.
View SolutionThe work function of Silver and Sodium are 5eV and 2.5eV,respectively.The ratio of slope of the stopping potential versus frequency plot for Silver to that of Sodium is
View SolutionFigure is the plot of the stopping potential versus the frequency of the light used in an experiment on photoelectric effect. Find (a) the ratio h/e and (b) the work function.
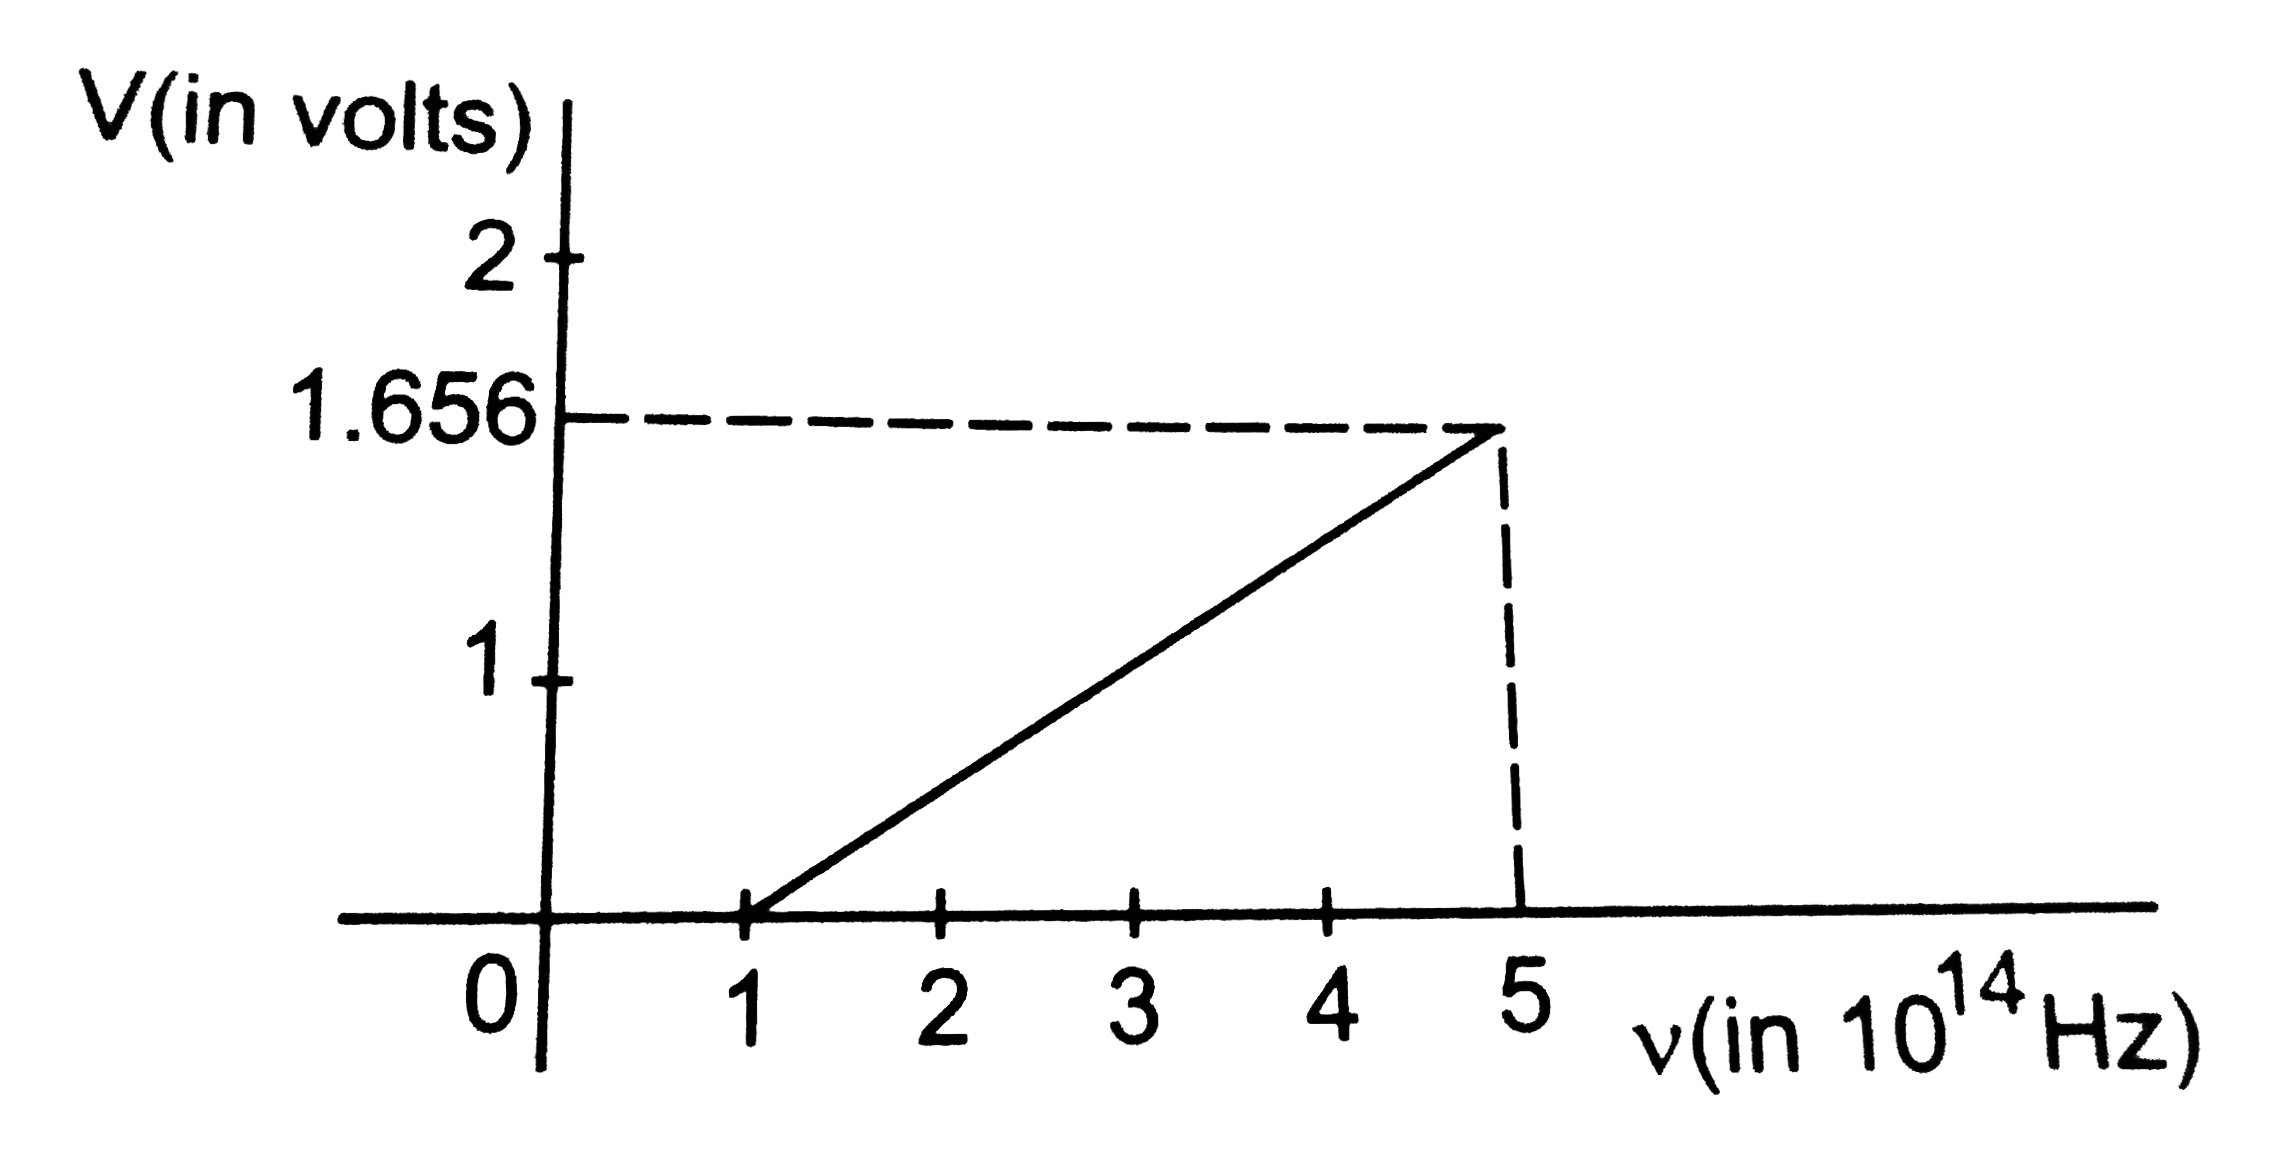
View SolutionThe magnitude of stopping potential for the photoelectric effect is
View SolutionIn photoelectric effect the slope of stop of stopping potential versus frequency of incident light for a given surface will be
View Solution
