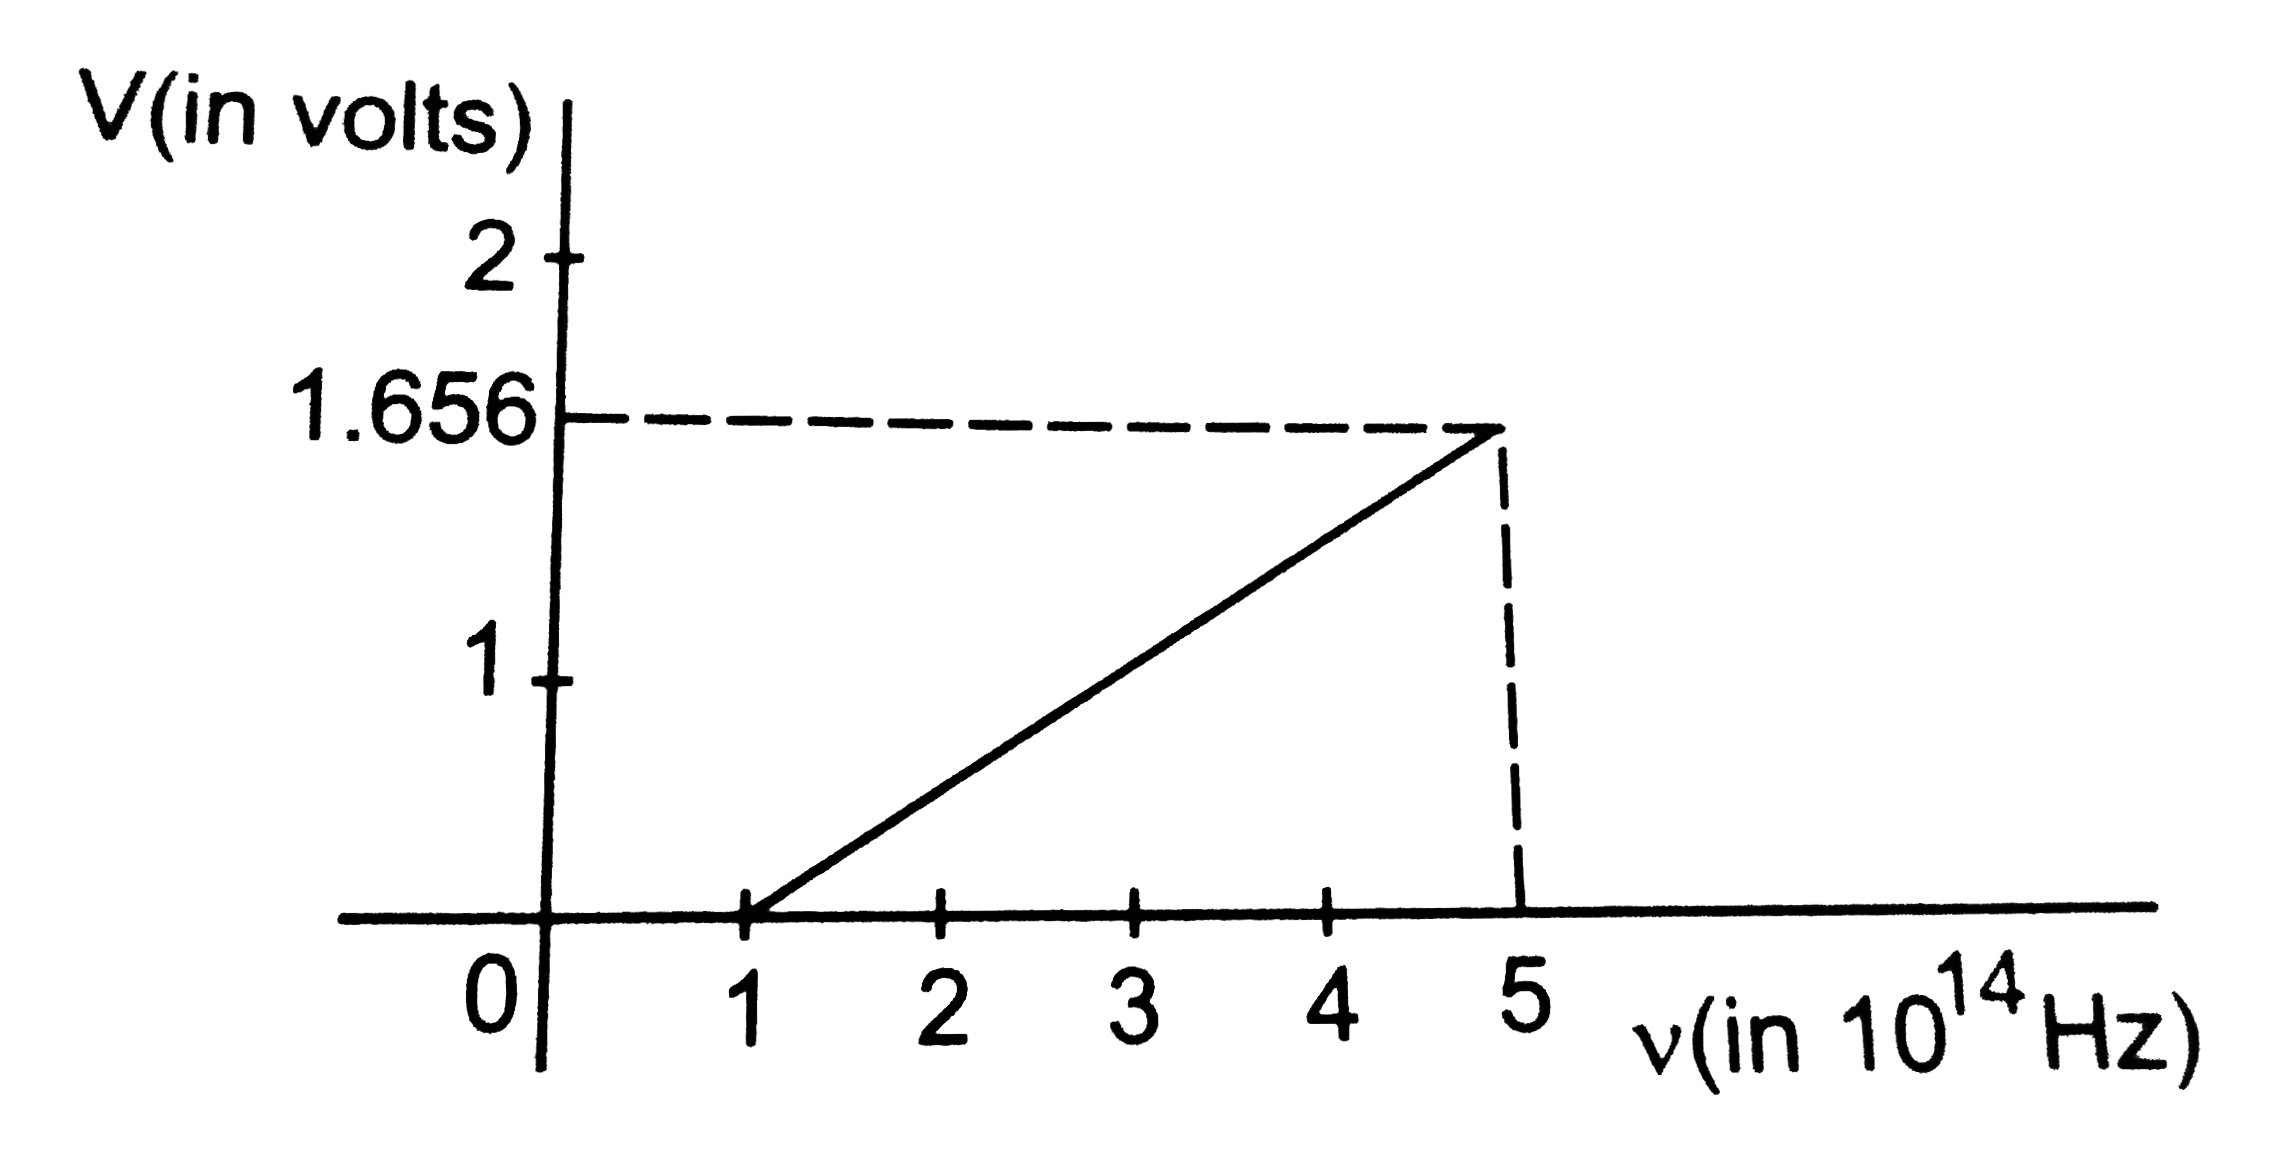
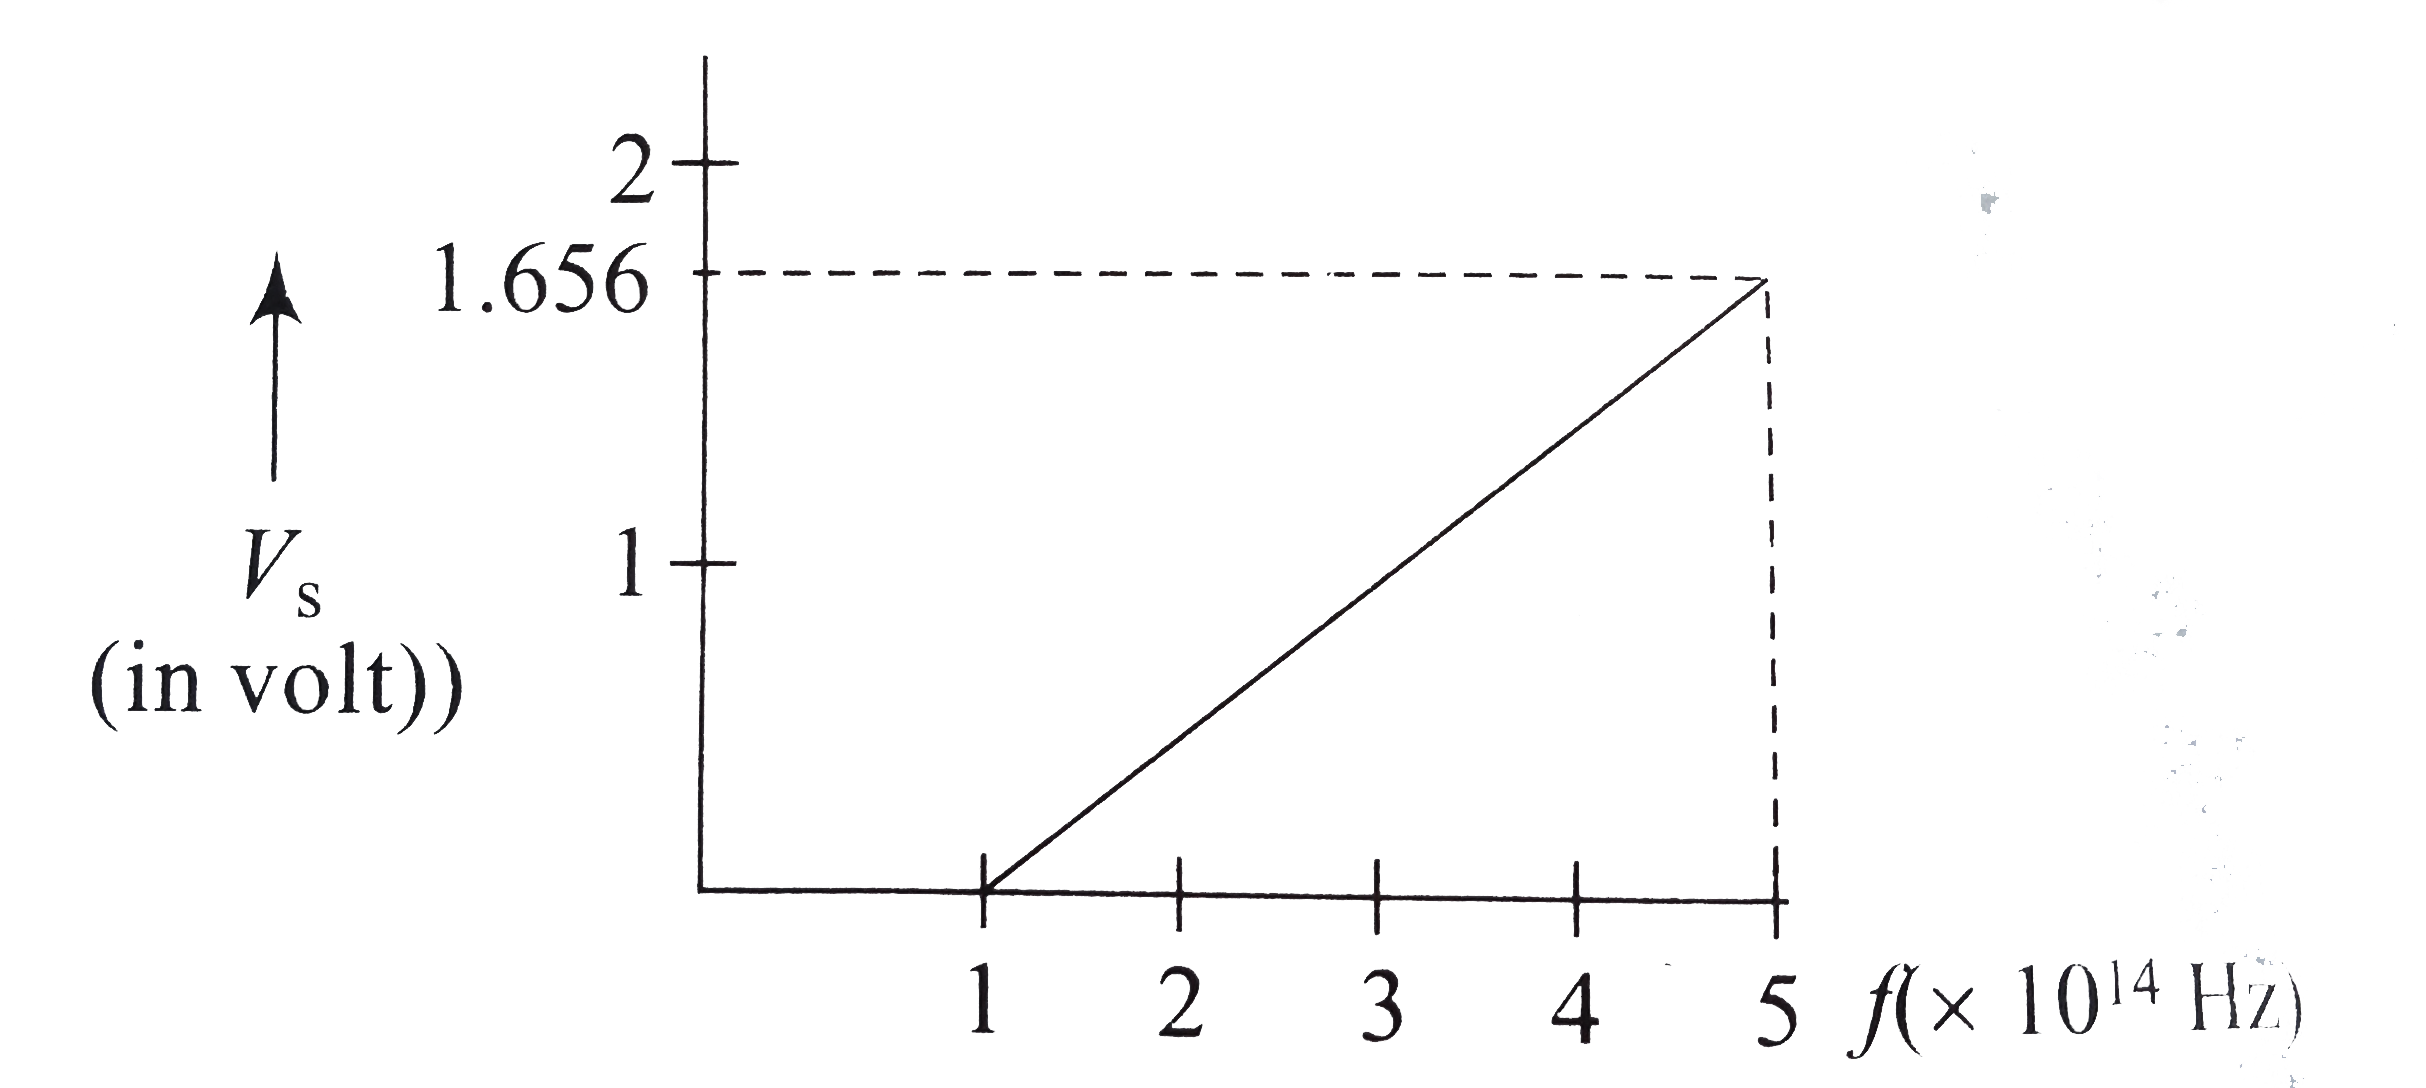
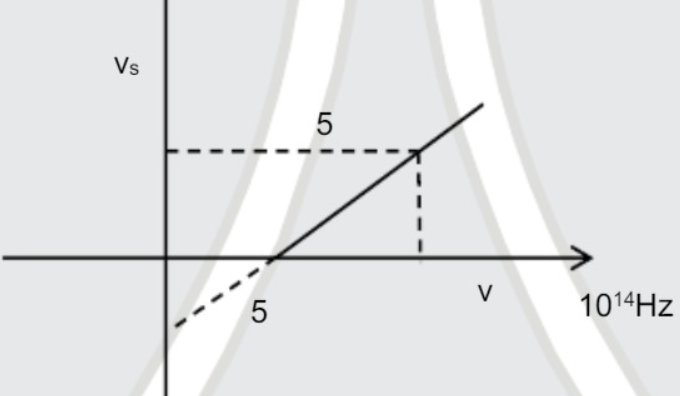
Figure is the plot of the stopping potential versus the frequency of the light used in an experiment on photoelectric effect. Find (a) the ratio h/e and (b) the work function.

We have to take two cases
Case - I v0=1.656 v=5×10¹⁴Hz
Case -II v0=0
v=1×10¹⁴Hz
(b) We know ev0=hv−W0
1.656e=h×5×10¹⁴−W0
0=5h×1014−5W0
1.6556e=4W0
⇒W0=1.6564eV
=0.414eV
(a) Putting the value of W_0 in equation (2)
⇒5W0=5h×1014
⇒5×0.414=5×h×1014
⇒h=4.414×10⁻¹⁵eV−s
Topper's Solved these Questions
- PHOTO ELECTRIC EFFECT AND WAVE PARTICLE DUALITYBOOK - HC VERMACHAPTER - PHOTO ELECTRIC EFFECT AND WAVE PARTICLE DUALITYEXERCISE - Exercises
33 Videos
- PERMANENT MAGNETSBOOK - HC VERMACHAPTER - PERMANENT MAGNETSEXERCISE - Exercises
25 Videos
- PHOTOMETRYBOOK - HC VERMACHAPTER - PHOTOMETRYEXERCISE - Exercises
16 Videos
Similar Questions
Knowledge Check

Figure shows the plot of the stopping potential versus the frequency of the light used in an experiment on photoelectric effect. The ratio he isA10−15Vs−15VsB2×10−15VsC3×10−15VsD4.14×10−15VsA non-monochromatic light is used in an experiment on photoelectric effect. The stopping potential
Ais related to the mean wavelengthBis related to the longest wavelengthCis related to the shortest wavelengthDis not related to the wavelengthGraph between stopping potential and frequency of light as shown find the work function
 A4.01 evB2.07 evC5.01 evD2.09 ev
The electric field associated with a light wave is given by E=E0sin[(1.57×10⁷m−1(x−ct)]. Find the stopping potential when this light is used in an experiment on photoelectric effect with a metal having work - function 1.9 eV.
View SolutionThe electric field associated with a light wave is given by E=E0sin[(1.57x10⁷m−1(x−ct)]. Find the stopping potential when this light is used in an experiment on photoelectric affect with a metal having work - function 1.9 eV.
View SolutionThe electric field associated with a light wave is given by E=E0sin[(1.57x10⁷m−1(x−ct)]. Find the stopping potential when this light is used in an experiment on photoelectric affect with a metal having work - function 1.9 eV.
View SolutionGraph between stopping potential and frequency of light as shown find the work function

View SolutionThe stopping potential as a function of the frequency of the incident radiation is plotted for two different photoelectric surfaces A and B . The graphs show that work function of A is

View Solution
