For the graph shown in figure -4.17, which of the following statement is/are possible?
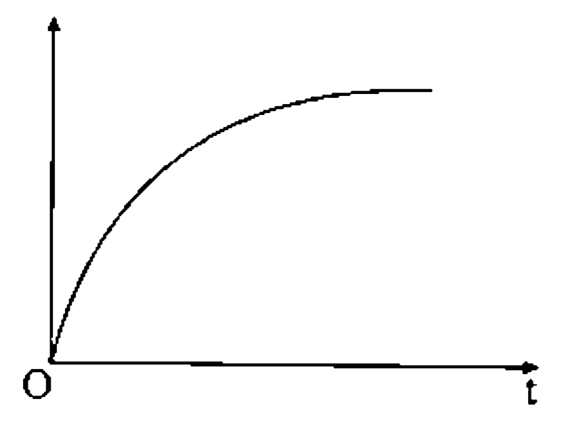
y-axis shows number of nuclei of a radioactive element which is produced at a constant rate
y-axis represents number of nuclei decayed in a radio nuclide
y-axis represents activity of a radio nuclide
none of these
The correct Answer is:A, B
Step by step video, text & image solution for For the graph shown in figure -4.17, which of the following statement is/are possible? by Physics experts to help you in doubts & scoring excellent marks in Class 12 exams.
Similar Questions
Knowledge Check
- Question 1 - Select One
For the circuit shown in figure, which of the following statements is true ?
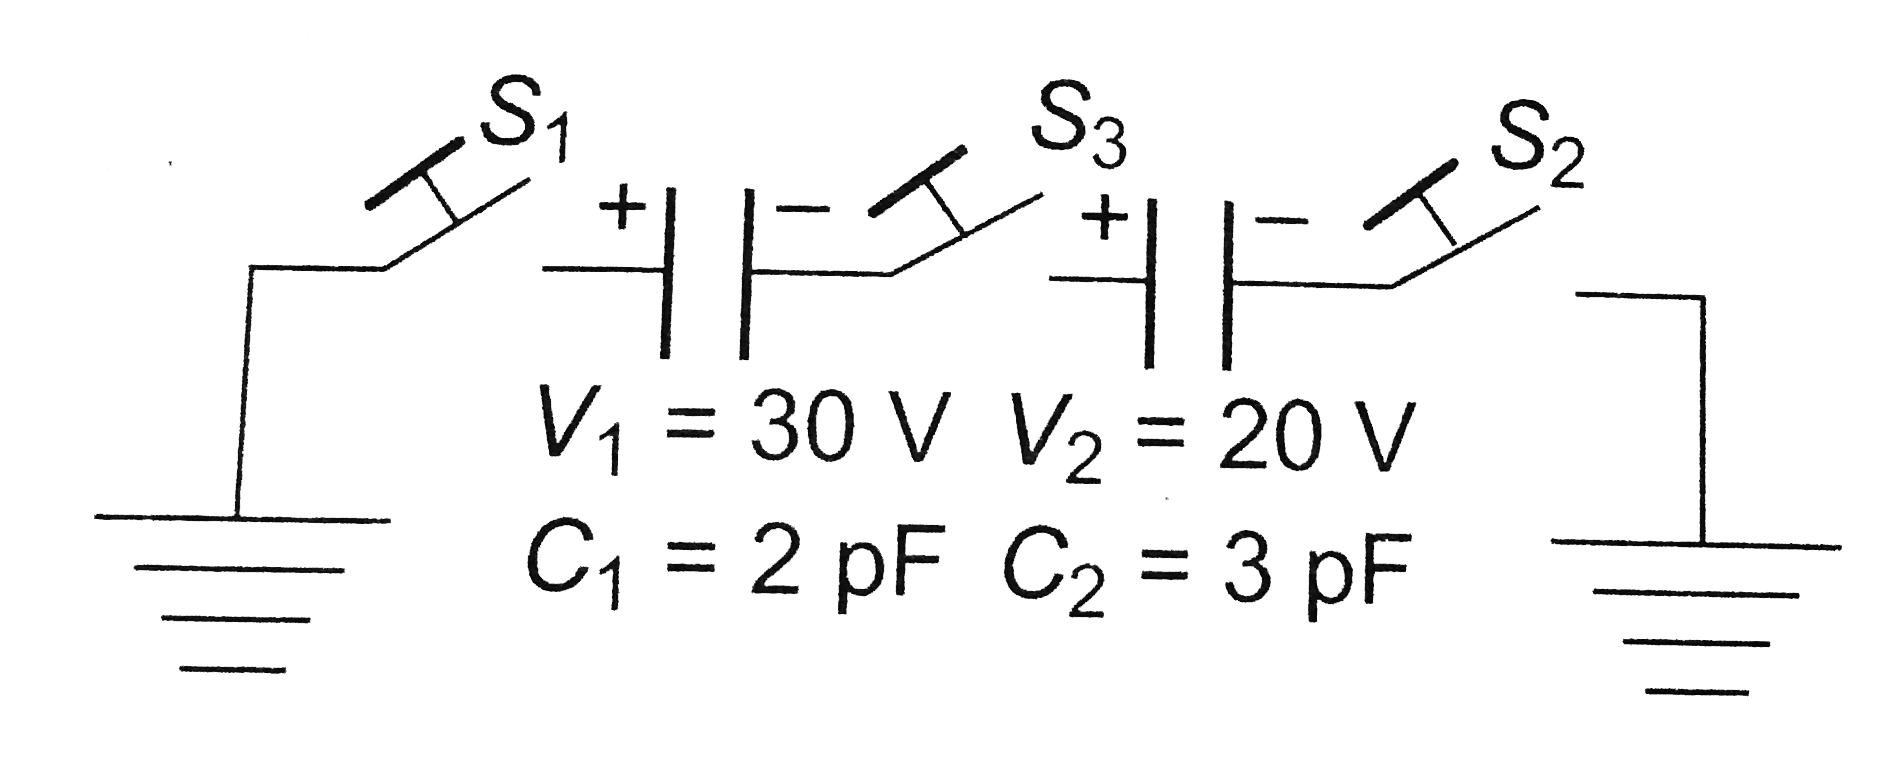 AWith S1 closed, V1=15V,V2=20VBWith S3 closed, V1=V2=25VCWith S1 and S2 closed V1=V2=0DWith S1 and S3 closed V1=30V and V2=20V
 - Question 2 - Select One or More
For the given circuit shown in figure which of the following statements is/are correct
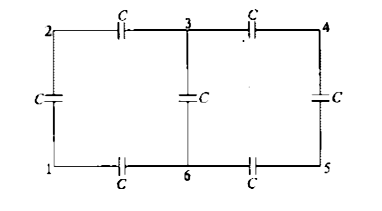 AThe equivalent capacitance between.points 1 and 2 is 15C11BThe equivalent capacitance between poiots 3 and 6 is 5C3CThe equivalent capacitance between points 1 and 3 is 15C14DThe equivalent capacitance between points 3 and 5 is 14C15
 - Question 3 - Select One
Which of the following distance time graphs is possible ?
A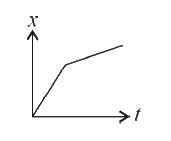 B
B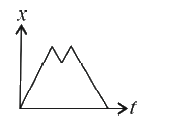 C
C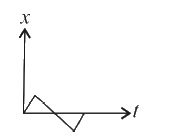 D
D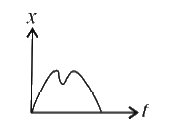
Consider the circuit shown in the figure.
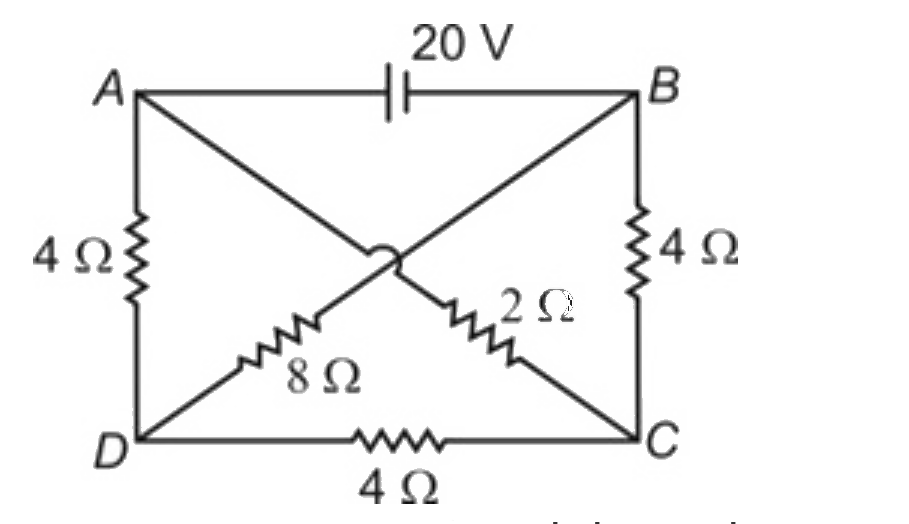
Which of the following statements are correct ?View SolutionA ray of light is incident in situation as shown in figure.
_S01_055_Q01.png)
Which of the following statements is/are true?View SolutionA lump of ice floats in water as shown in the figure .
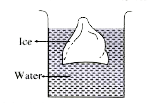
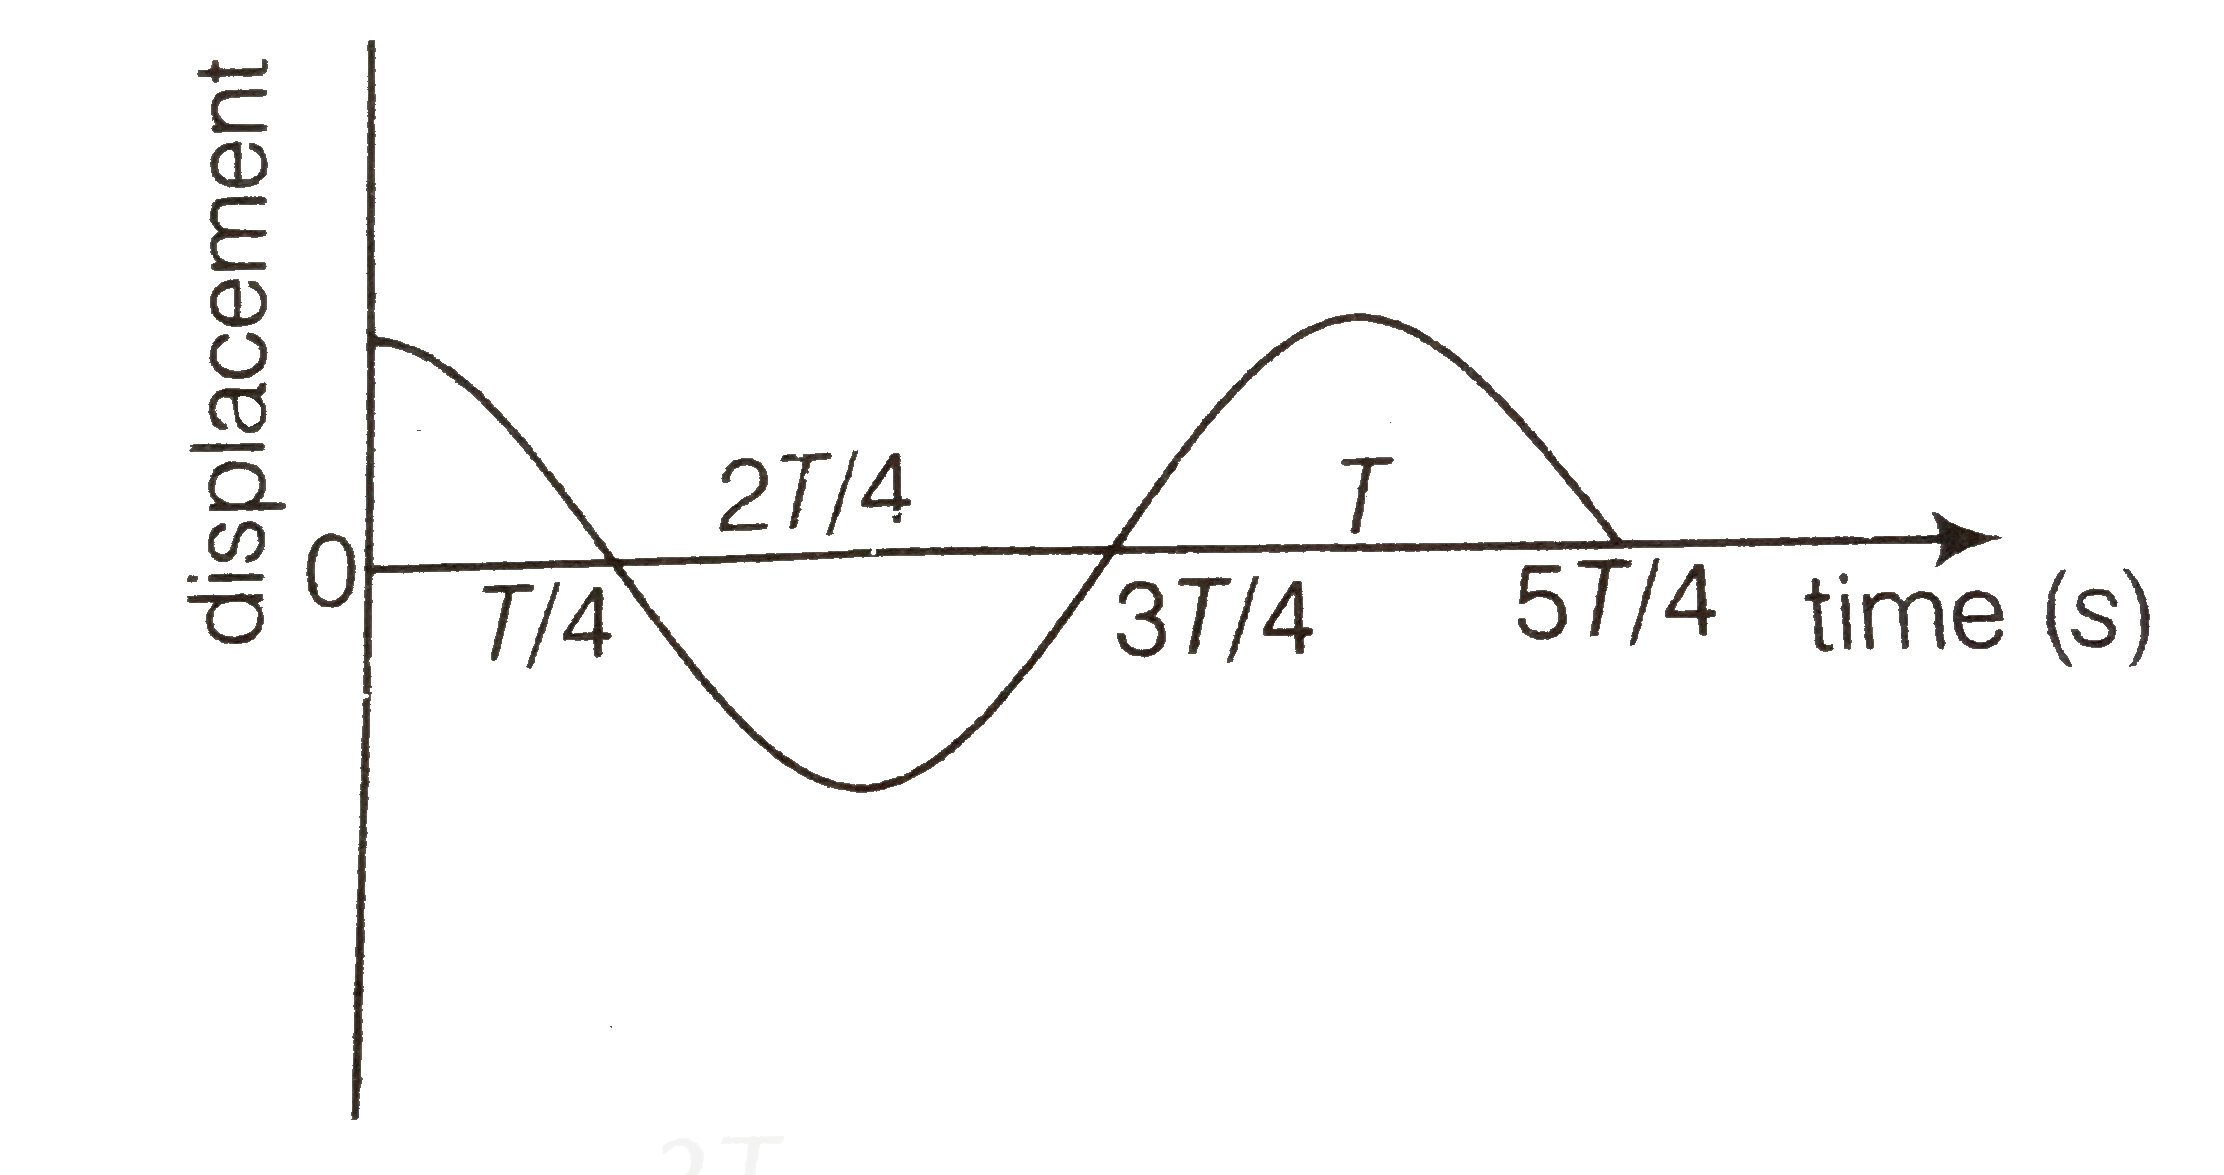
Which of the following statements is correct ?View SolutionThe displacement-time graph of a particle executing SHM is shown in figure. Which of the following statement is/are true ?
 View Solution
Which of the following graph (s) is / are not possible
View Solution


