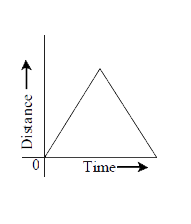
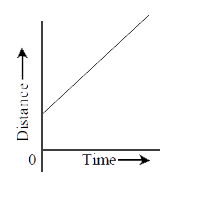
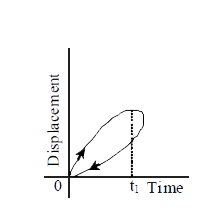
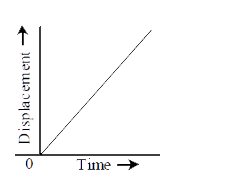
Which of the following graph (s) is / are not possible
A
B
C
D
Video Solution
Text Solution
The (A) graph shows that with increase in time distance first increases and then decreases. However, distance can never decrease with time so this graph is not physically possible. The graph (C) shows that at certain instant of time (t1) body is present at two positions. Also it shows that time first increases then decreases. These conditions are not possible physically.
Hence correct answer is (A) and (C).
|
Updated on:21/07/2023
Topper's Solved these Questions
- BOOK - MOTIONCHAPTER - ONE DIMENSION MOTIONEXERCISE - EXERCSE -1 (Section - A : Distance, Displacement, Velocity and Acceleration, Equation of Motion )26videos
ONE DIMENSION MOTION
- BOOK - MOTIONCHAPTER - ONE DIMENSION MOTIONEXERCISE - EXERCSE -1 (Section - B : Motion under Gravity)11videos
ONE DIMENSION MOTION
- BOOK - MOTIONCHAPTER - NLM & FRICTIONEXERCISE - EXERCISE-4 ( LEVEL-II)15videos
NLM & FRICTION
- BOOK - MOTIONCHAPTER - OPTICSEXERCISE - Exercise45videos
OPTICS
Similar Questions
Knowledge Check
- Question 1 - Select One or More
A particle is dropped from a finite height H above the ground level under gravity . Due to air resistance acceleration of particle becomes a=g−kv in the direction of velocity. Where k= positive constant &v= speed of particle. Then which of the following graph(s) is / are possible (t0= time when particle touches the ground ):
A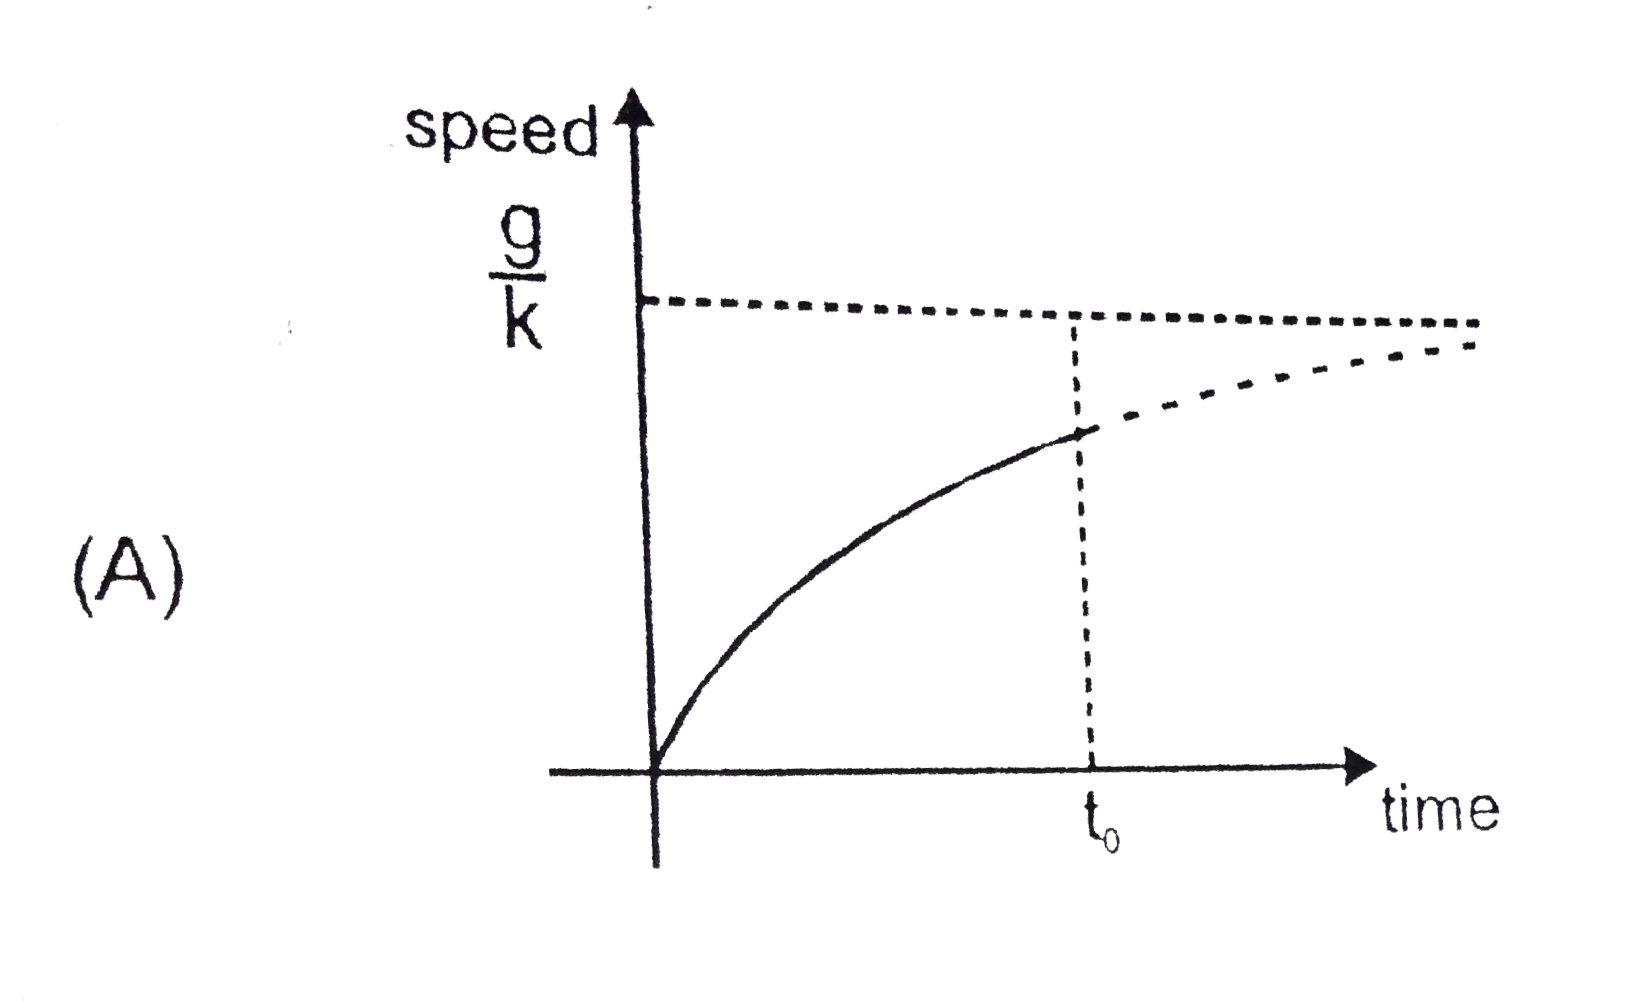 B
B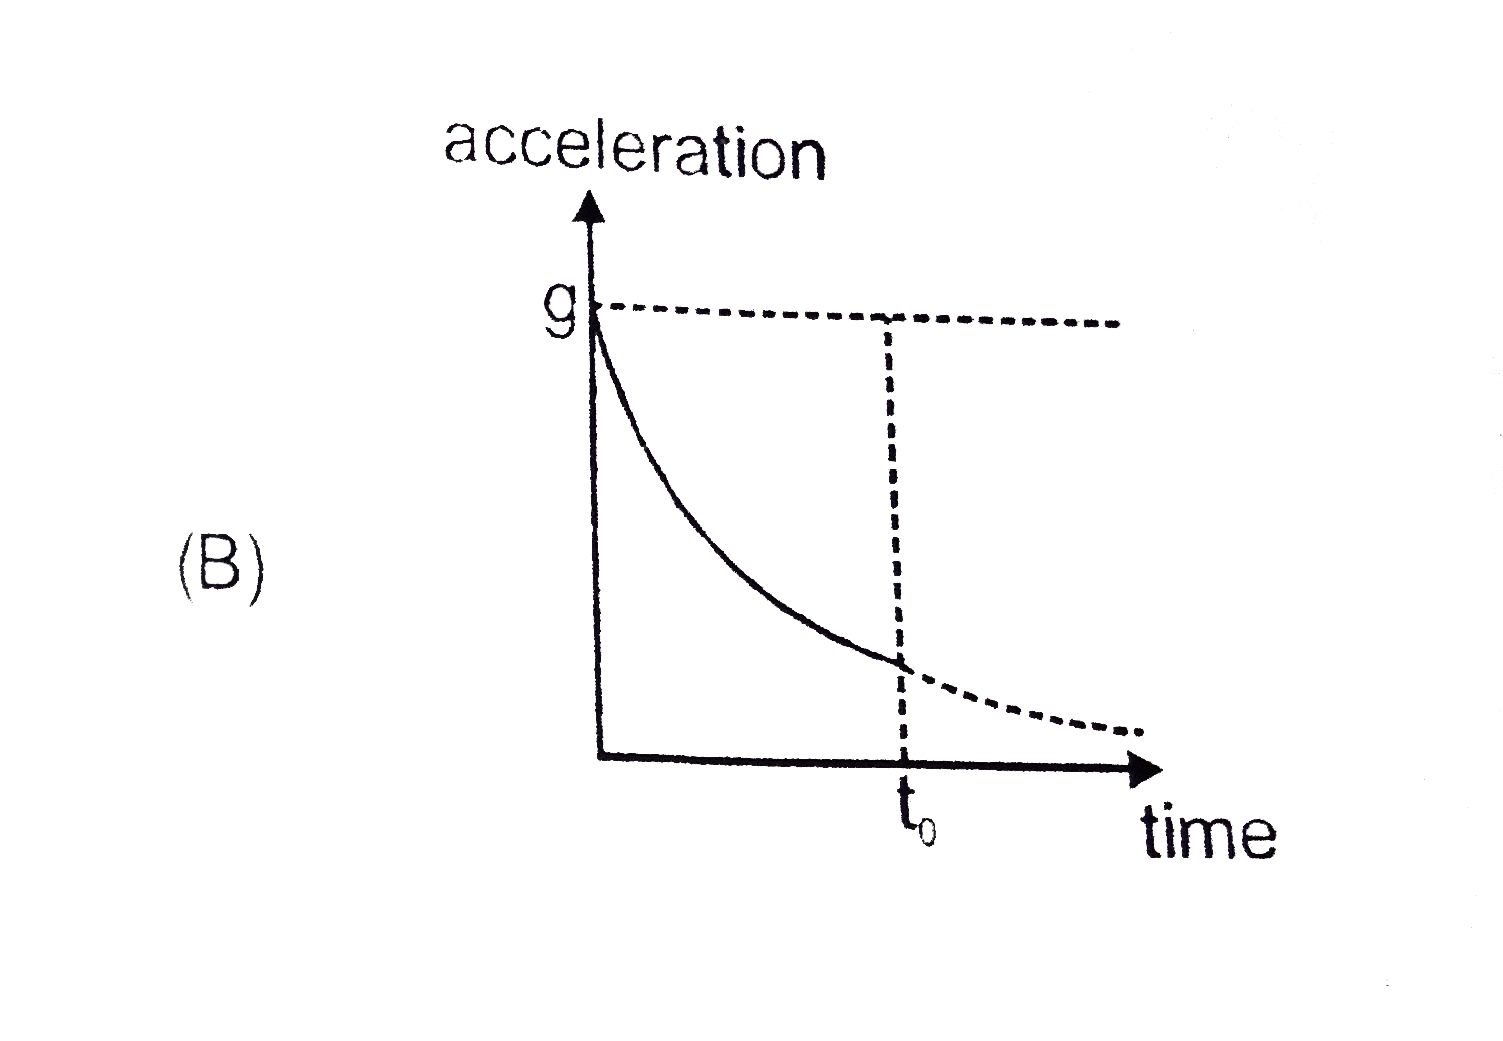 C
C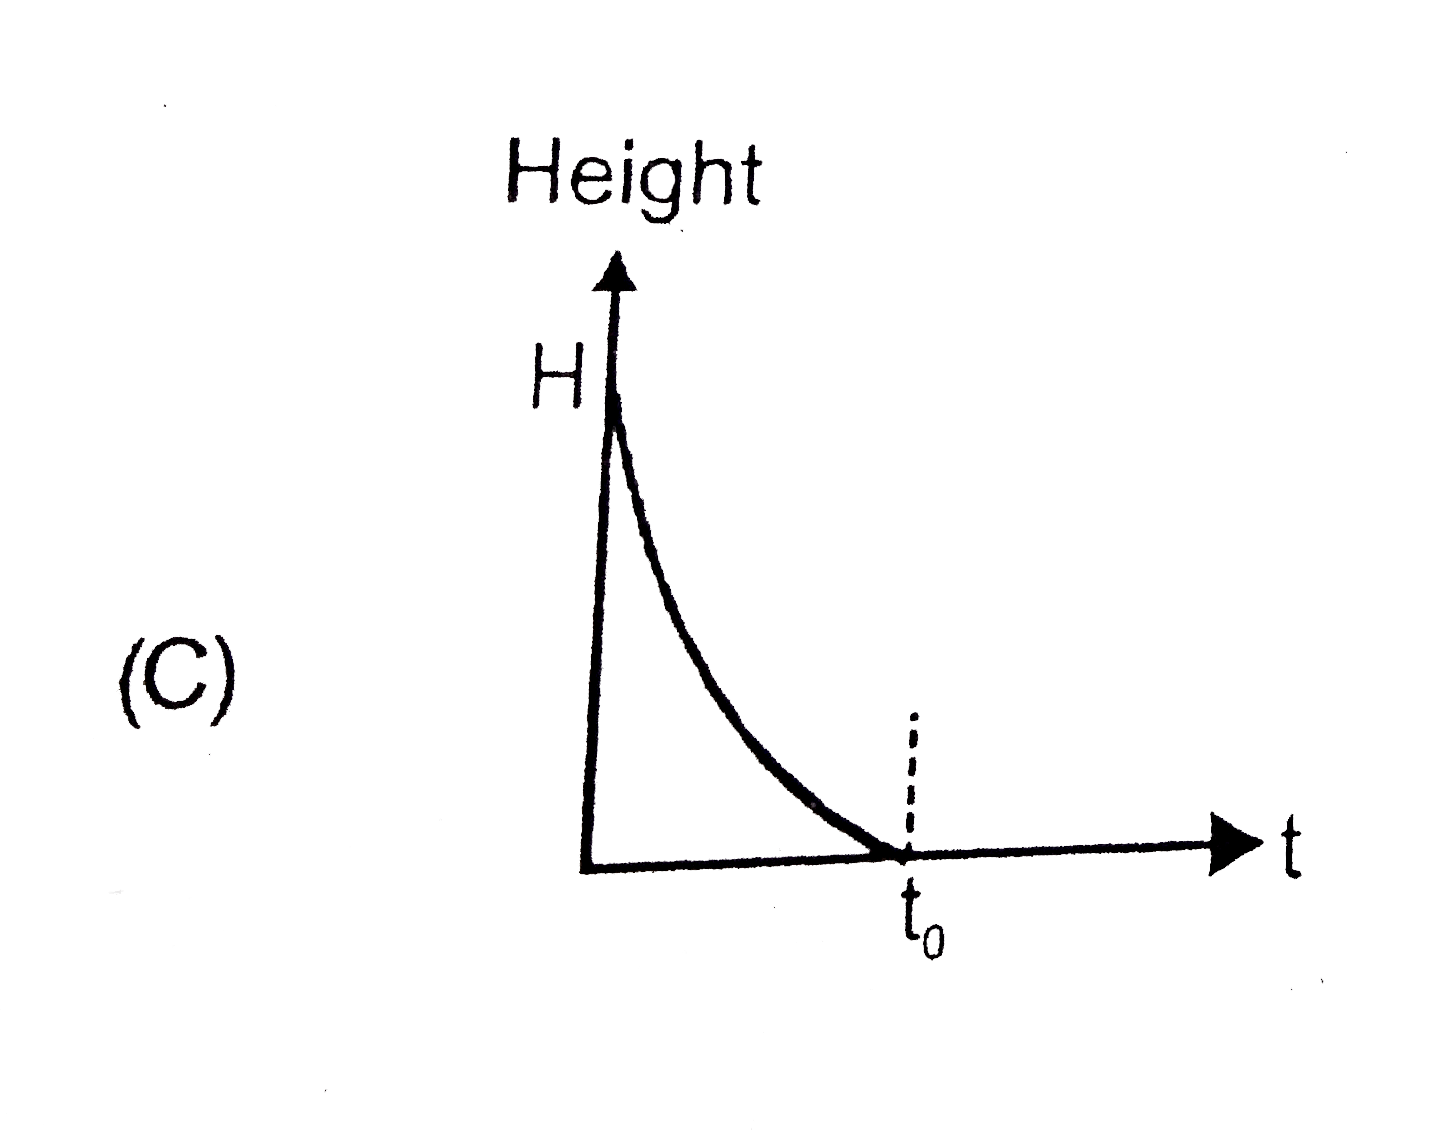 D
D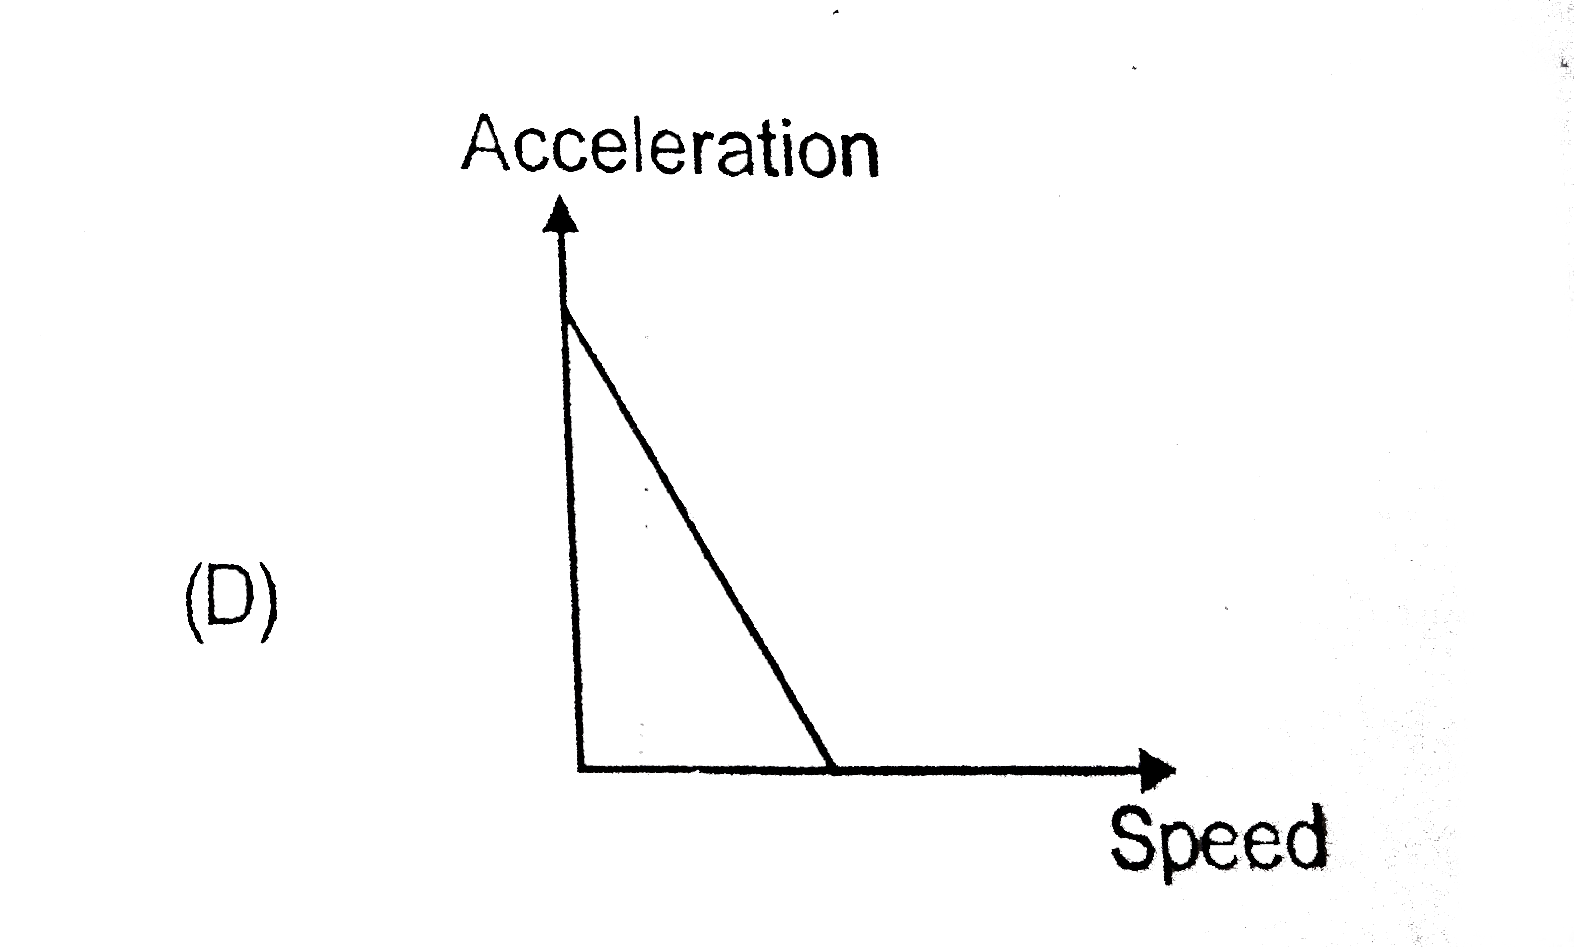
- Question 2 - Select One
Out of the following graph(s), which is / are not possible ?
A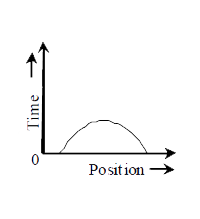 B
B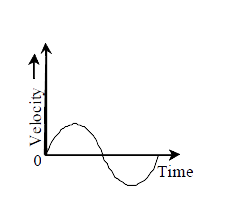 C
C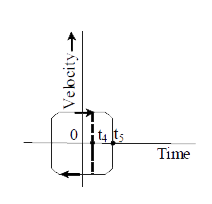 D
D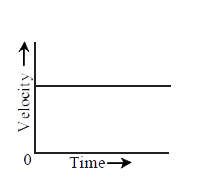
- Question 3 - Select One or More
Which of the following graphs is/are correct.
A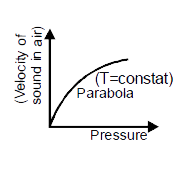 B
B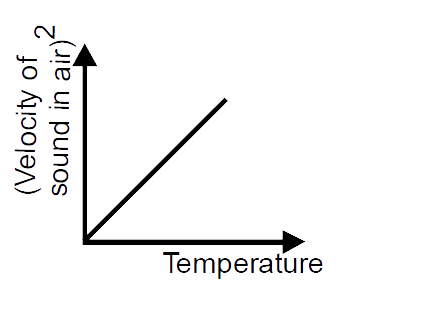 C
C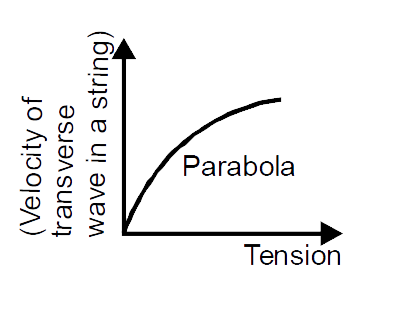 D
D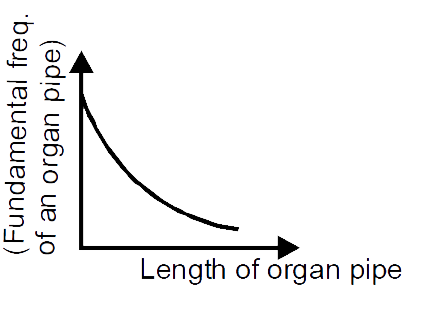

 , Which of the following graphs is suitable