Question 1 and 2 refer to the information and graph below.
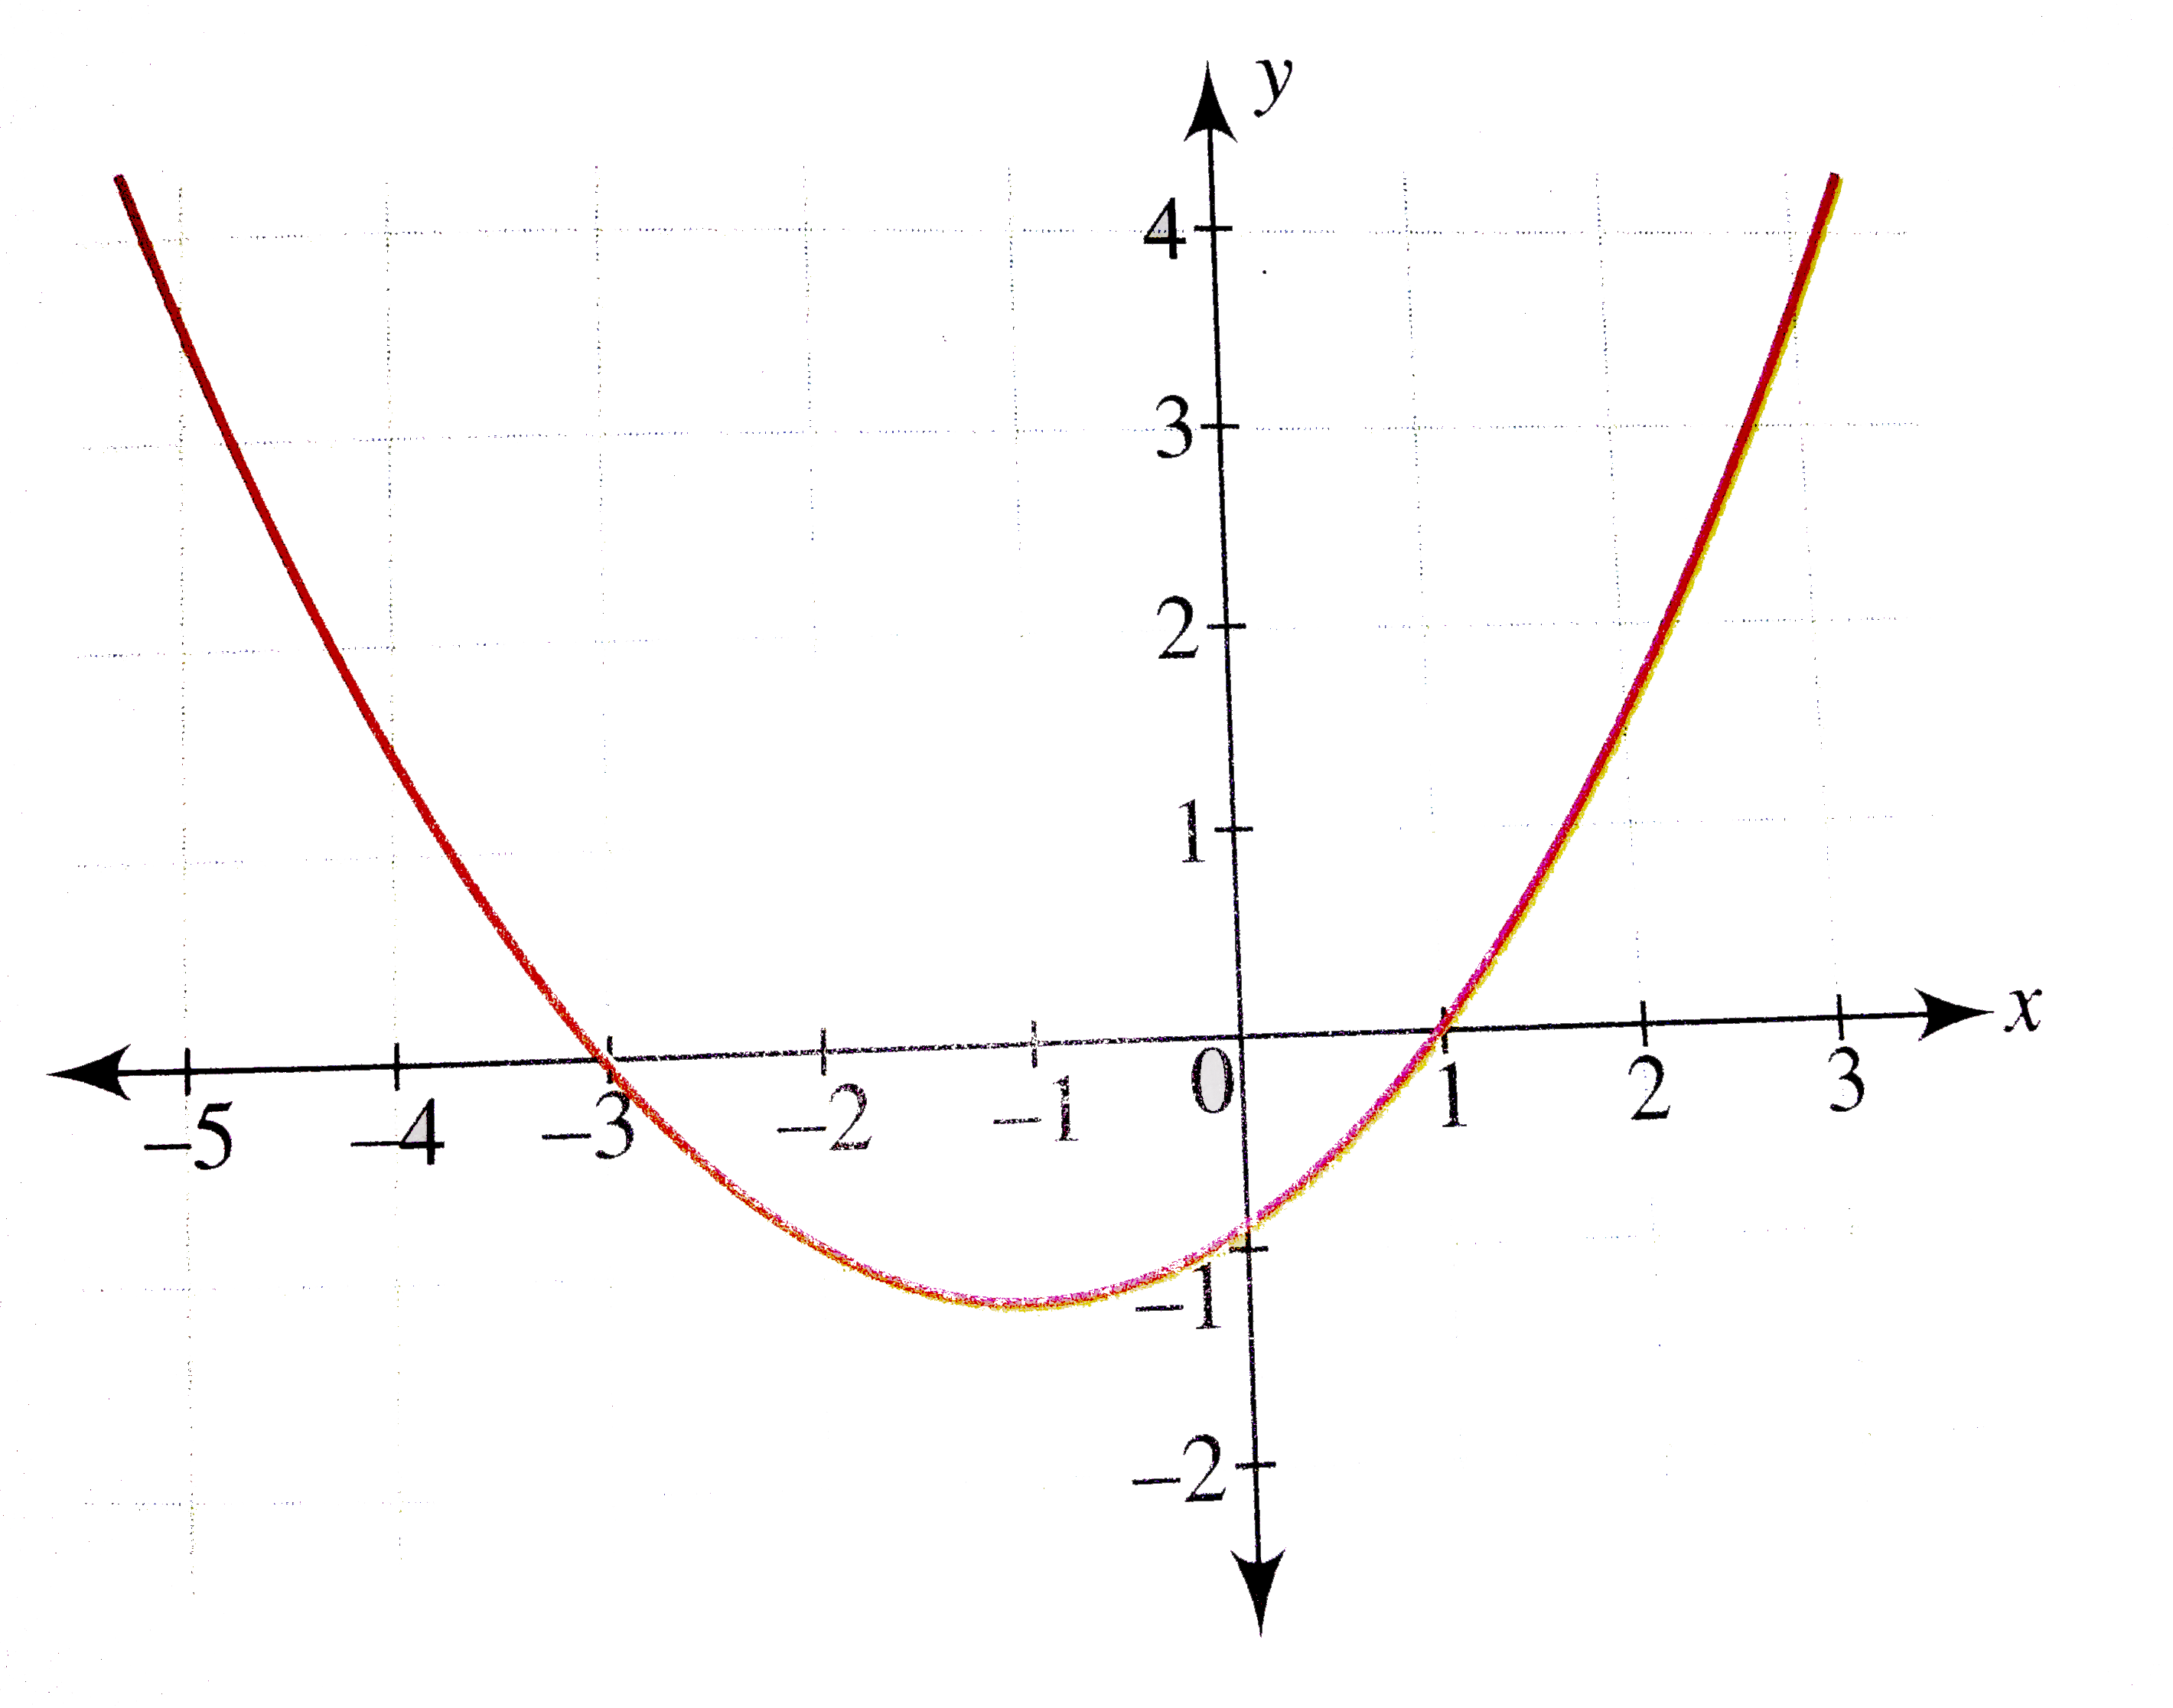
Let function f be defined by the graph in the accompanying figure.
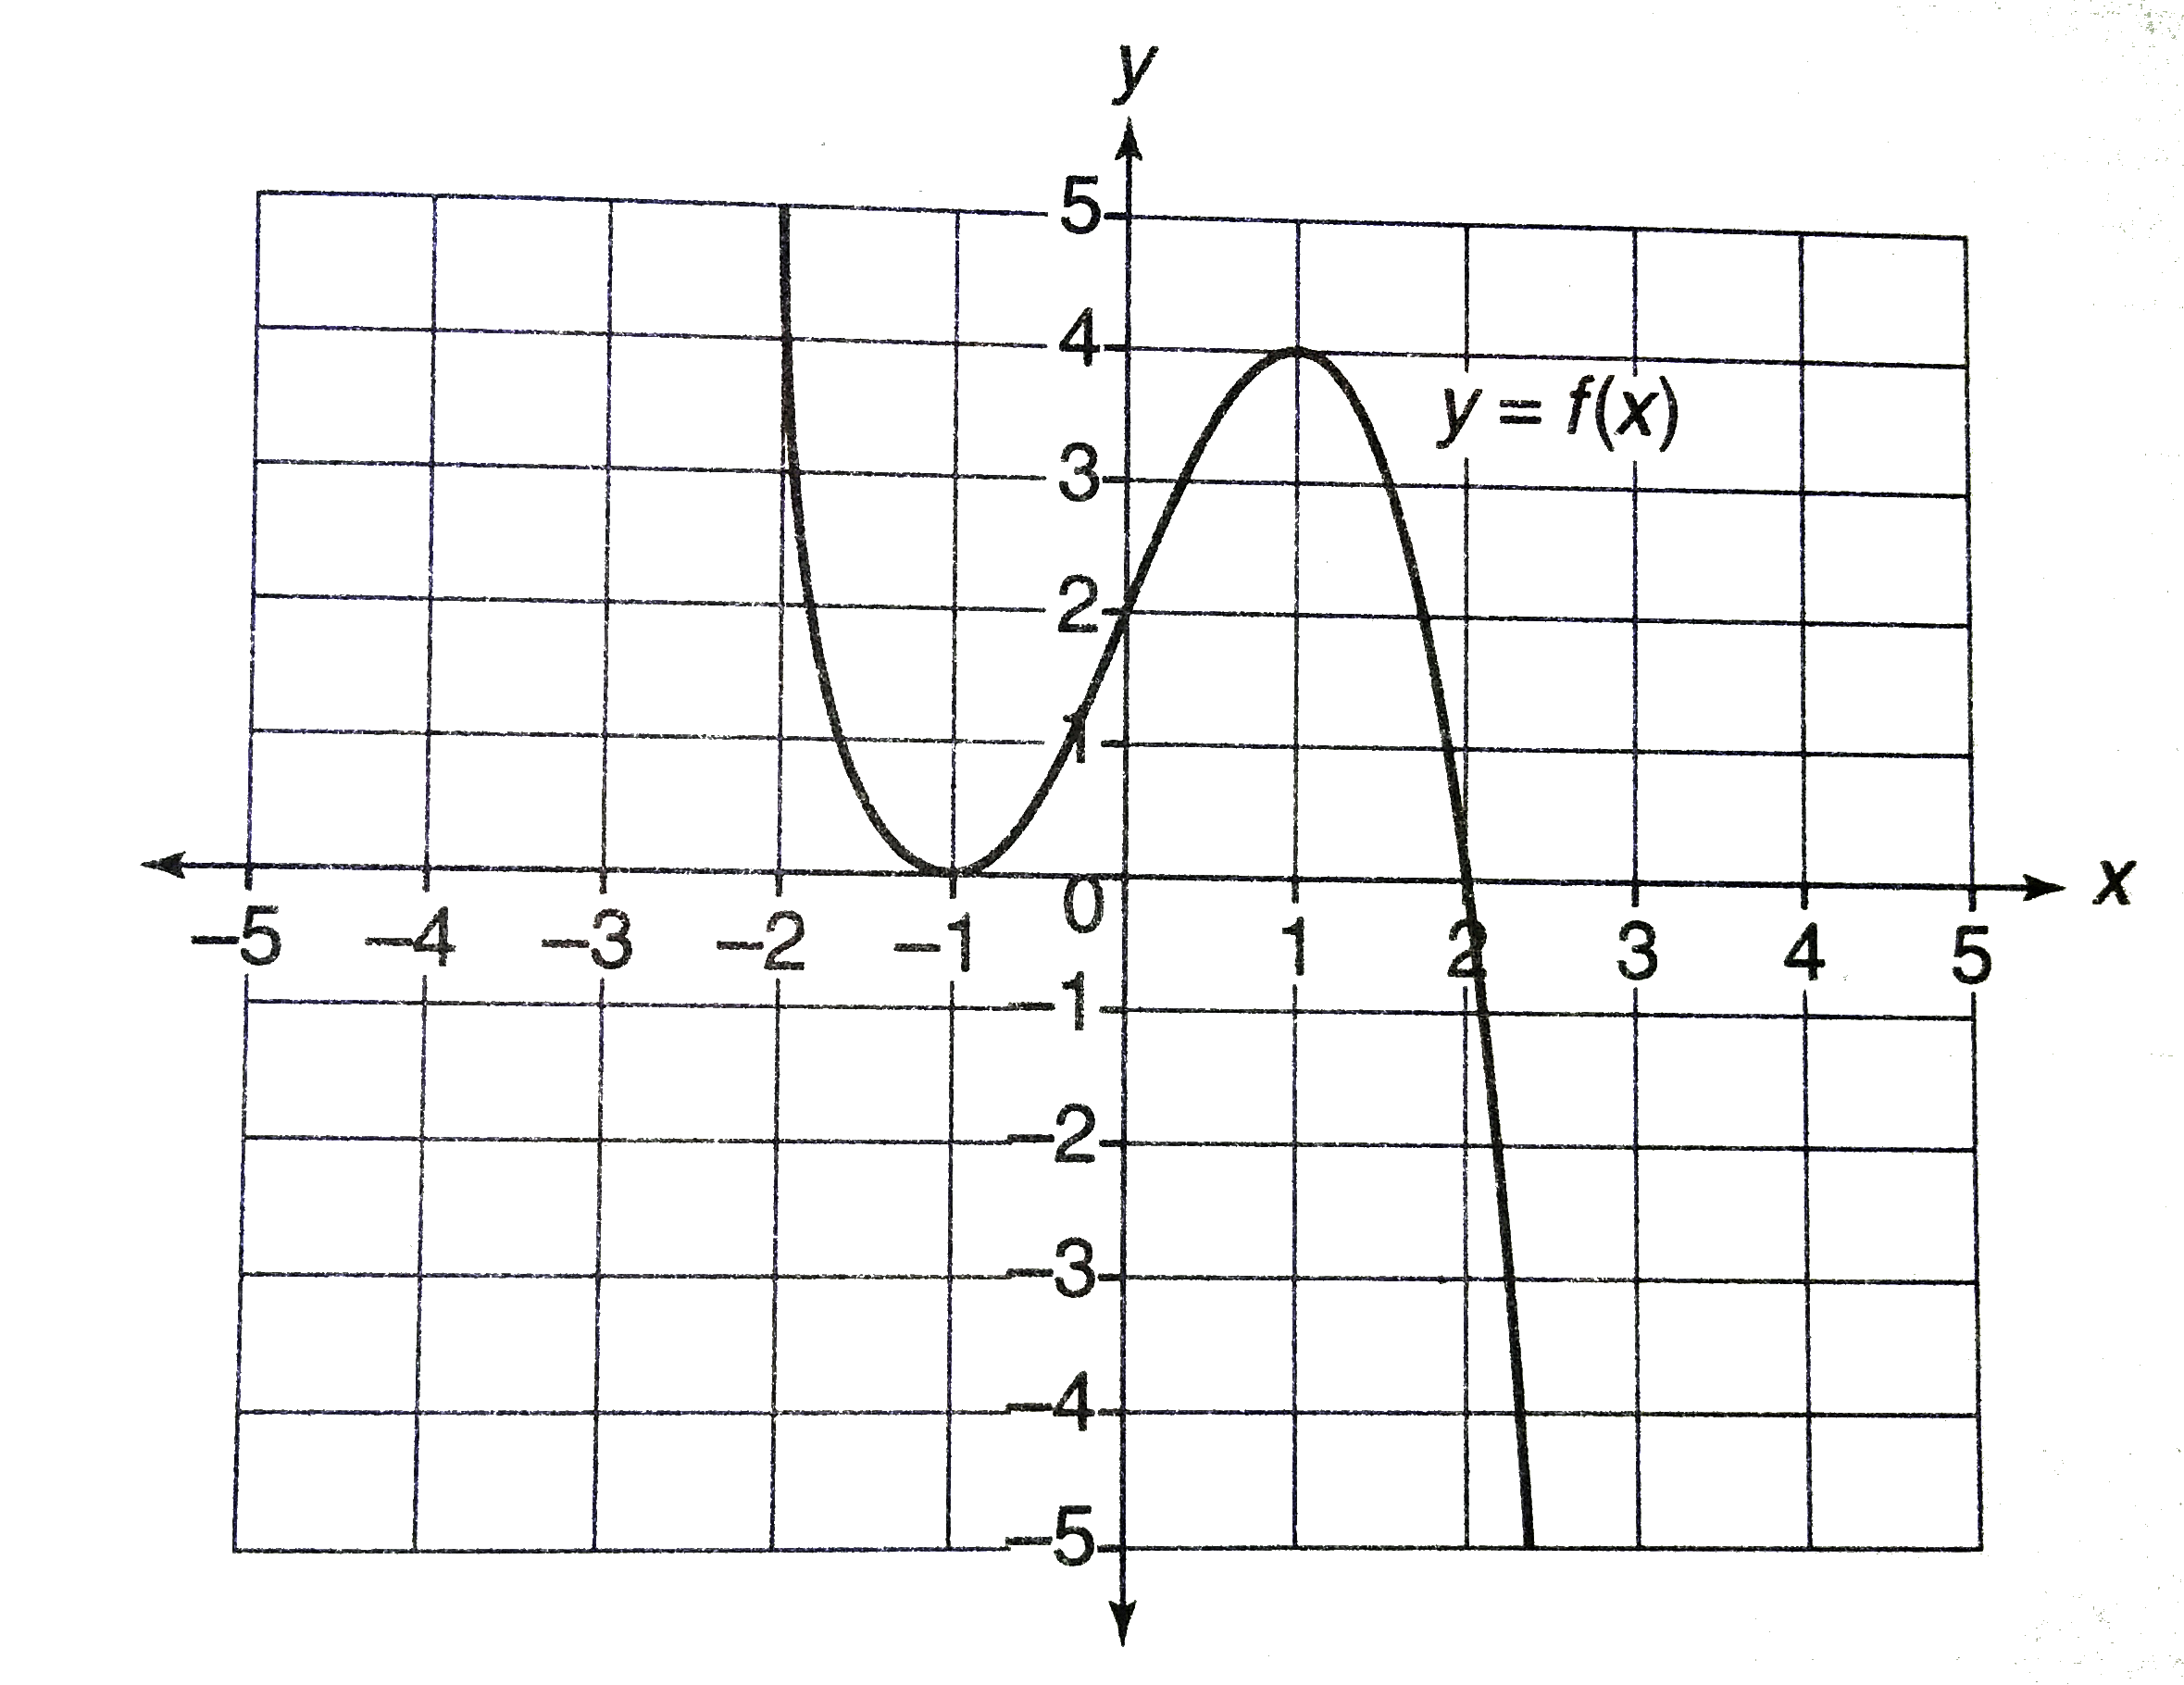
Q. For what positive integer k is (1, 0) an x-intercept of the graph of y=f(x−k)?
The correct Answer is:2
Step by step video, text & image solution for Question 1 and 2 refer to the information and graph below. Let function f be defined by the graph in the accompanying figure. Q. For what positive integer k is (1, 0) an x-intercept of the graph of y=f(x-k)? by Maths experts to help you in doubts & scoring excellent marks in Class 12 exams.
Topper's Solved these Questions
- BOOK - ENGLISH SATCHAPTER - PASSPORT TO ADVANCED MATHEXERCISE - EXERCISE80videos
PASSPORT TO ADVANCED MATH
- BOOK - ENGLISH SATCHAPTER - PASSPORT TO ADVANCED MATHEXERCISE - Multiple Choice90videos
PASSPORT TO ADVANCED MATH
- BOOK - ENGLISH SATCHAPTER - PARAMETRIC EQUATIONS EXERCISE - EXERCISES3videos
PARAMETRIC EQUATIONS
- BOOK - ENGLISH SATCHAPTER - PIECEWISE FUNCTIONSEXERCISE - EXERCISES8videos
PIECEWISE FUNCTIONS
Similar Questions
Question 1 and 2 refer to the information and graph below.
Let function f be defined by the graph in the accompanying figure.
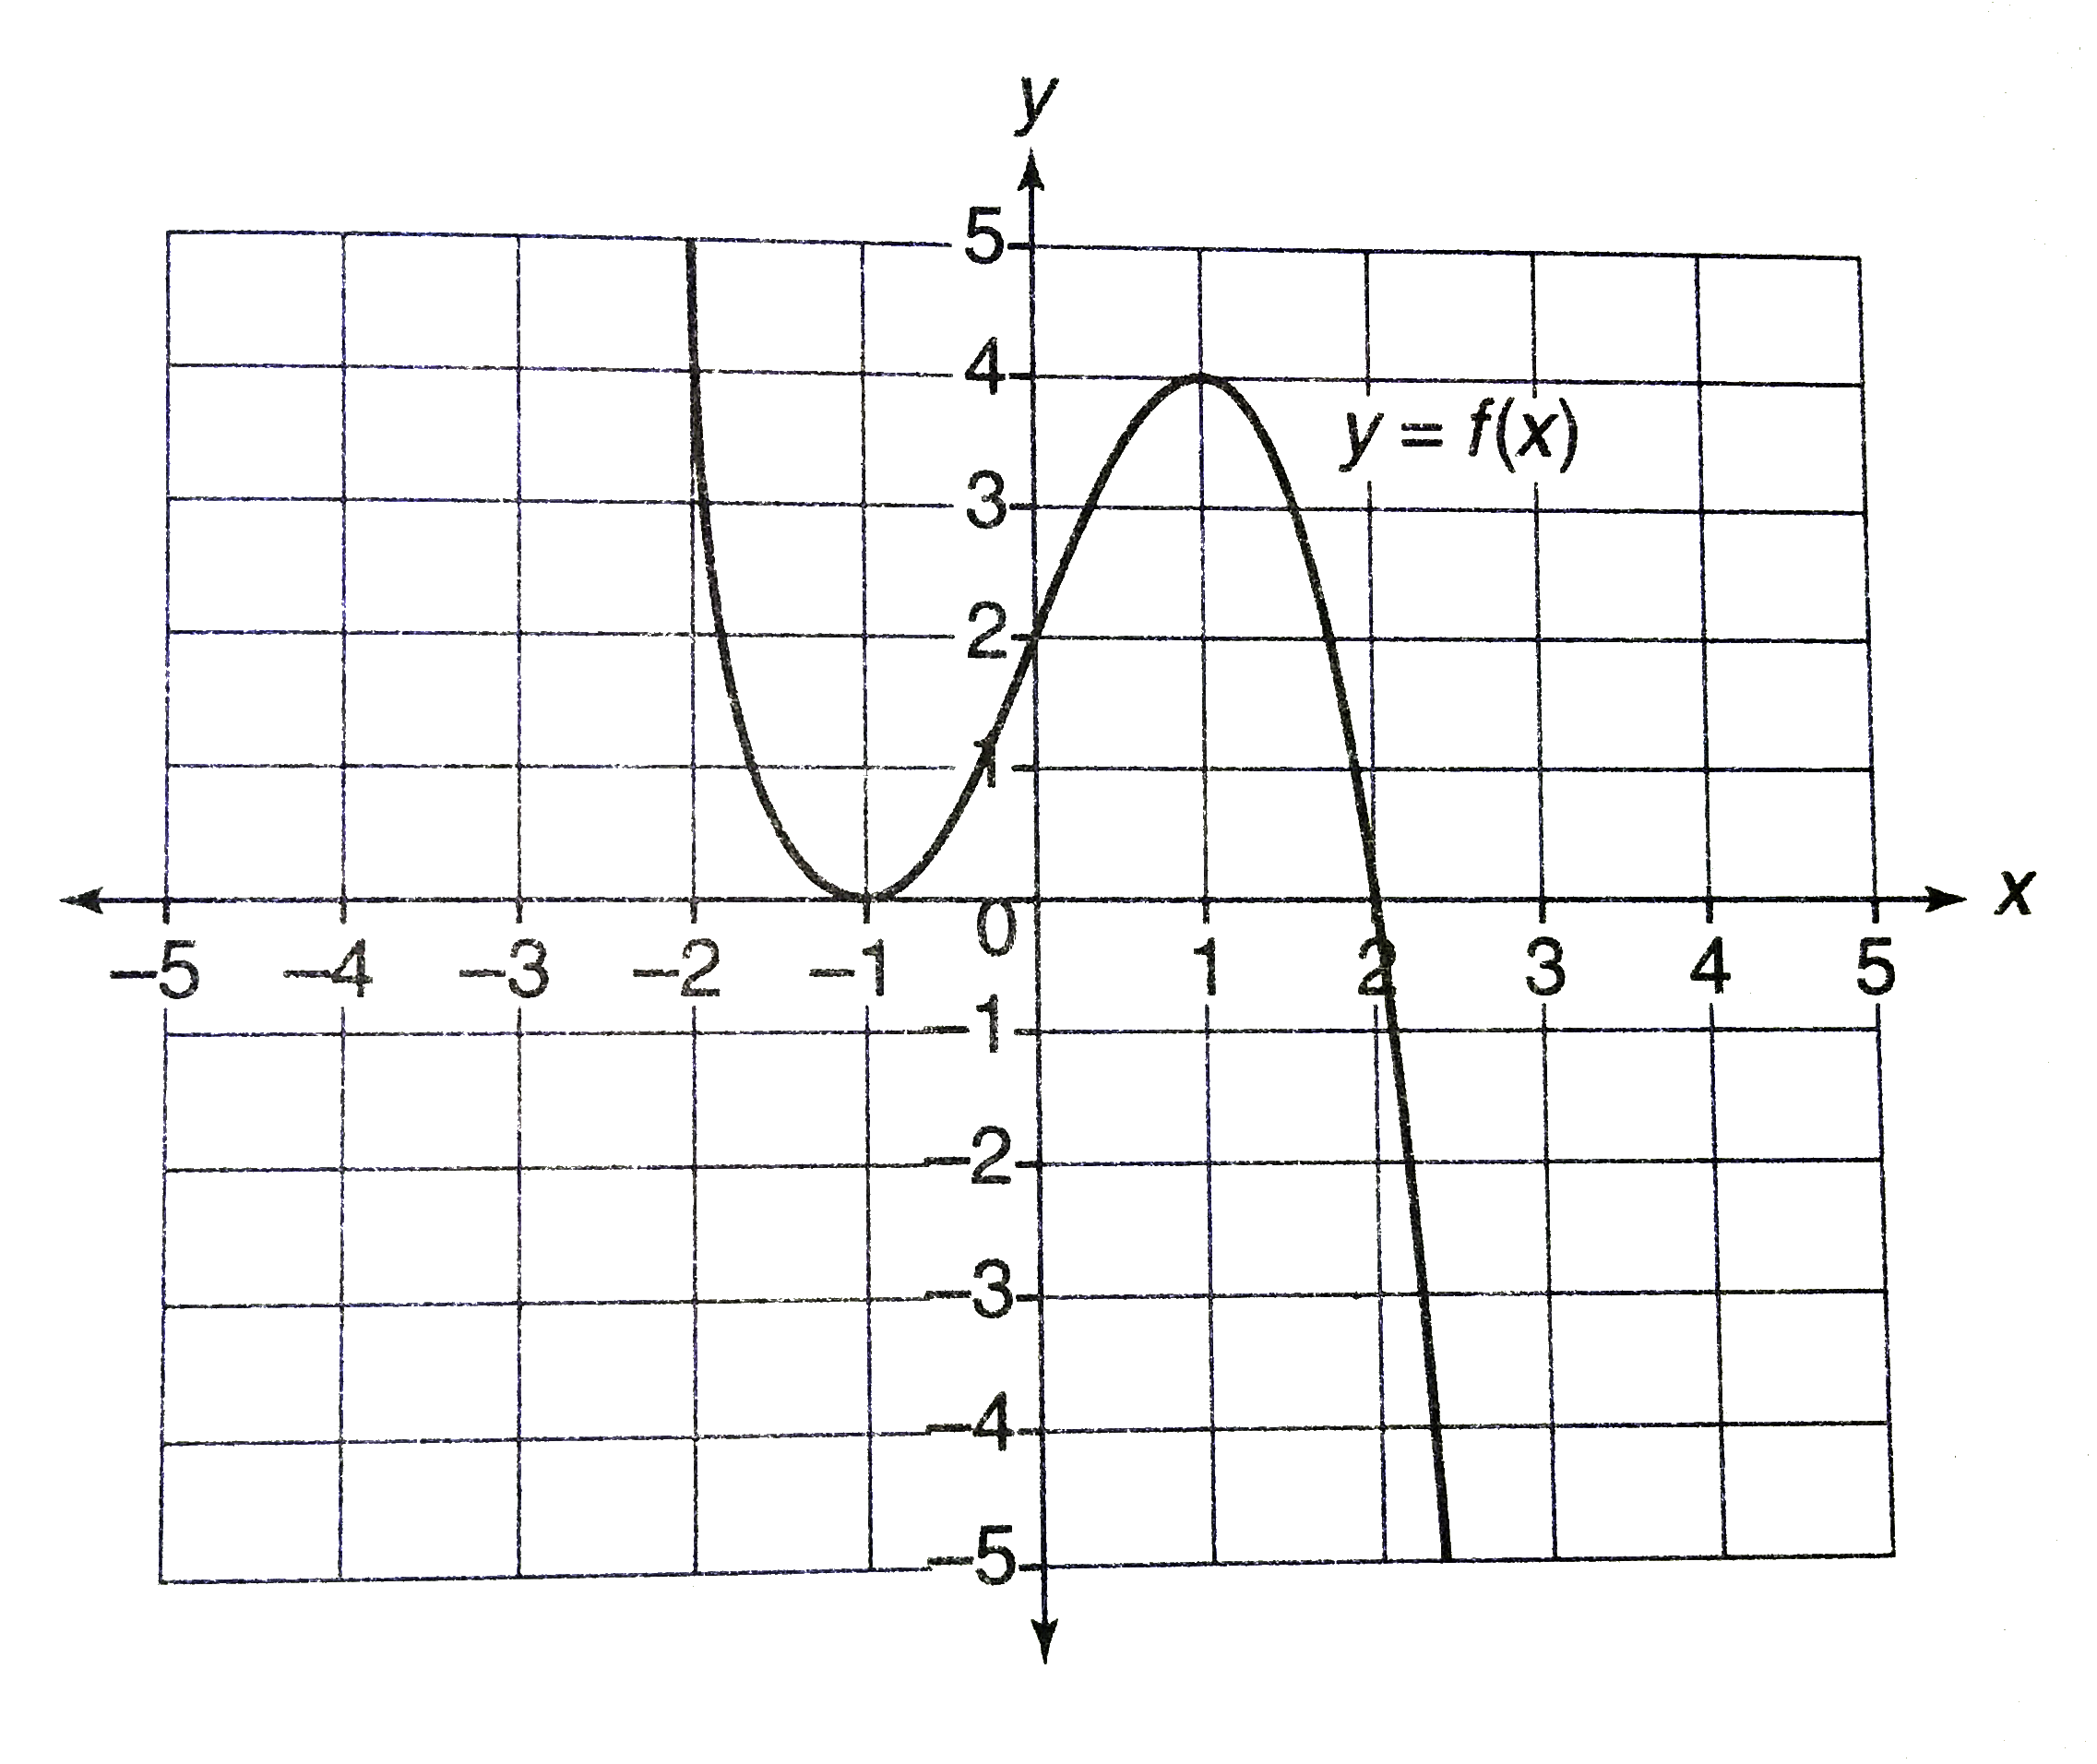
Q. Let m represents the number of points at which the graphs of y=f(x)andg(x)=3 intersect. Let n represents the number of points at which the graphs of y=f(x)−1andg(x)=3 intersect. What is the value of m+n?View SolutionLet the function f and g be defined by the graphs in the accompanying diagram. What is the value of f(g(3))?
View Solution
Knowledge Check
- Question 1 - Select One
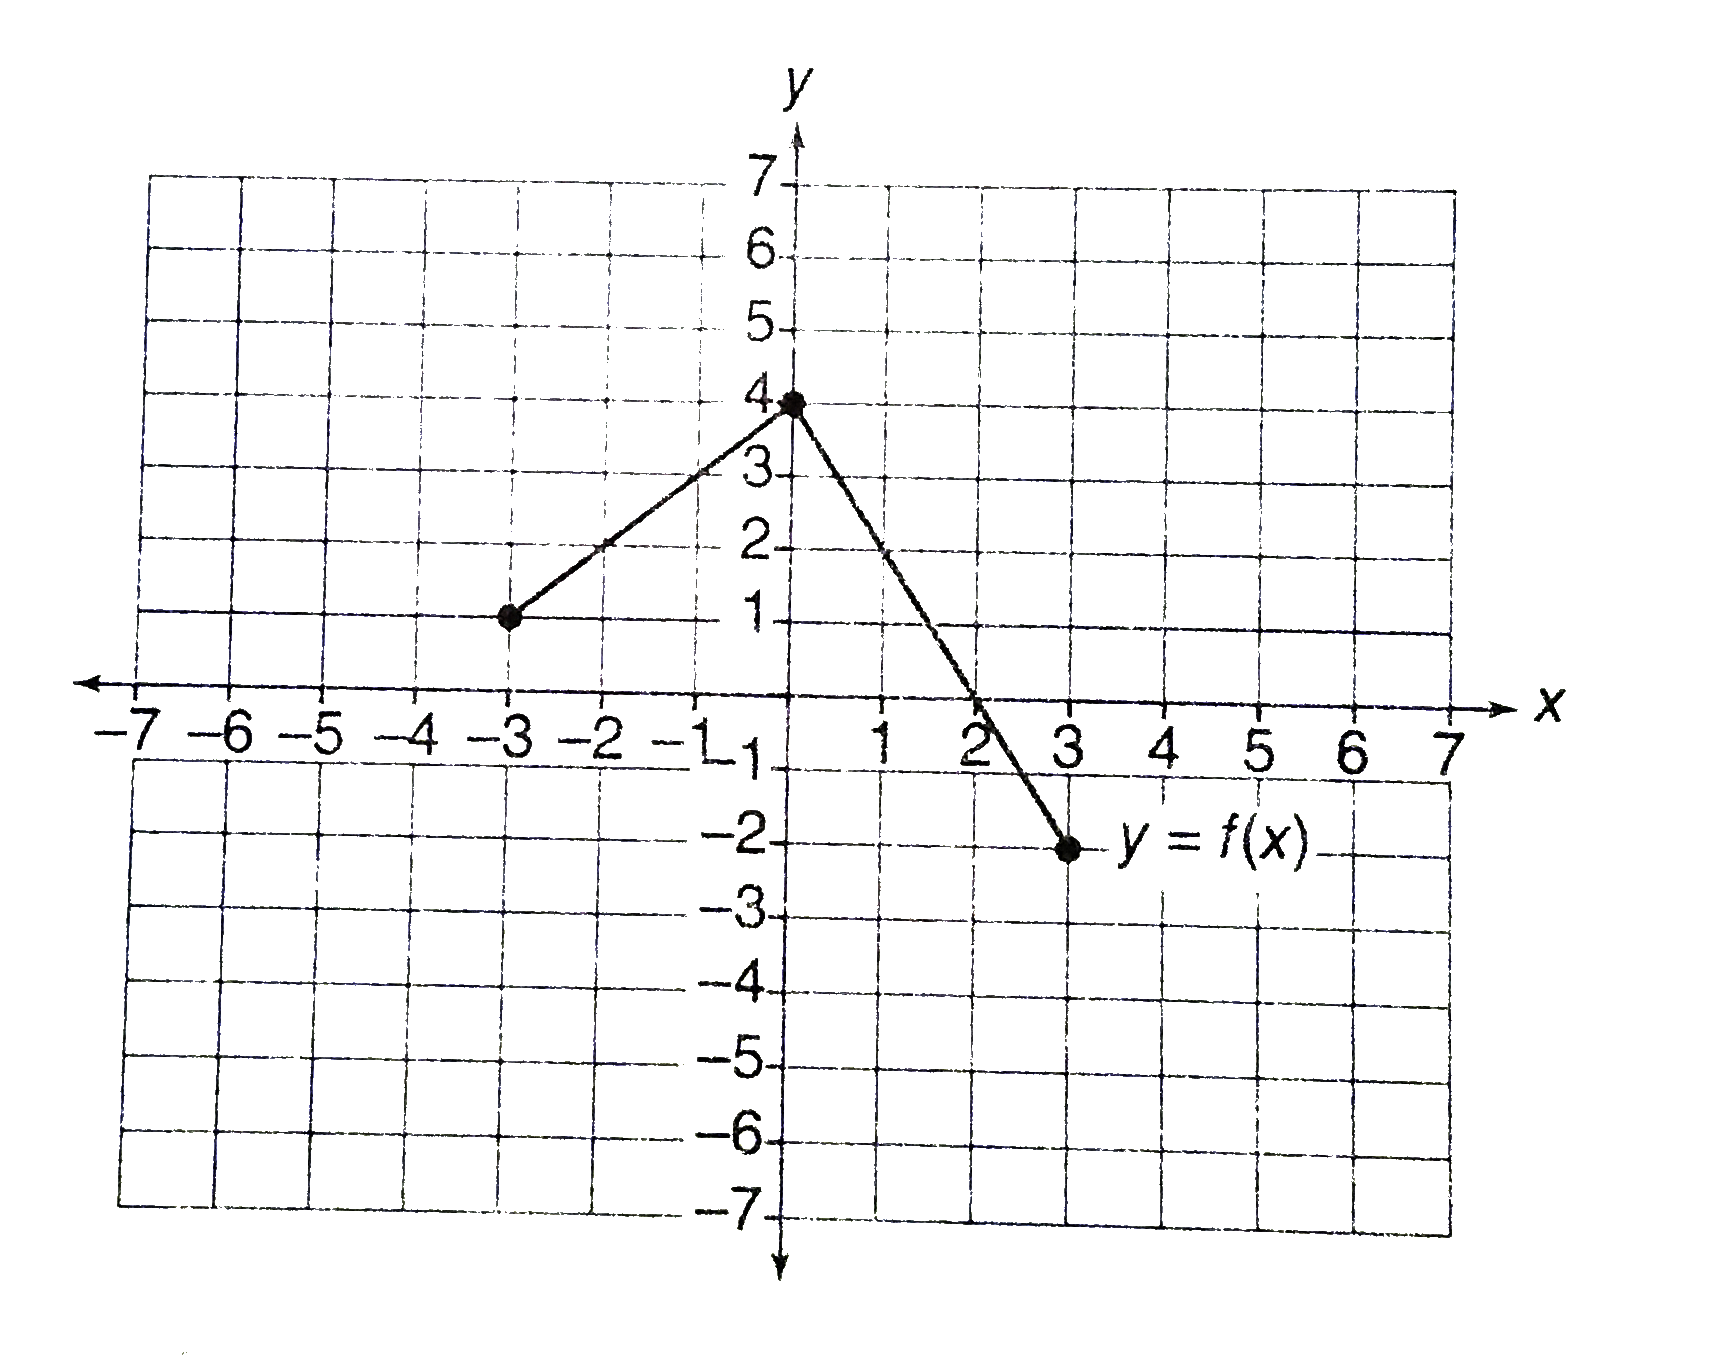
If the accomanying figure above shows the graph of function f, which of the following could represent the graph of y=f(x+1)?A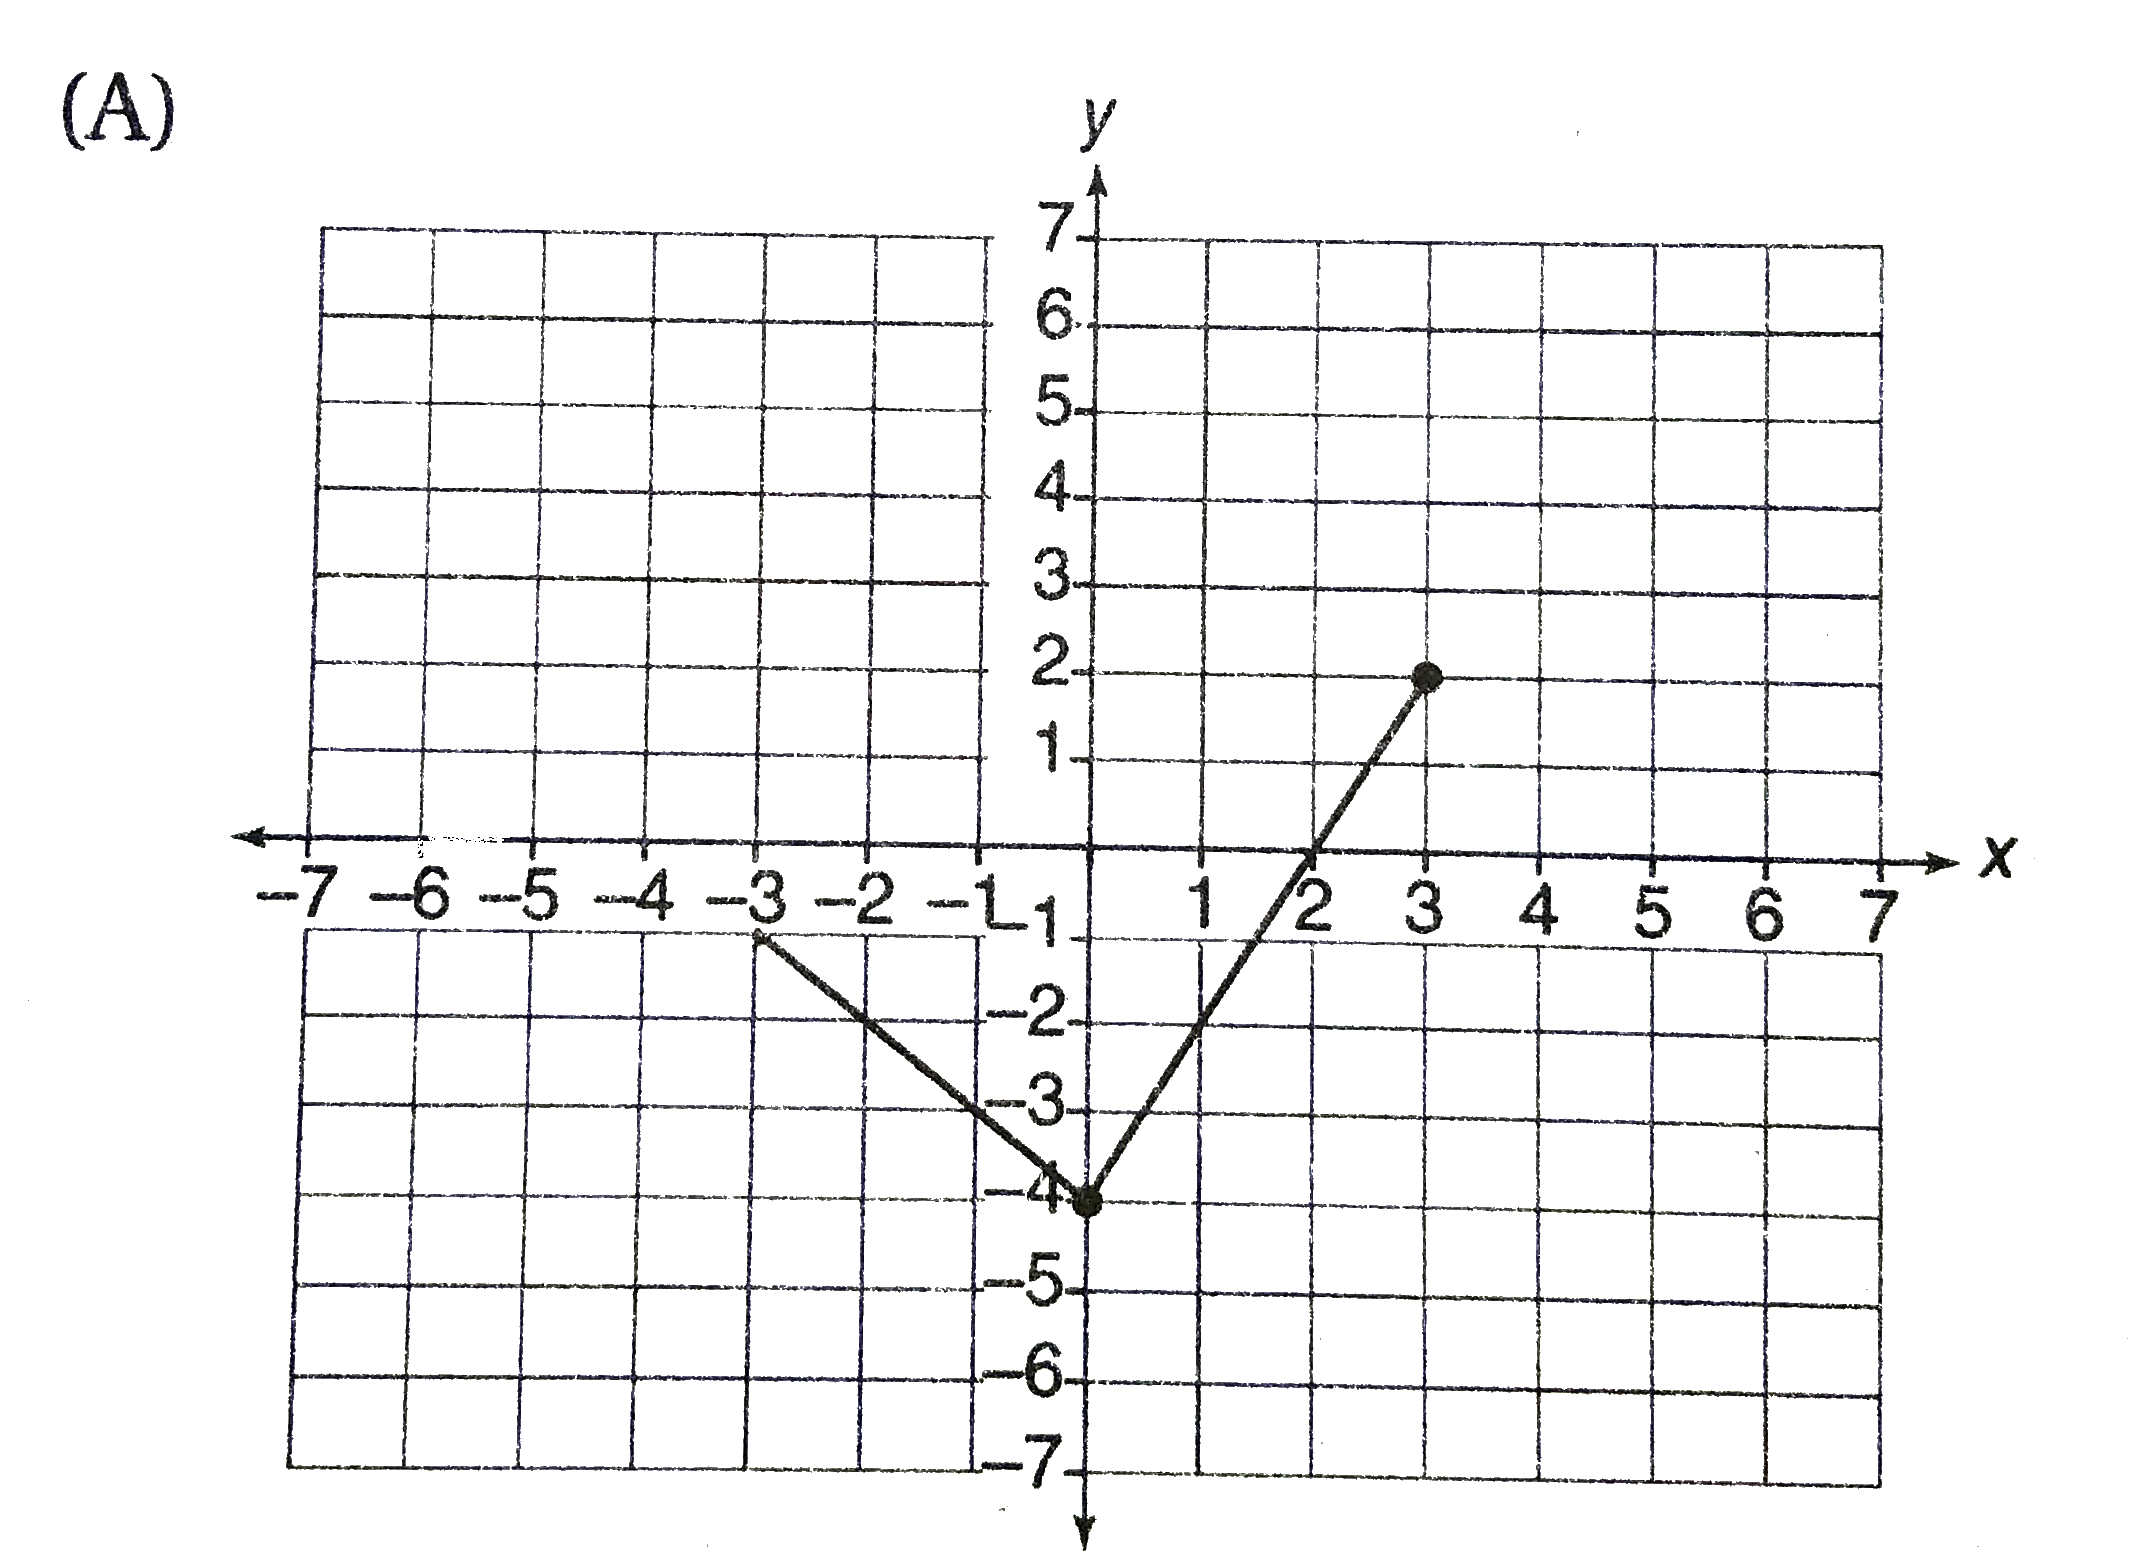 B
B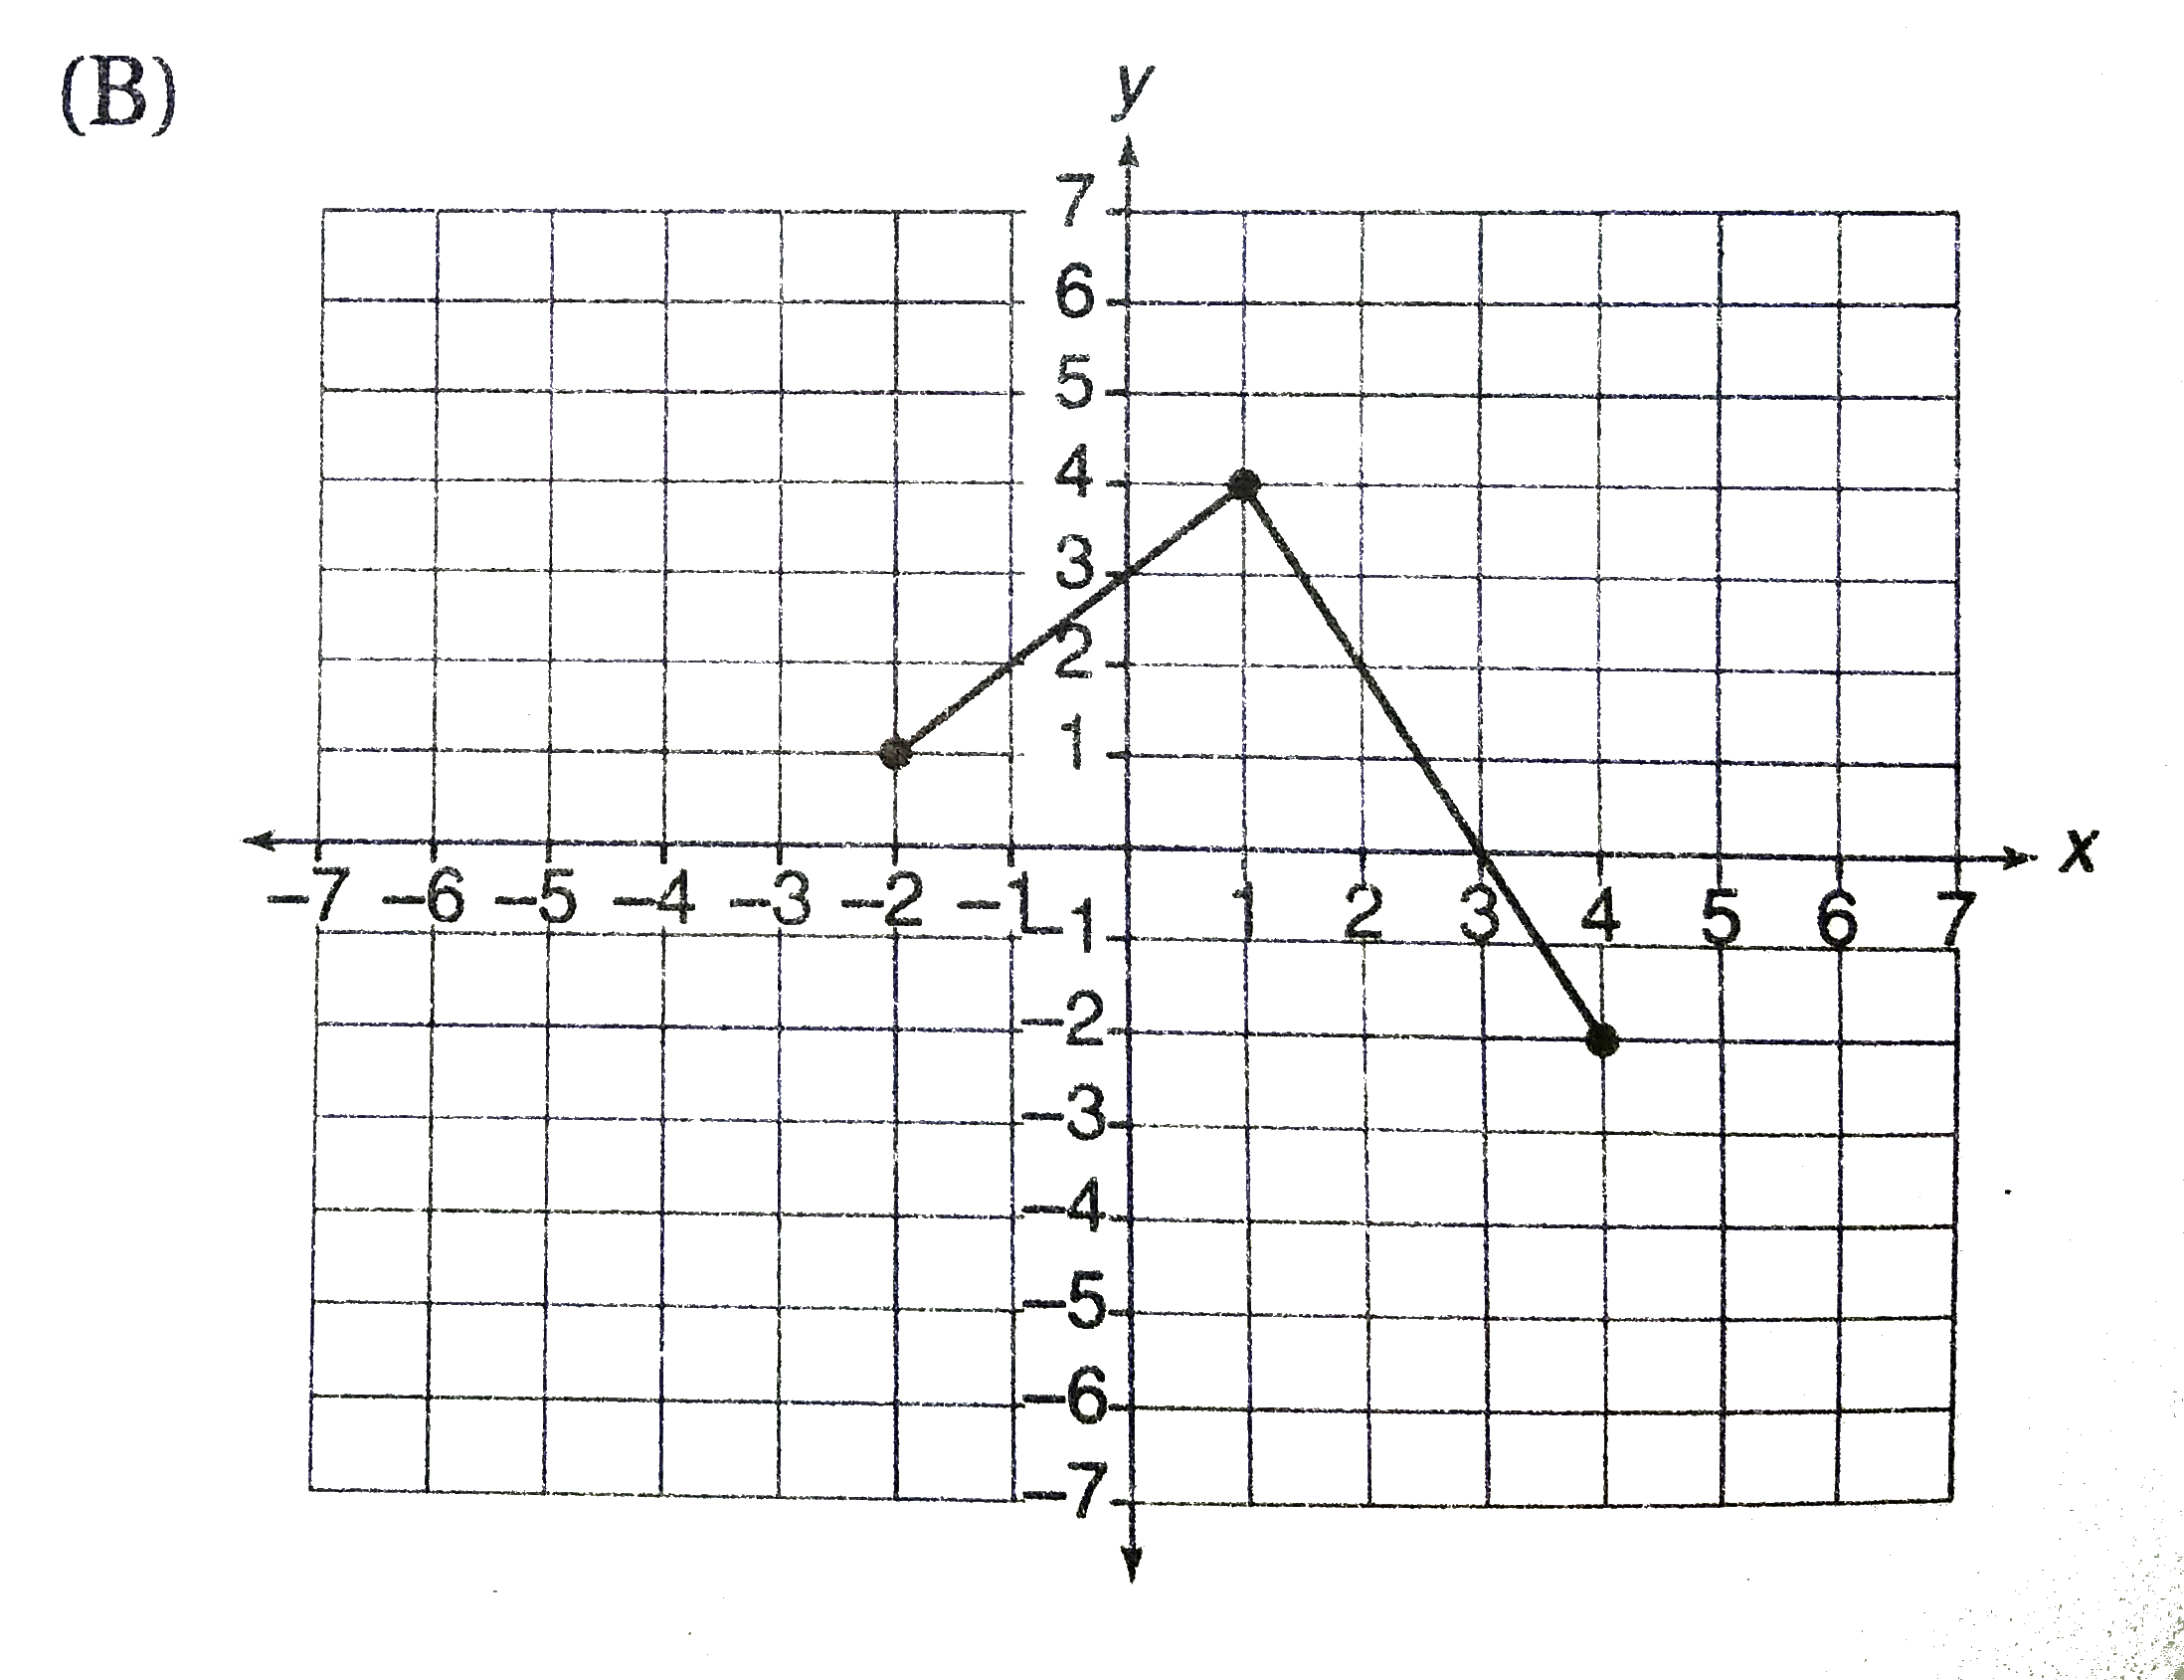 C
C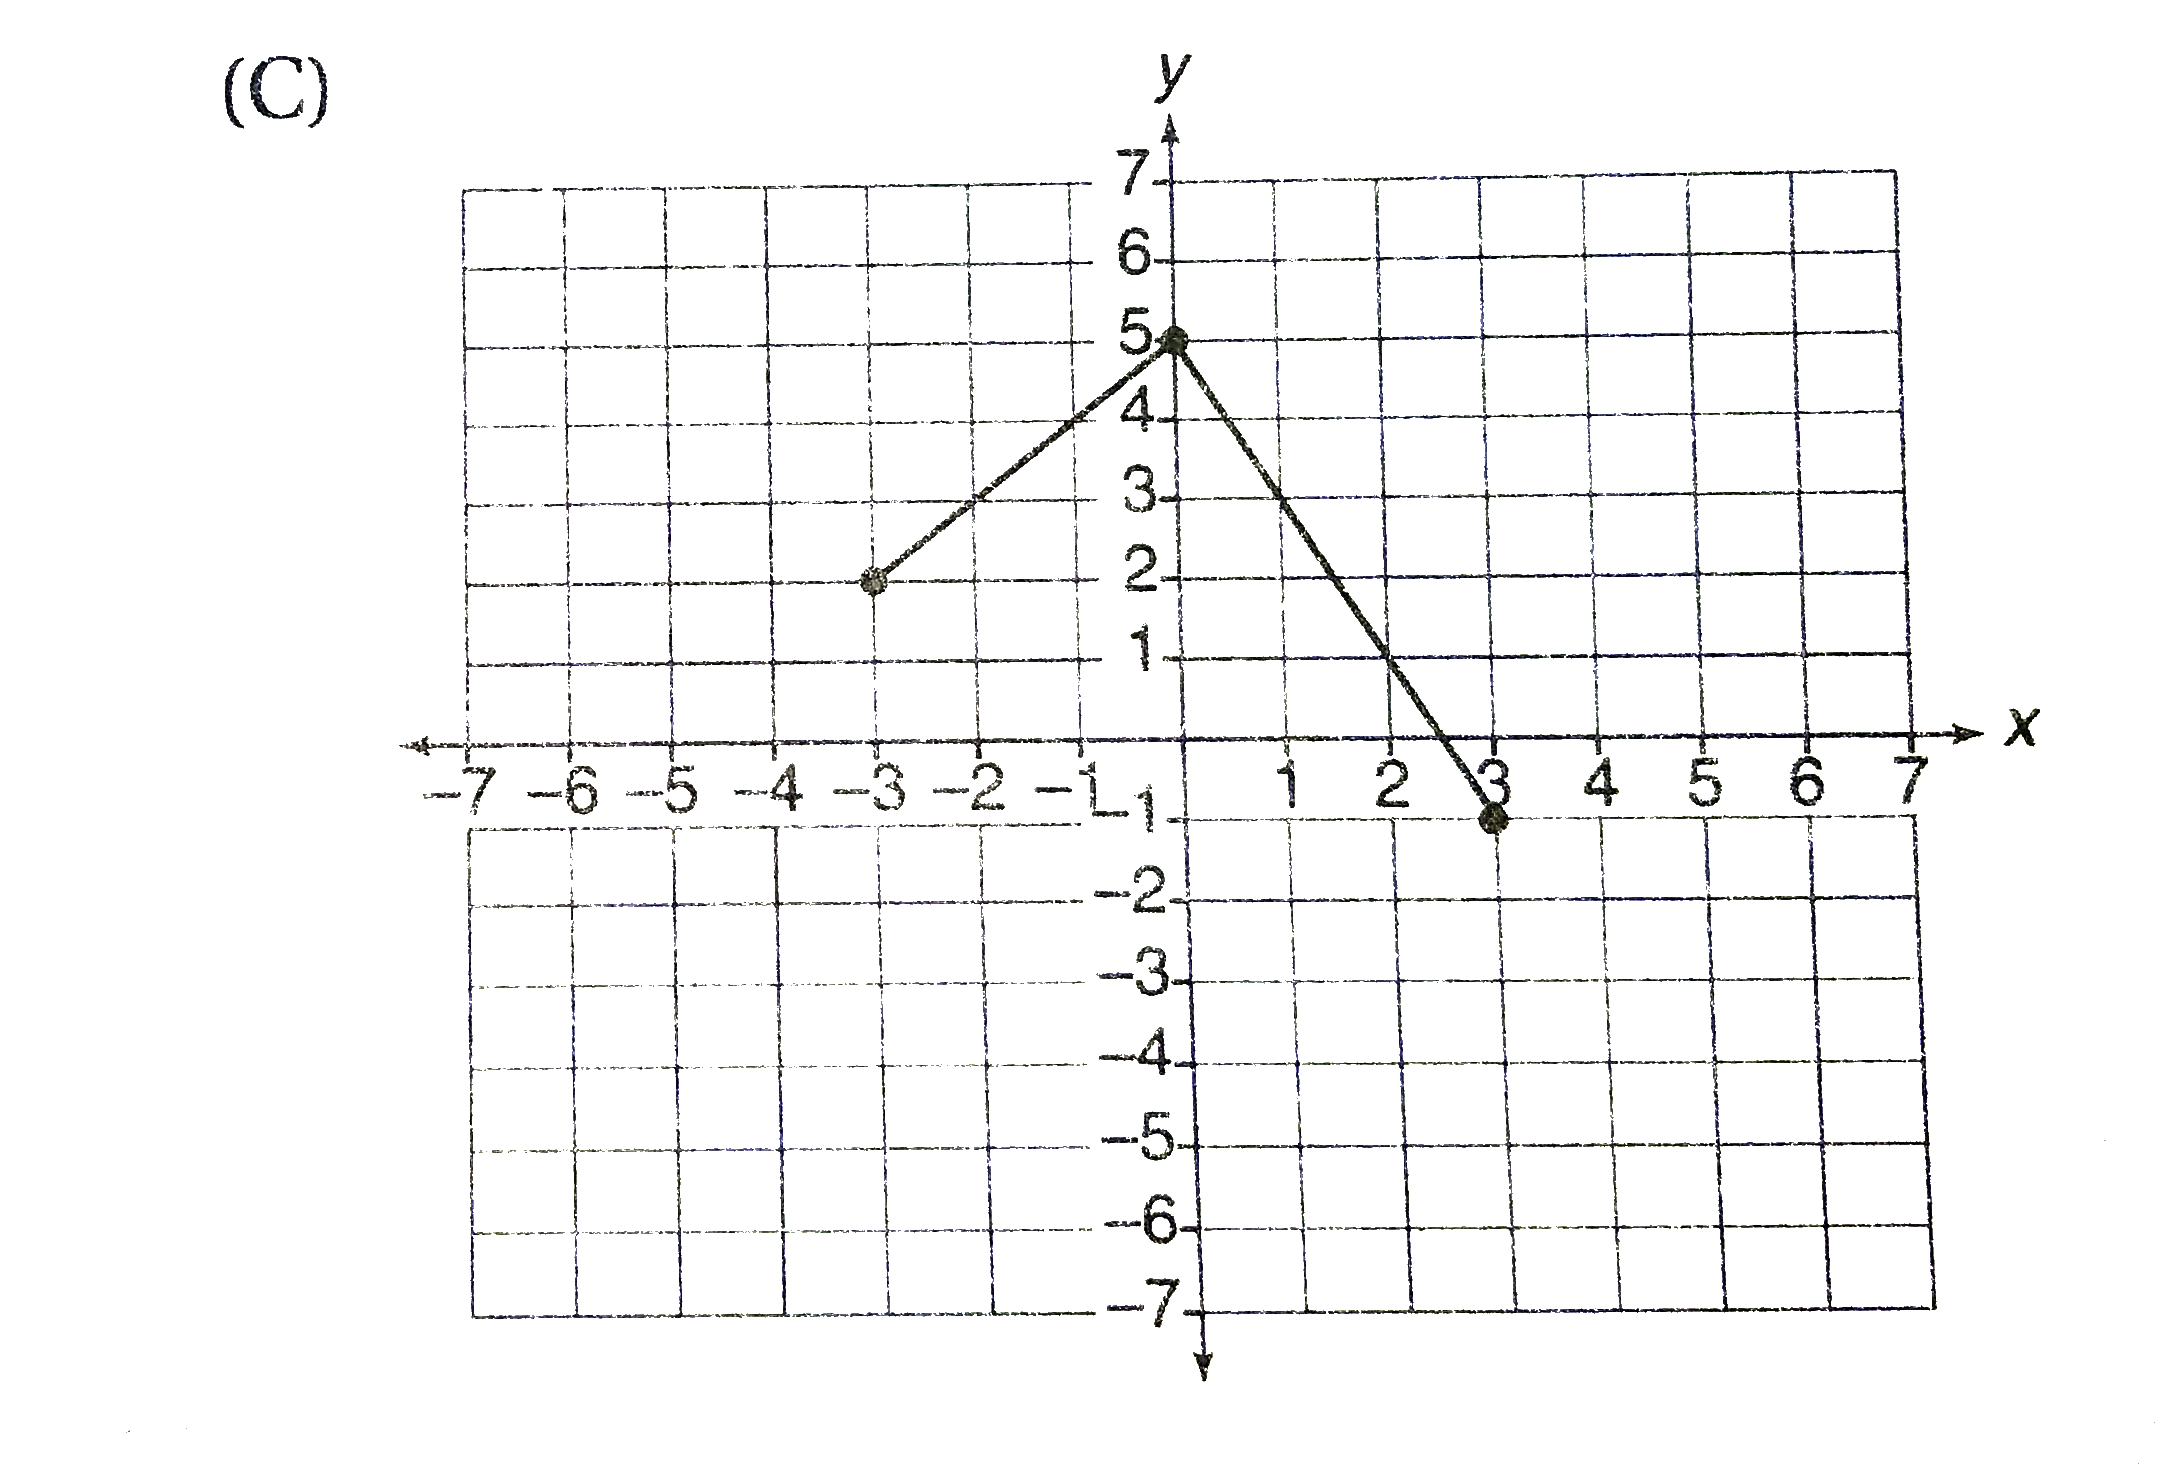 D
D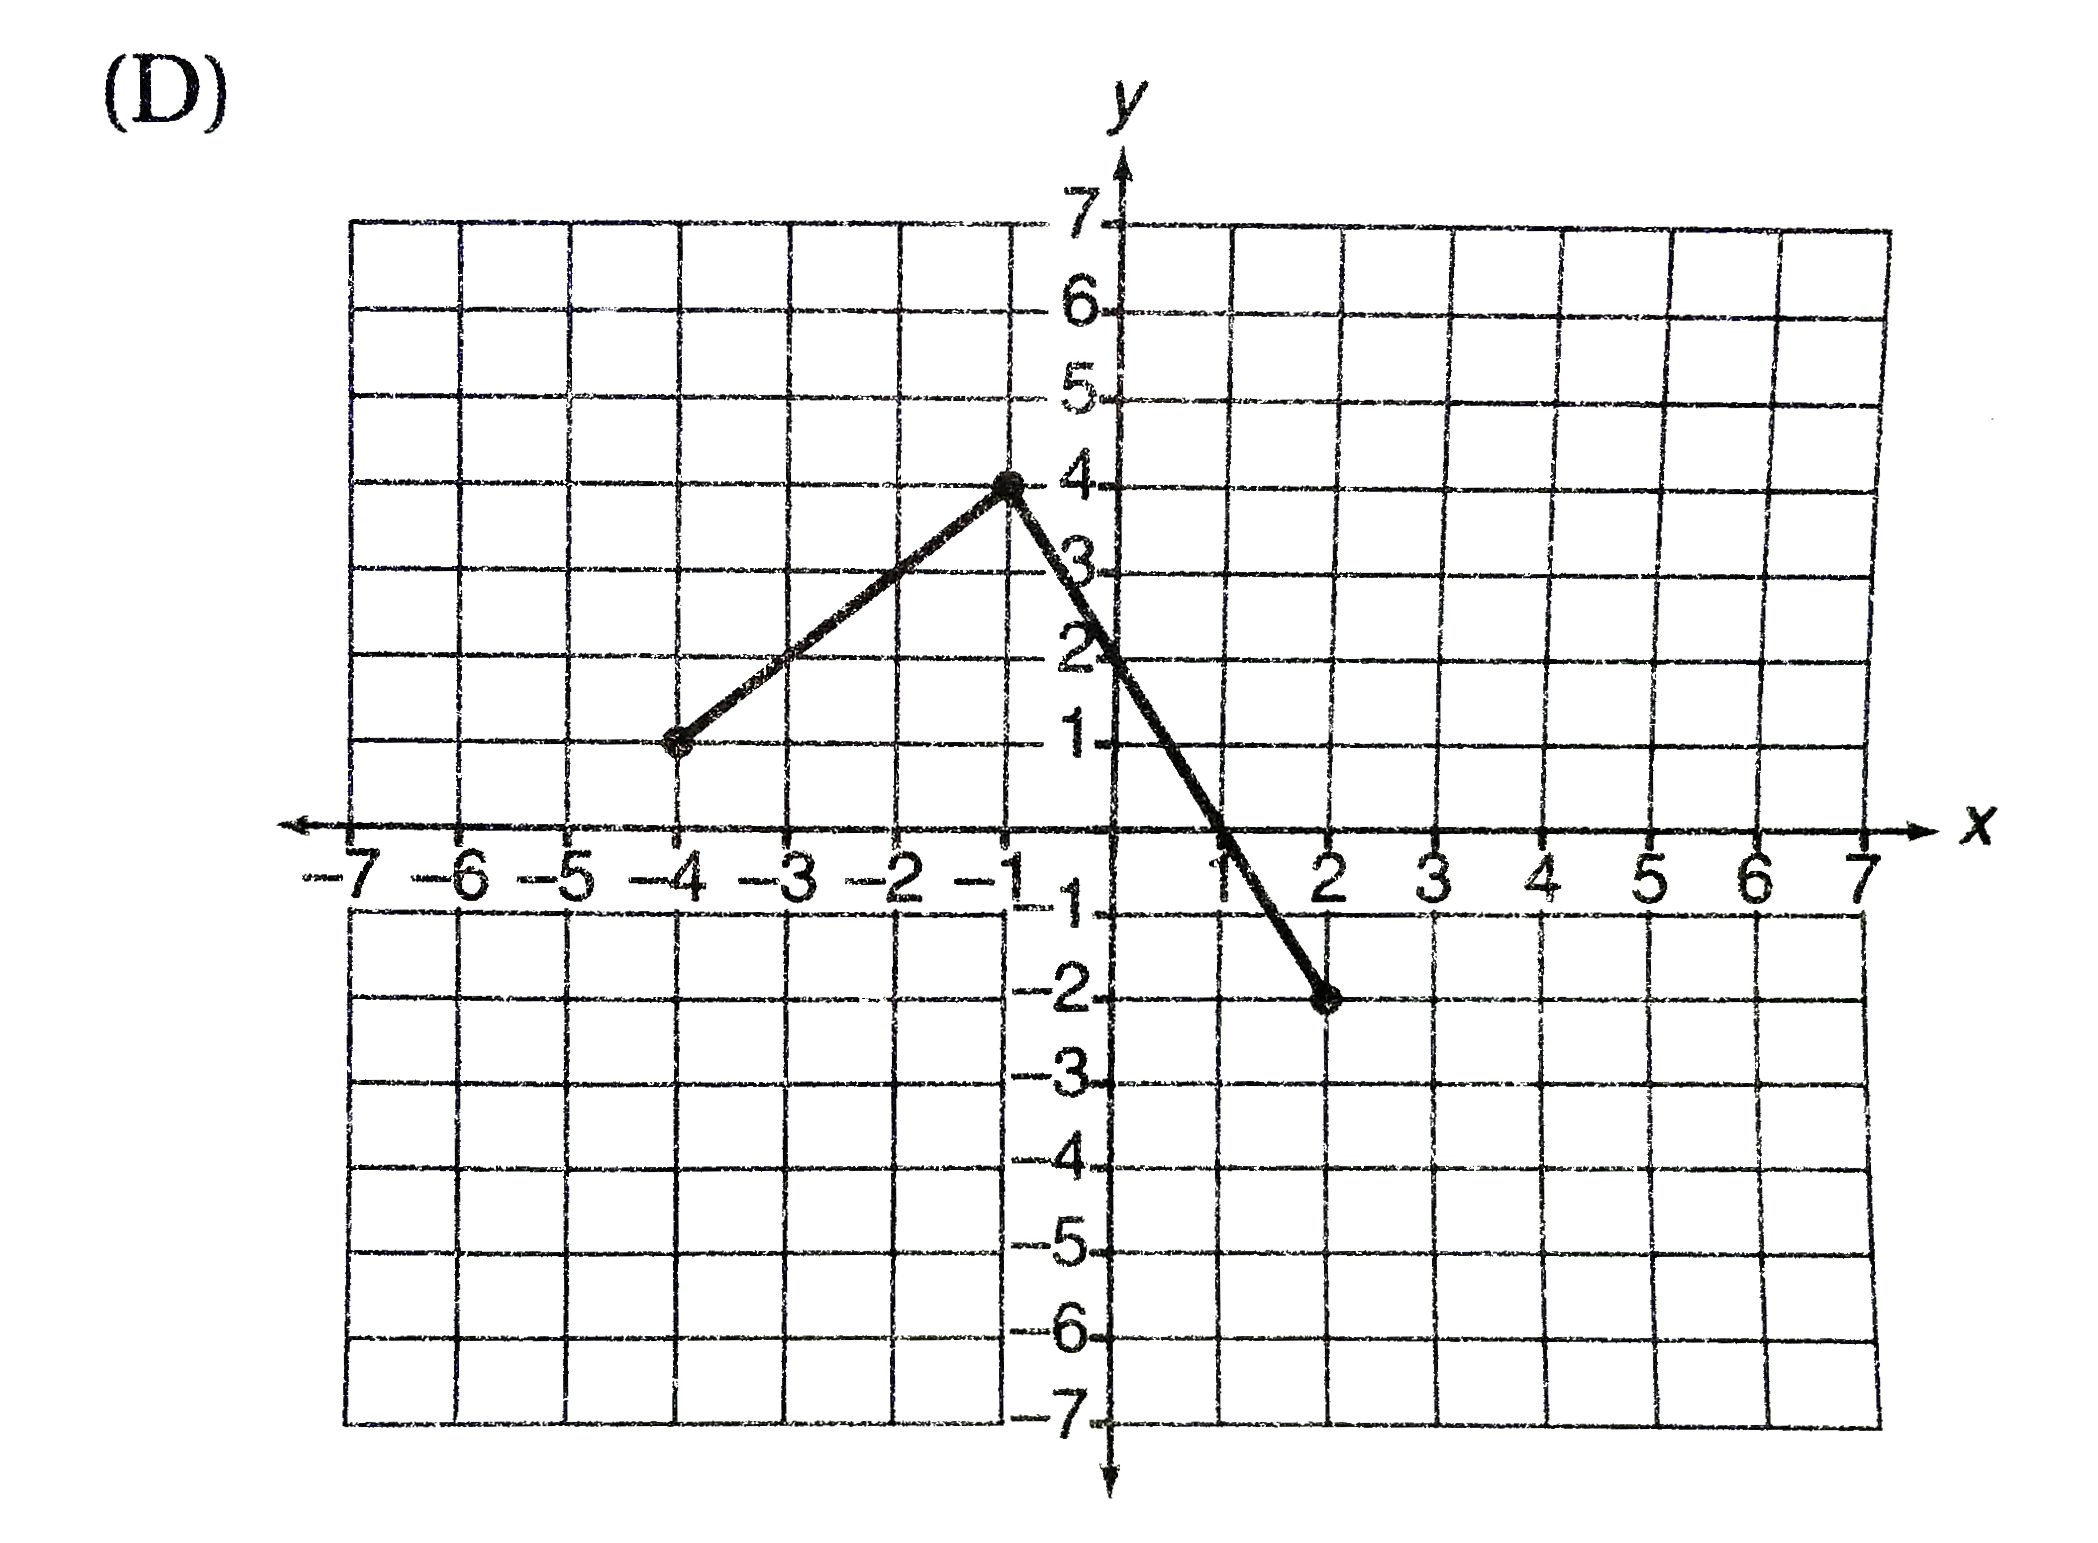
- Question 2 - Select One
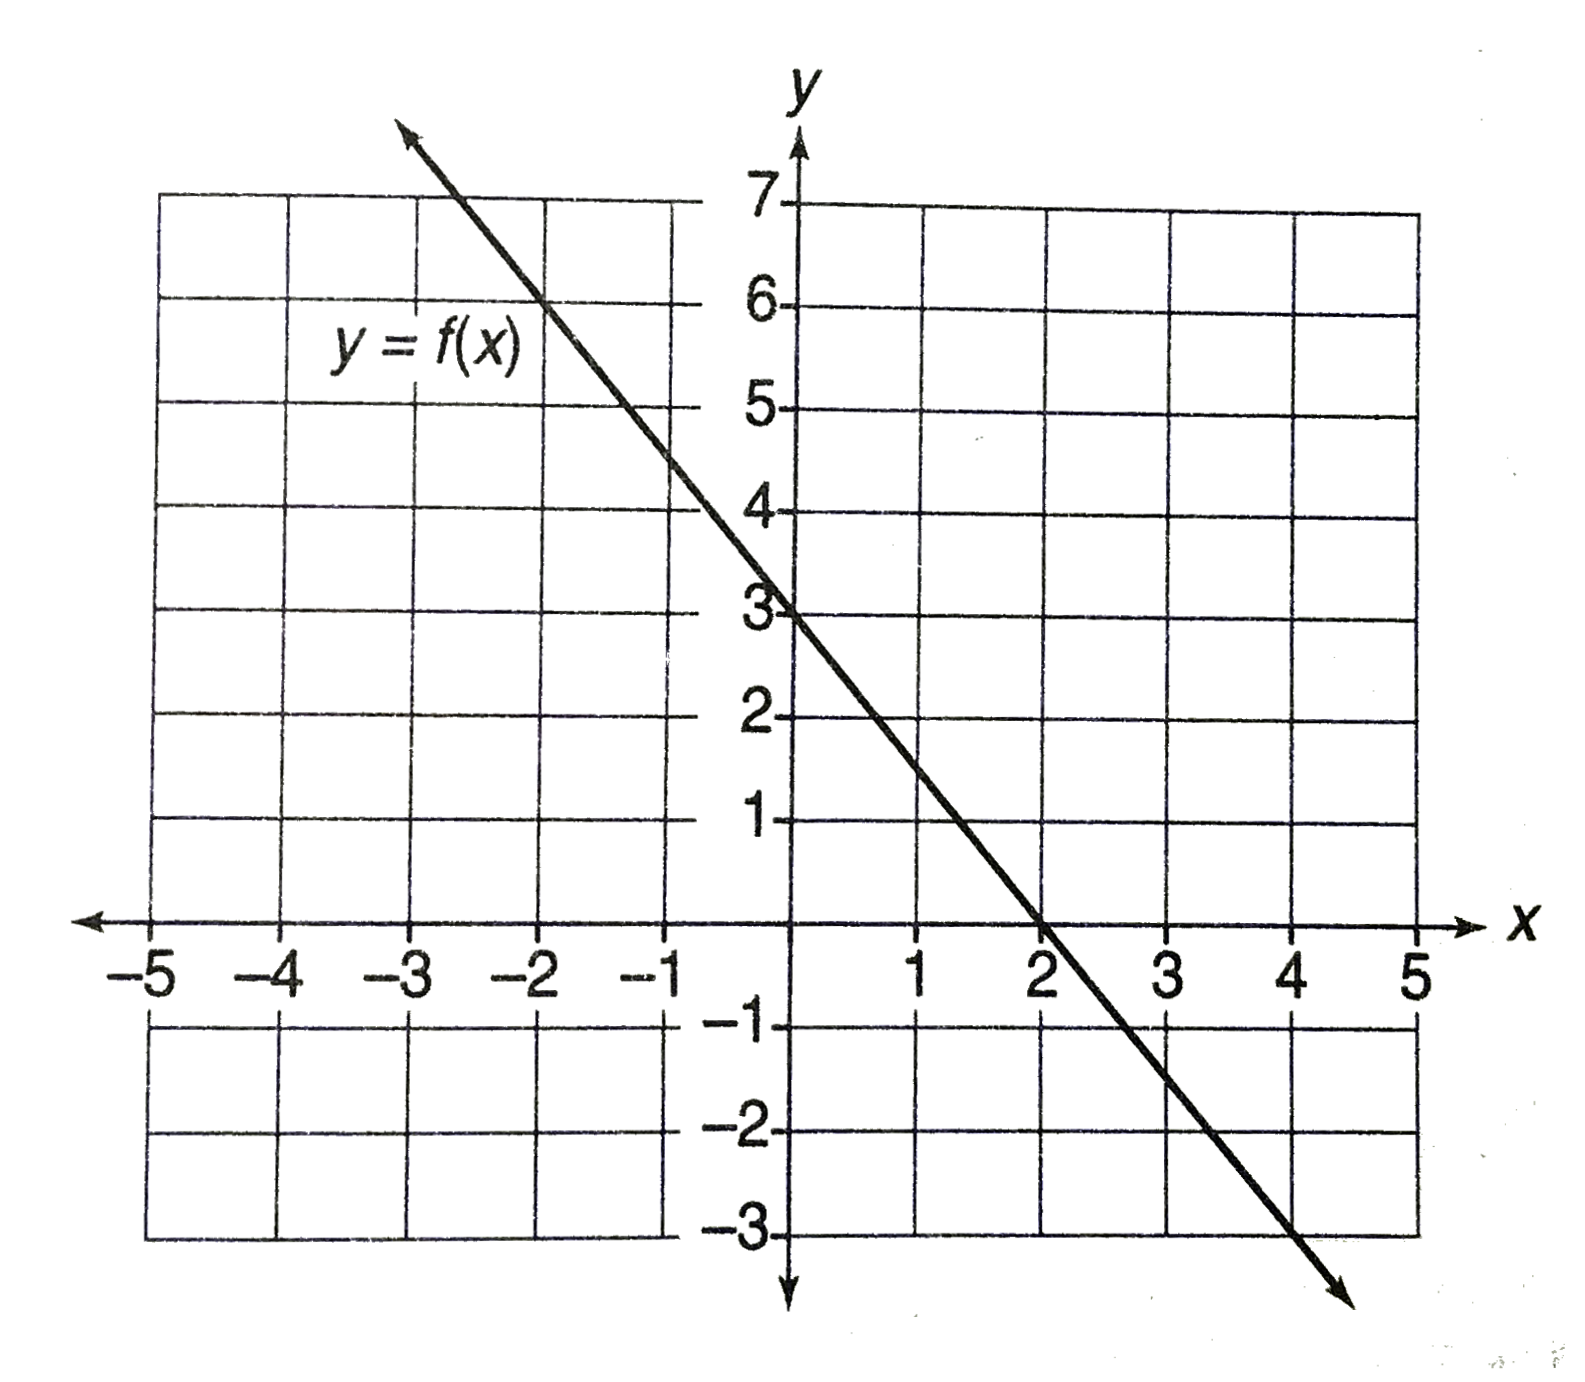
A linear function f is shown in the accompanying figure. If function g in the reflection of function f in the x-axis (not shown), what is the slope of the graph of function g?A−32B−23C23D32 - Question 3 - Select One
The point (2,−1) on the graph y=f(x) is shifted to which point on the graph of y=f(x+2)?
A(4,1)B(4,−1)C(0,−1)D(0,−3)
Given the graph of the function y=f(x), draw the graph of y=sgn(x).
 View Solution
Draw the graph of the function f(x)=|x−1|
View SolutionGiven the graph of y=f(x), which of the following is graph of y=f(1−x)
View SolutionThe function f is defined by f(x)=⎧⎪⎨⎪⎩1−x x<01 x=0x+1 x>0⎫⎪⎬⎪⎭. Draw the graph of f(x).
View SolutionThe figure above shows the graph of function h. If function f is defined by f(x)=h(2x)+1, what is the value of f(−1)?
View Solution

