
The histogram above shows the result of a survey taken of 25 individuals who were polled about how many weeks of vacation per year they receive. Which of the following is closest to the average (arithmetic mean) number of weeks of vacation per individual?
2
3
4
5
The correct Answer is:C
Step by step video, text & image solution for The histogram above shows the result of a survey taken of 25 individuals who were polled about how many weeks of vacation per year they receive. Which of the following is closest to the average (arithmetic mean) number of weeks of vacation per individual? by Maths experts to help you in doubts & scoring excellent marks in Class 12 exams.
Topper's Solved these Questions
Similar Questions
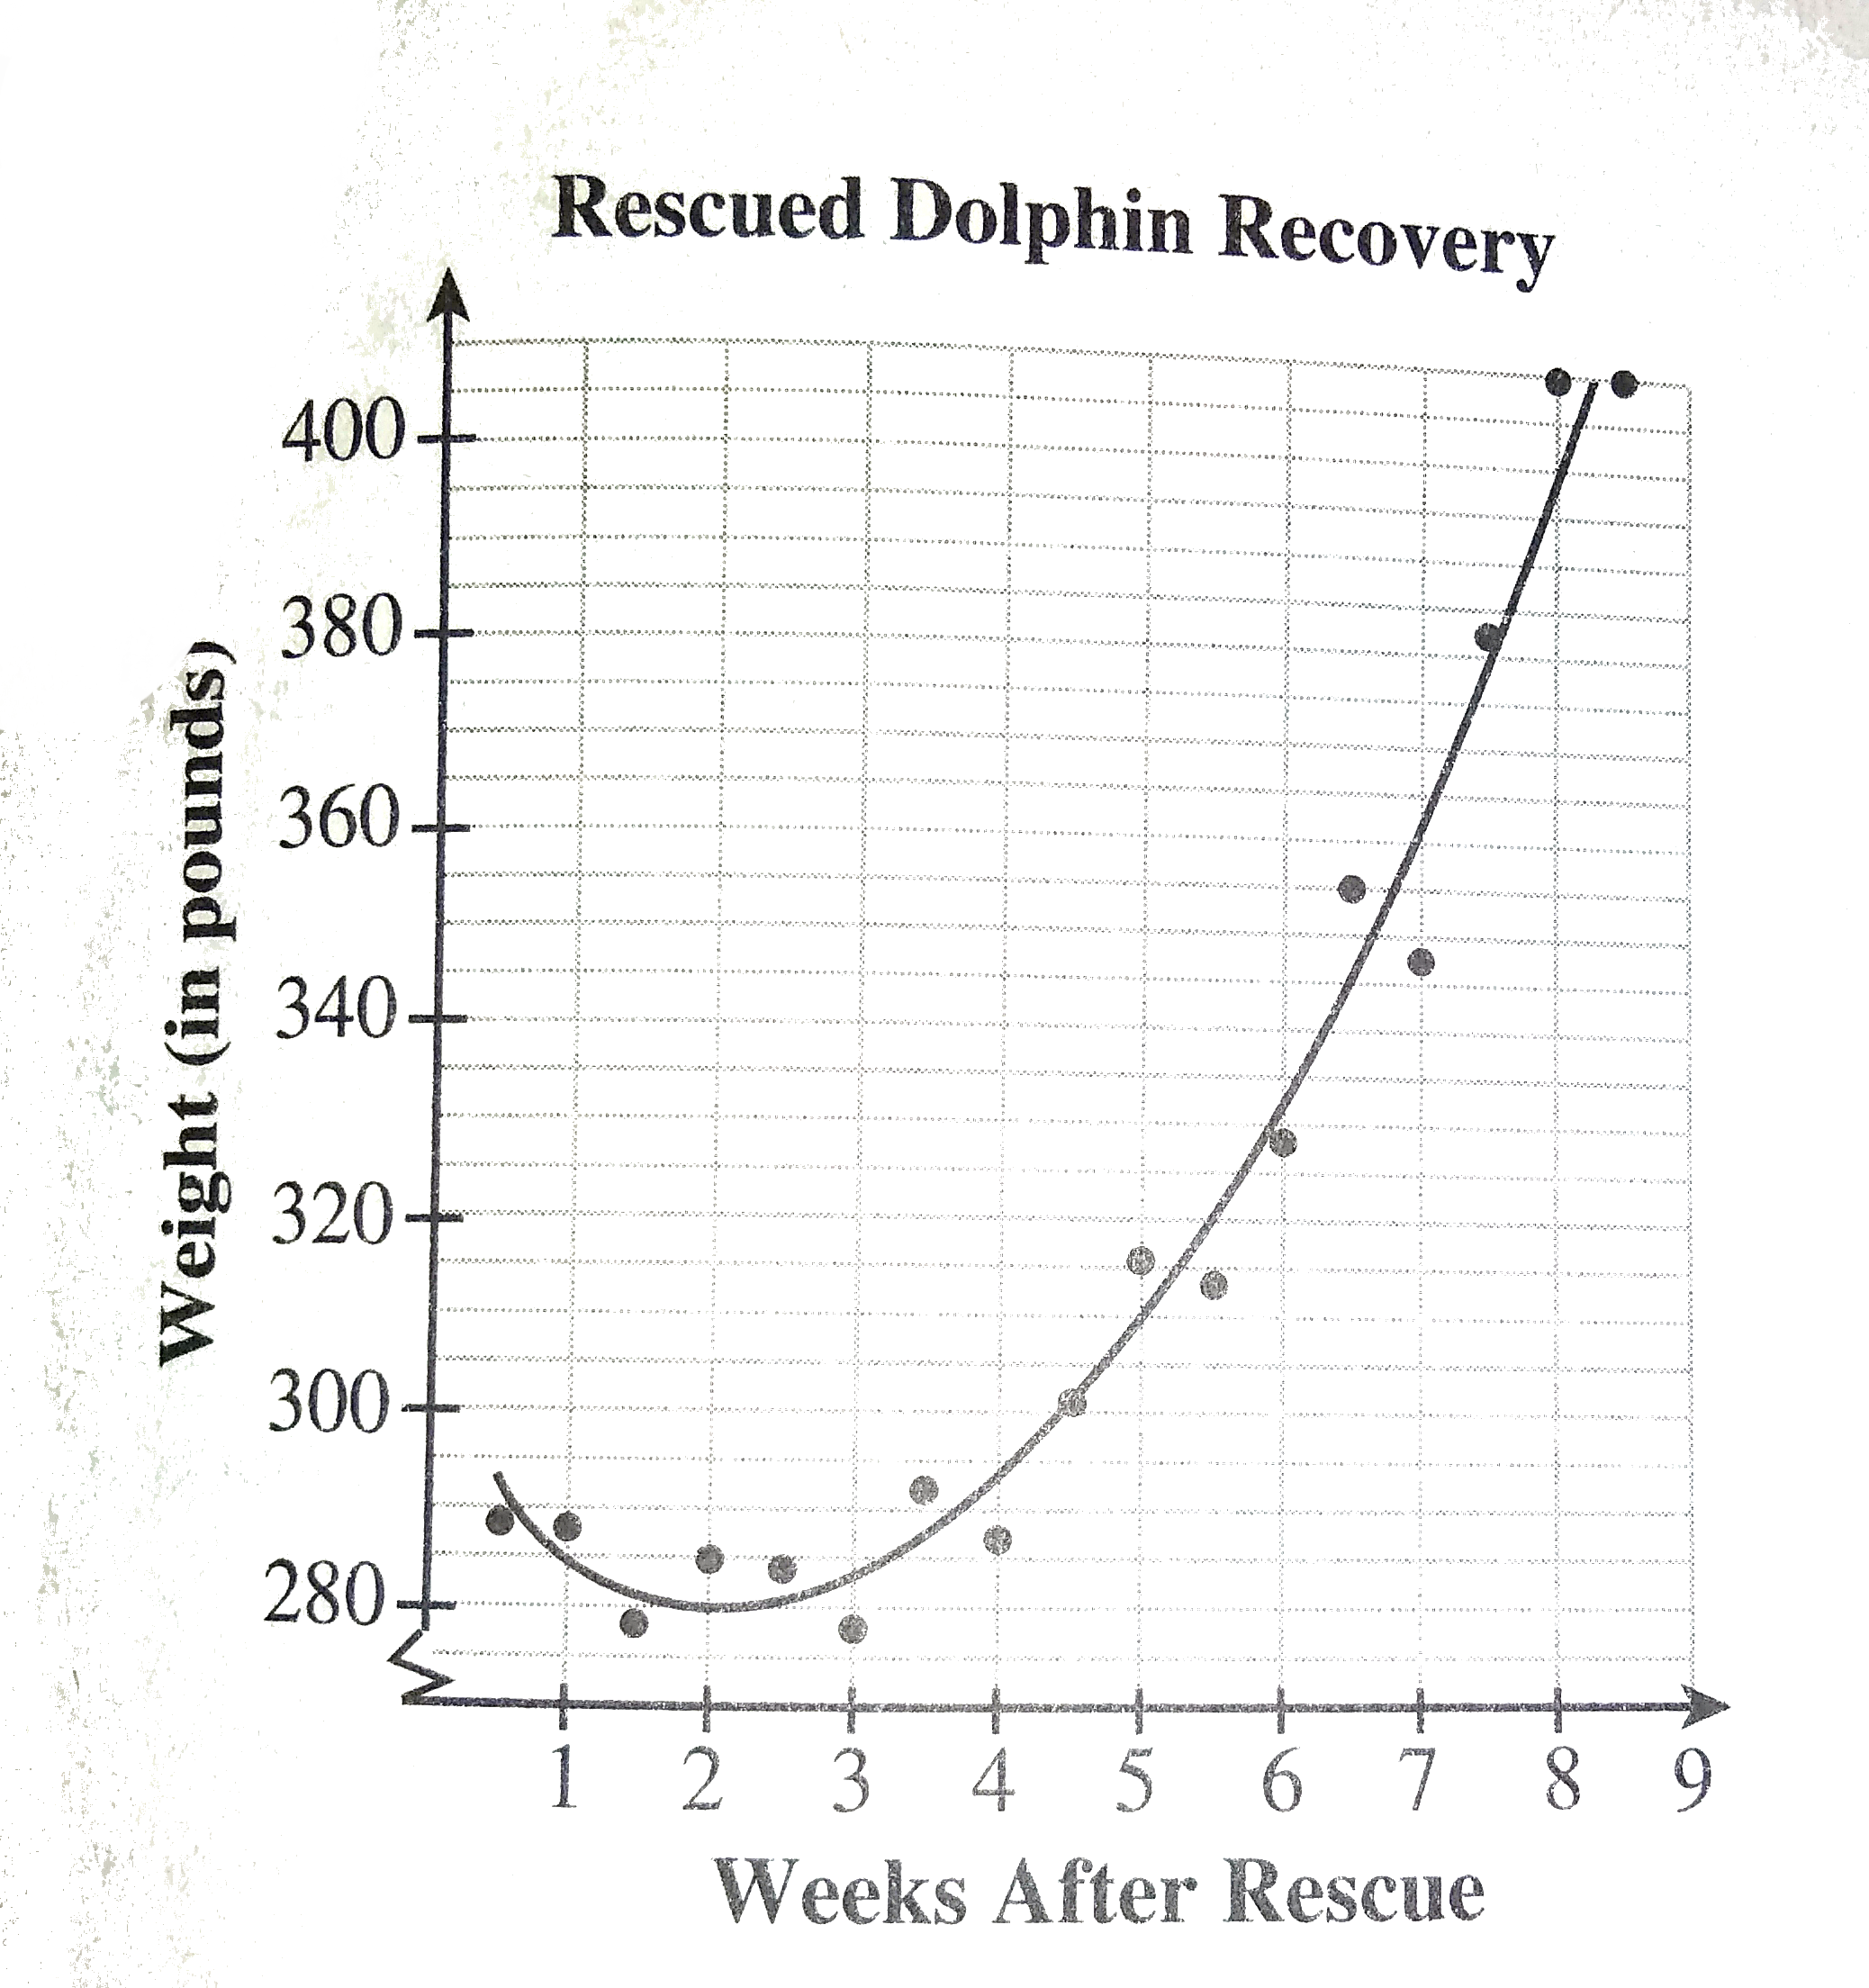
Following the catastrophic oil spill in the Gulf of Mexico in April of 2010, more than 900 bottlenose dolphins were found dead or stranard in the oil spill area. The figure above shows the weight of a recued dolphin during its recovery. Based on the quadratic model fit to the data shown, which of the following is the closest to the average rate of change in the dolphin's weight between week 2 and week 8 of its recovery?View Solution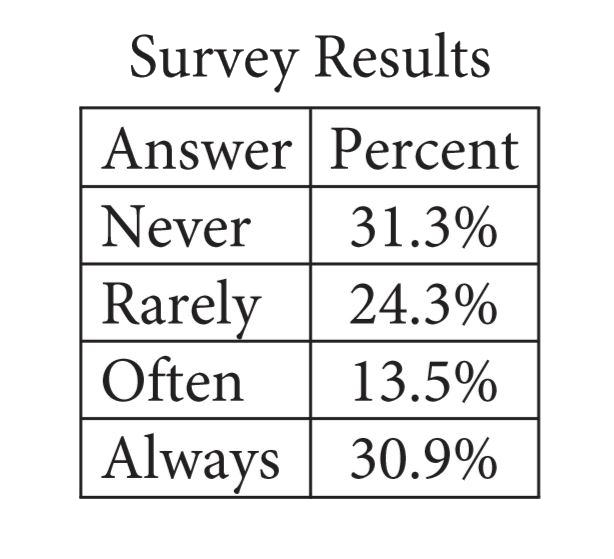
The table above shows the results of a survey in which tablet users were asked how often they would watch video advertisements in order to access streaming content for free. Based on the table, which of the following is closest to the probability that a tablet user answered “Always,” given that the tablet user did not answer “Never”?View Solution
Knowledge Check
- Question 1 - Select One
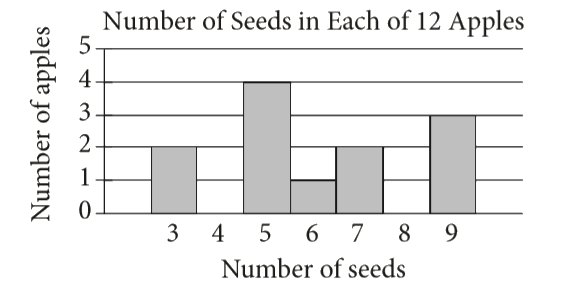
Based on the histogram above, of the following, which is closest to the average (arithmetic mean) number of seeds per apple?A4B5C6D7 - Question 2 - Select One
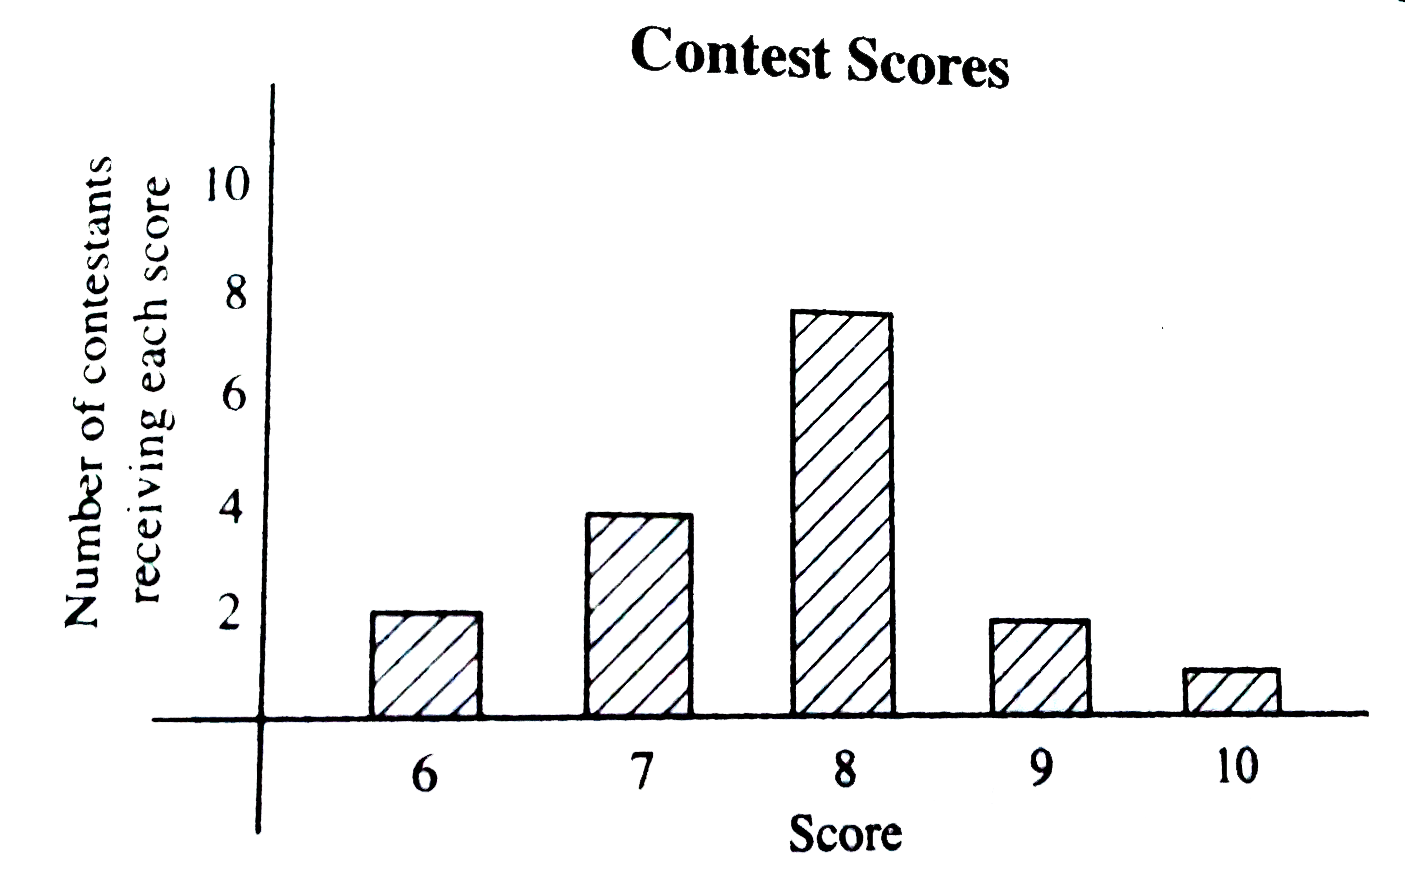
In a contest , each contestant could receive a score of 6,7,8,9, or 10. The bar graph above shows how many contestants received each score .
The score of 8 is described by which of the following measures ?
I.The average (arithmetic mean )
II.The median
III.The modeAI onlyBII onlyCIII onlyDII and III only - Question 3 - Select One
Ten 25- year - old men were asked how many hours per week they exercise and their resting heart rate was taken in beats per minute (BPM). The results are shown as points in the scatterplot below, and the line of best fit is drawn.
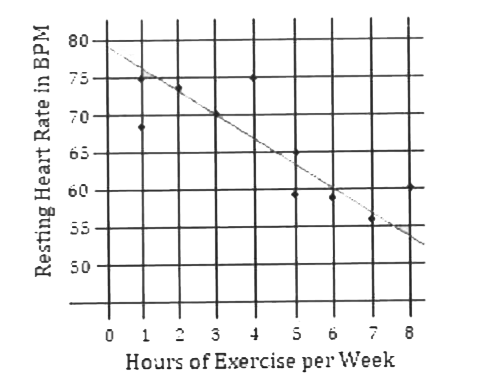
Which of the following is the best interpretation of the slope of the line of best fit in the context of this problem?AThe predicted number of hours that a person must exercise to maintain a resting heat rate of 50 BPM.BThe predicted resting heat rate of a person that does not exercise.CThe predicted decrease in resting heart rate, in BPM, for each one - hour increase in weekly exercise.DThe predicted increase in the number of hours of exercise needed to increase the resting heart rate by one BPM.
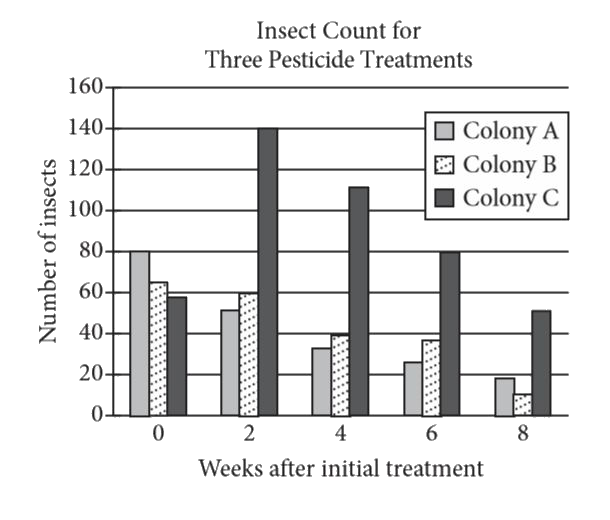
Three colonies of insects were each treated with a different pesticide over an 8-week period to test the effectiveness of the three pesticides. Colonies A, B, and C were treated with Pesticides A, B, and C, respectively. Each pesticide was applied every 2 weeks to one of the three colonies over the 8-week period. The bar graph above shows the insect counts for each of the three colonies 0, 2, 4, 6, and 8 weeks after the initial treatment.
Of the following, which is closest to the ratio of the total number of insects in all three colonies in week 8 to the total number of insects at the time of initial treatment?View Solution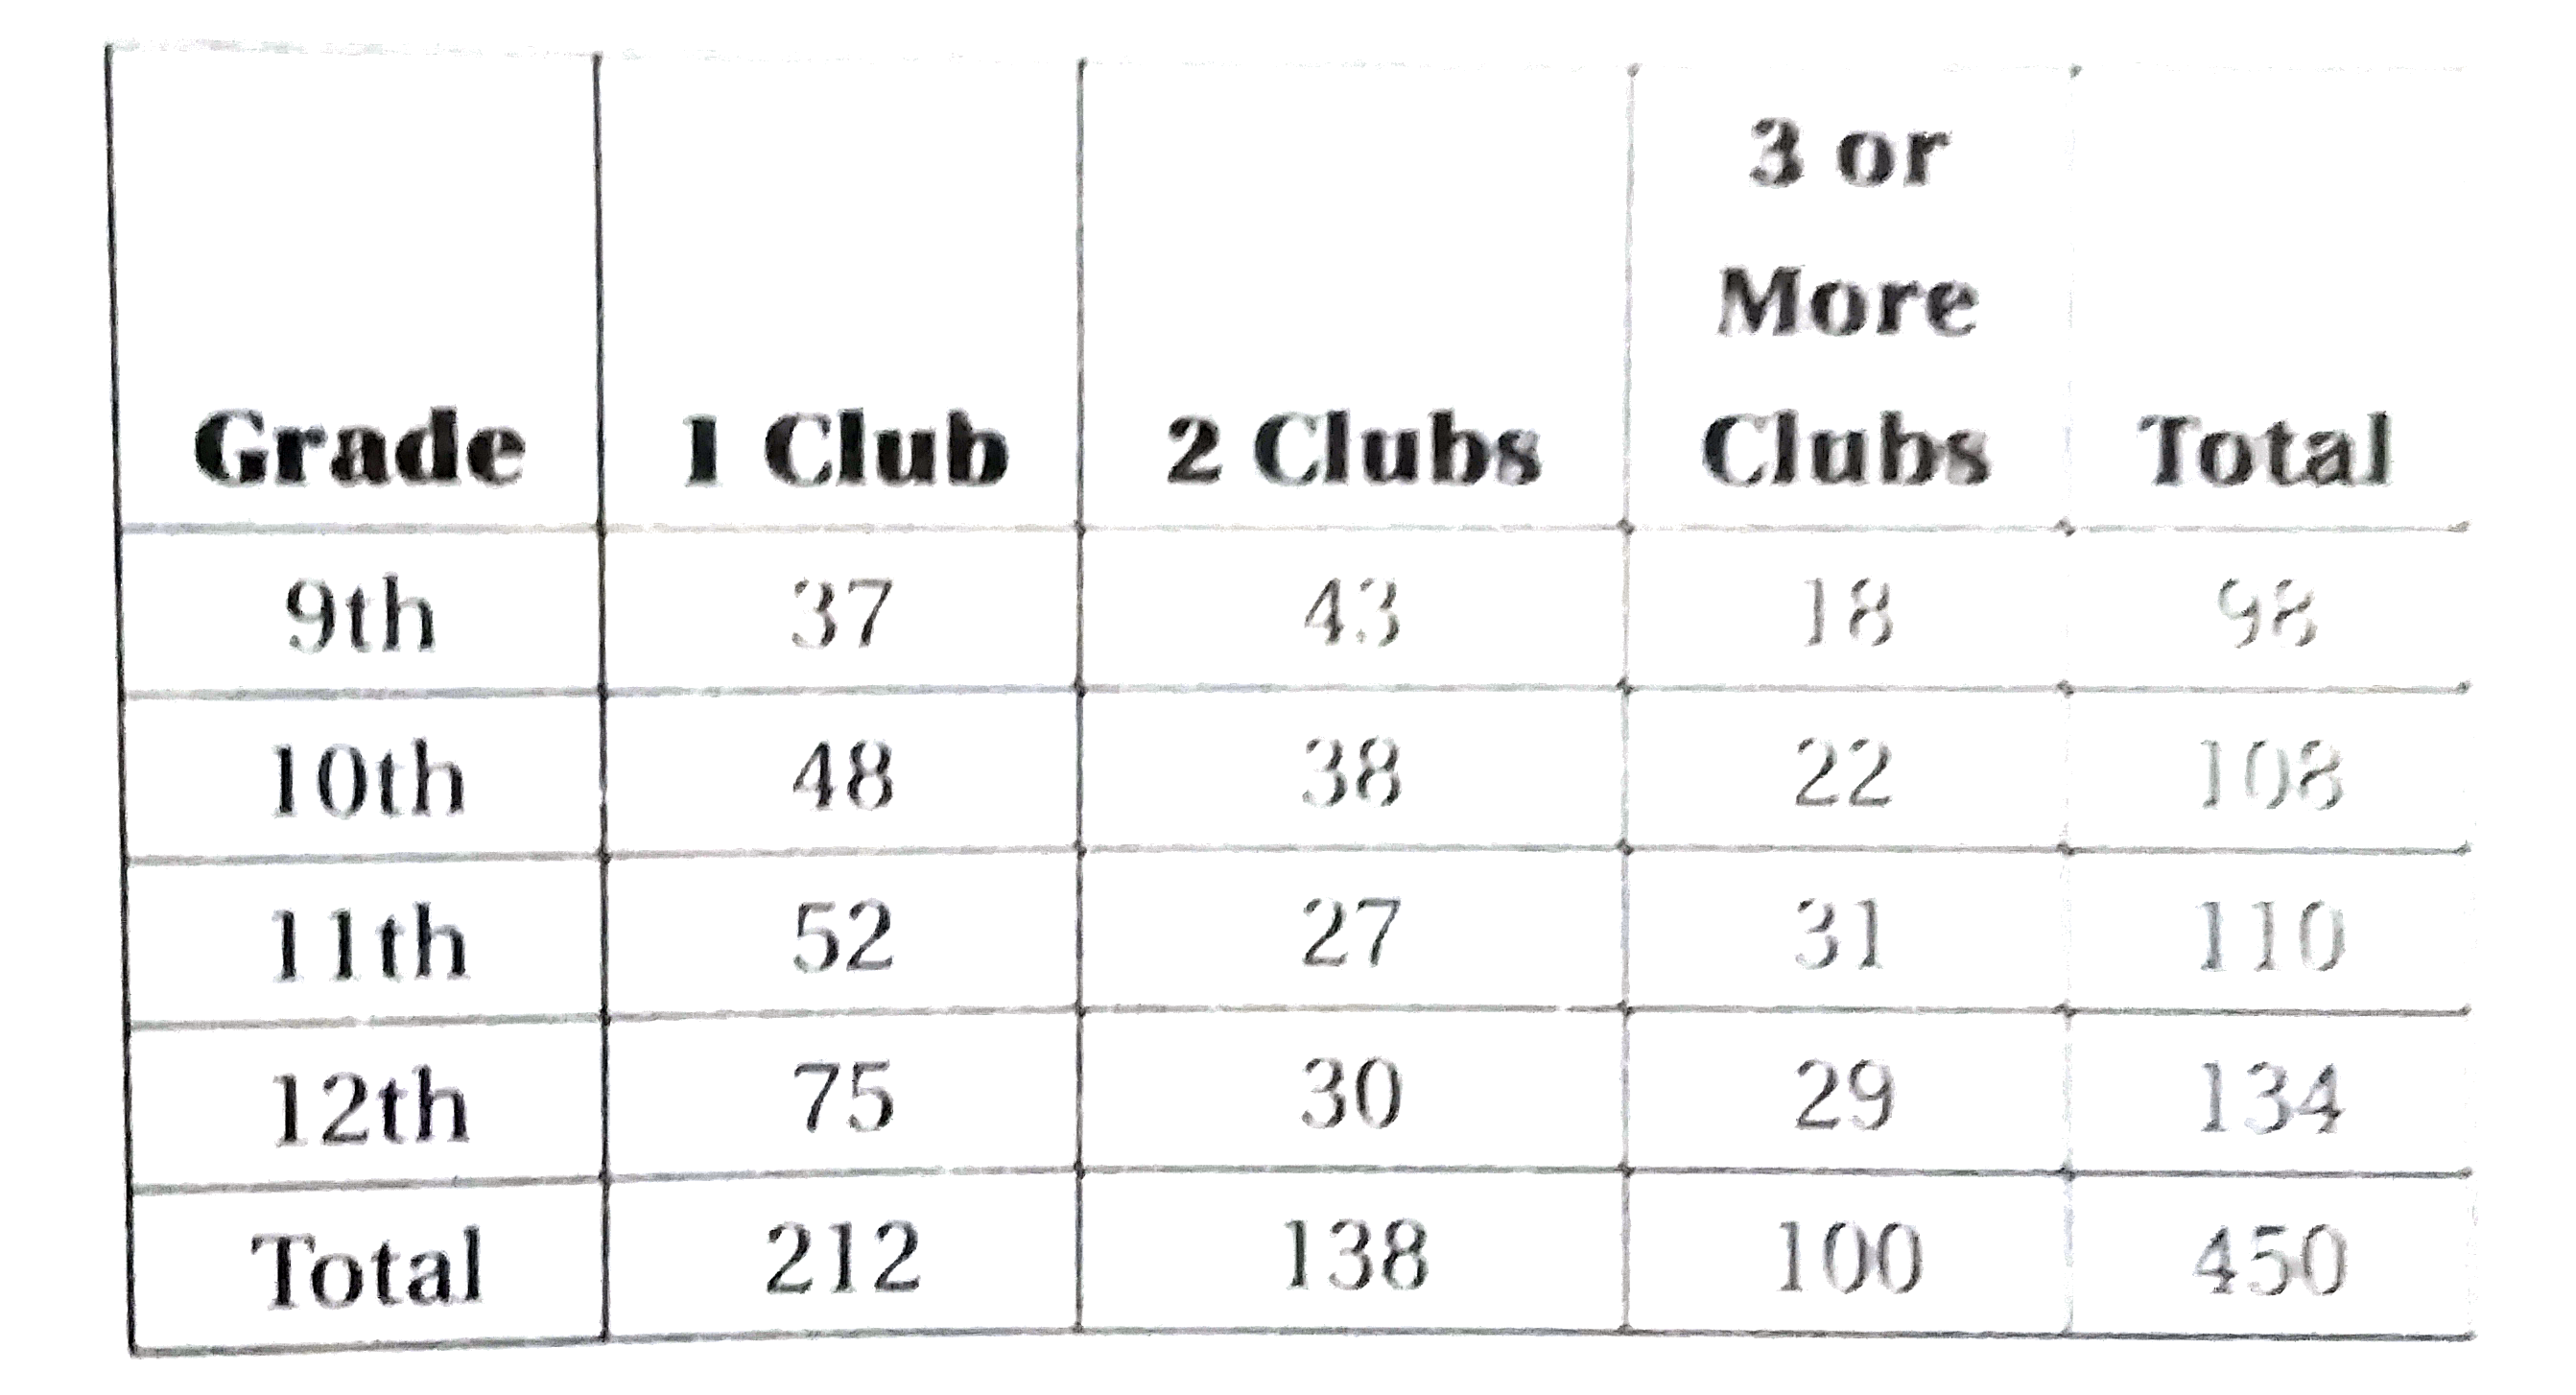
Question 4-6 refer to the above table, which summarizes the result of a survey of the student body of a high school about club membership in which each student enrolled in the high school enumerated the clubs in which they were members.
Q. If 28% of the students who are enrolled in this school belong to at least two clubs, how many students who are enrolled in this school did not participate in the survey?View SolutionFollowing table shows the points of each player scored in four games:Now answer the following questions:(i) Find the mean to determine A’s average number of points scored per game.(ii) To find the mean number of points per game for C, would you divide the totalpoints by 3 or by 4? Why?(iii) B played in all the four games. How would you find the mean?(iv) Who is the best performer?
View Solution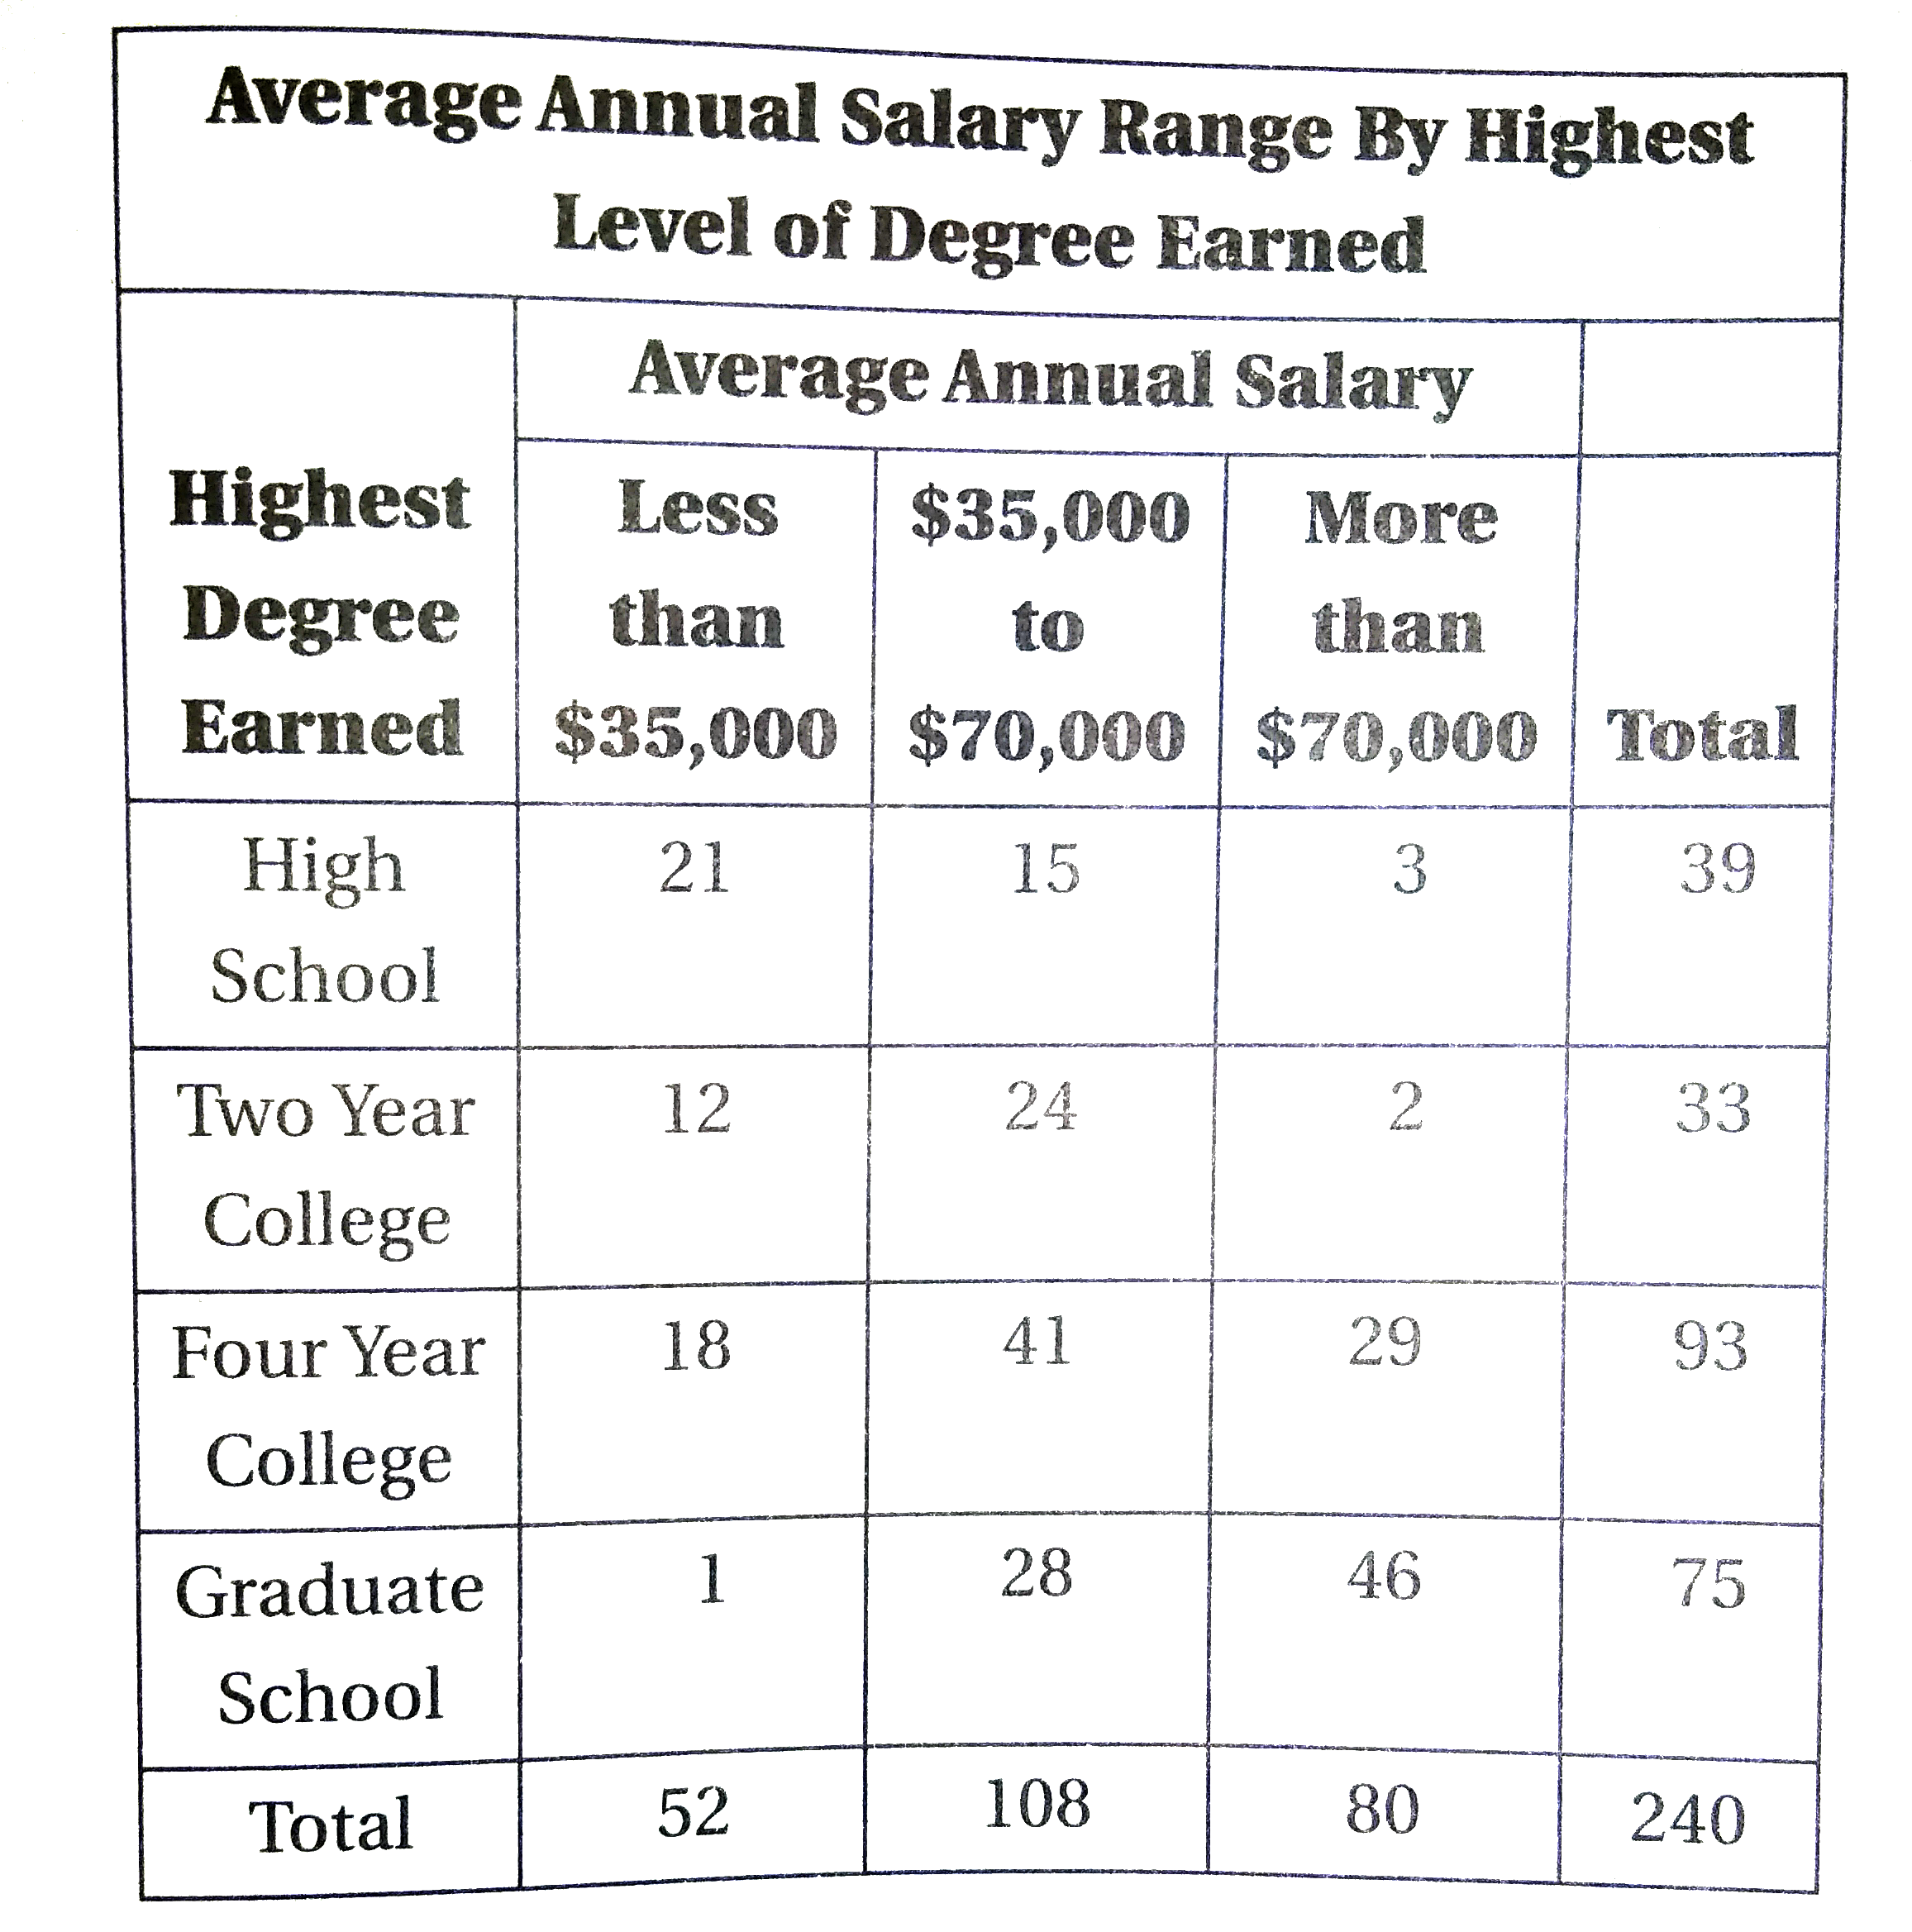
The table above summarizes the result of a survey taken in which 240 adults were asked about their education level and current annual salary. If a participant who reported earning $35,000 or more per year is selected at random, what is the best estimate of the probability that the person does not have a graduate school degreee?View SolutionStudent in a finance class surveyed 20 percent of the account holders at Docven Bank to determine whether the bank's "Stock Market Special" savings account actually paid account holders the promised 10 percent annual interest rate. The scatterplot above shows the data the students collected from account holders about how long ago they opened their accounts and their current balances. The students calculated a lone of best fit with the equation y=120(1+.0812)12x, whihc means that the bank was actually paying account holders only an 8 percent annual interest rate. Which of the following best explains how the number 120 in the equation relates to the scatterplot?
View Solution

