The following data shows the agriculture production in India during a certain year.| Food grain | Rice, Wheat Pulses Maize Coarse Cereals Production 106, 74, 24, 4, 20| (in millions of tons)Draw a pie chart to represent the above data.
Step by step video & image solution for The following data shows the agriculture production in India during a certain year.| Food grain | Rice, Wheat Pulses Maize Coarse Cereals Production 106, 74, 24, 4, 20| (in millions of tons)Draw a pie chart to represent the above data. by Maths experts to help you in doubts & scoring excellent marks in Class 8 exams.
Updated on:21/07/2023Similar Questions
The following data shows the agriculture production in India during a certain year.| Food grain | Rice, Wheat Pulses Maize Coarse Cereals Production 106, 74, 24, 4, 20| (in millions of tons)Draw a pie chart to represent the above data.
View SolutionThe following data shows the average age of men in varicus countries in a certain year: Country, India, Nepal, China, Pakistan, U.K., U.S.A Average age (in years), 55, 52, 60, 50, 70, 75 Represent the above information by a bar graph.
View Solution
Knowledge Check
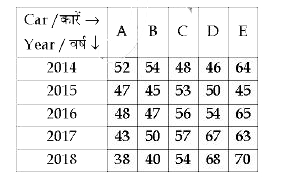
The table shows the production of different types of cars by a company in 5 years.

If the data related to the production of cars in 2018 is represented by pie chart, then the central angle of the sector representing the production of type c cars will be:A72∘B59∘C93∘D91∘
The following data shows the average age of men in varicus countries in a certain year: Country, India, Nepal, China, Pakistan, U.K., U.S.A Average age (in years), 55, 52, 60, 50, 70, 75 Represent the above information by a bar graph.
View SolutionThe following data gives the production of food grains (in thousand tonnes) for some years: Year 1995 1996 1997 1998 1999 2000 Production (in thousand tonnes) 120 150 140 180 170 190 Represent the above data with the help of a bar graph.
View SolutionThe following data gives the production of food grains (in thousand tonnes) for some years: Year 1995 1996 1997 1998 1999 2000 Production (in thousand tonnes) 120 150 140 180 170 190 Represent the above data with the help of a bar graph.
View SolutionThe following data gives the production of food grains (in thousand tonnes) for some years: Year 1995 1996 1997 1998 1999 2000 Production (in thousand tonnes) 120 150 140 180 170 190 Represent the above data with the help of a bar graph.
View SolutionThe following data gives the amount of manure (in thousand tonnes) manufactured by a company during some years: Year 1992 1993 1994 1995 1996 1997 Production (in Thousand tonnes) 15 35 45 30 40 20 Represent the above data with the help of a bar graph. Indicate with the help of the bar graph the year in which the amount of manufactured by the company was maximum. Choose the correct alternative: The consecutive years during which there was maximum decrease in manure production are: 1994 and 1995 (b) 1992 and 1993 1996 and 1997 (d) 1995 and 1996
View SolutionThe following data gives the amount of manure (in thousand tonnes) manufactured by a company during some years: Year, 1992, 1993, 1994, 1995, 1996, 1997 Manure (In thousand tonnes), 15, 35, 45, 30, 40, 20 Represent the above data with the help of a bar graph. Indicate with the help of the bar graph the year in which the amount of manure manufactured by the company was maximum. Choose the correct alternative: The consecutive years during which there was maximum decrease in manure production are: 1994 to 1995 (b) 1992 and 1993 1996-1997 (d) 1995 and 1996
View SolutionThe following data gives the amount of manure (in thousand tonnes) manufactured by a company during some years: Year, 1992, 1993, 1994, 1995, 1996, 1997 Manure (In thousand tonnes), 15, 35, 45, 30, 40, 20 Represent the above data with the help of a bar graph. Indicate with the help of the bar graph the year in which the amount of manure manufactured by the company was maximum. Choose the correct alternative: The consecutive years during which there was maximum decrease in manure production are: 1994 to 1995 (b) 1992 and 1993 1996-1997 (d) 1995 and 1996
View Solution
