. The following data shows the year wise strength of a school.Represent the the above data by bar graph:
Step by step video & image solution for . The following data shows the year wise strength of a school.Represent the the above data by bar graph: by Maths experts to help you in doubts & scoring excellent marks in Class 8 exams.
Updated on:21/07/2023Similar Questions
In the following table number of saplinted in the years 2016 and 2017 in four towns is given. Show the data with the help of subdivided bar graph.

View SolutionDraw a bar graph for the following data. Population of India in successive census years-

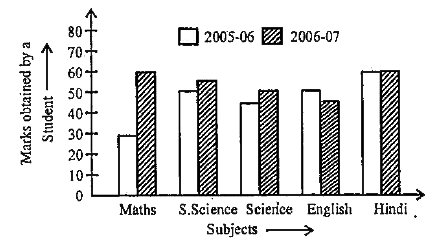
View SolutionDouble bar graph : Bar graph showing two groups of data together What information is given by this double bar graph?
View SolutionThe following table gives the data of number of schools (stage-wise) of a country in the year 2002. Draw a bar graph to represent the above data:
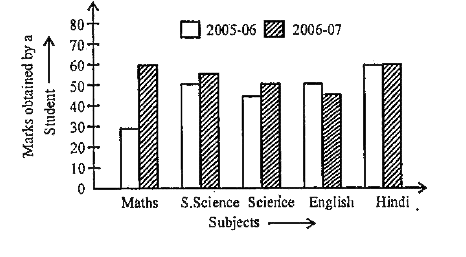
View SolutionDouble Bar Graph : A bar graph showing two sets of data simultaneously . It is useful for the comparison of the data.

What is the information given by the double bar graph ?
View SolutionDouble Bar Graph : A bar graph showing two sets of data simultaneously . It is useful for the comparison of the data.

In which cubject has the performance improve the most ?
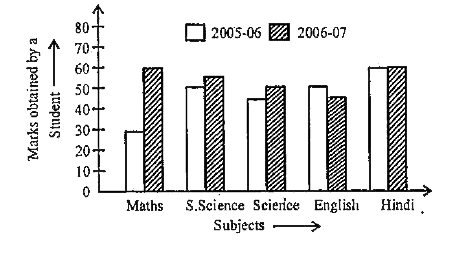
View SolutionDouble Bar Graph : A bar graph showing two sets of data simultaneously . It is useful for the comparison of the data.

In which subject has the performance deteriorated ?
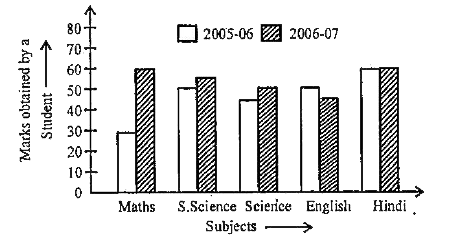
View SolutionDouble Bar Graph : A bar graph showing two sets of data simultaneously . It is useful for the comparison of the data.

In which subject is the performance at par ?
View Solution