For a photoelectric cell the graph showing the variation of cut of voltage (V0) with frequency (v) of incident light is best represented by


The correct Answer is:D
Topper's Solved these Questions
- ELECTRON,PHONTS,PHOTOELECTRIC EFFECT & X-RAYSBOOK - CENGAGE PHYSICSCHAPTER - ELECTRON,PHONTS,PHOTOELECTRIC EFFECT & X-RAYSEXERCISE - dpp 3.3
15 Videos
- ELECTRON,PHONTS,PHOTOELECTRIC EFFECT & X-RAYSBOOK - CENGAGE PHYSICSCHAPTER - ELECTRON,PHONTS,PHOTOELECTRIC EFFECT & X-RAYSEXERCISE - multiple correct
1 Videos
- ELECTROMAGNETIC INDUCTIONBOOK - CENGAGE PHYSICSCHAPTER - ELECTROMAGNETIC INDUCTIONEXERCISE - compression type
7 Videos
- Electrostatic Potential and CapacitanceBOOK - CENGAGE PHYSICSCHAPTER - Electrostatic Potential and CapacitanceEXERCISE - QUESTION BANK
23 Videos
Similar Questions
Knowledge Check
For a photoelectric cell the graph showing the variation of cut of voltage (V) with frequency (v) of incident light is best represented by
A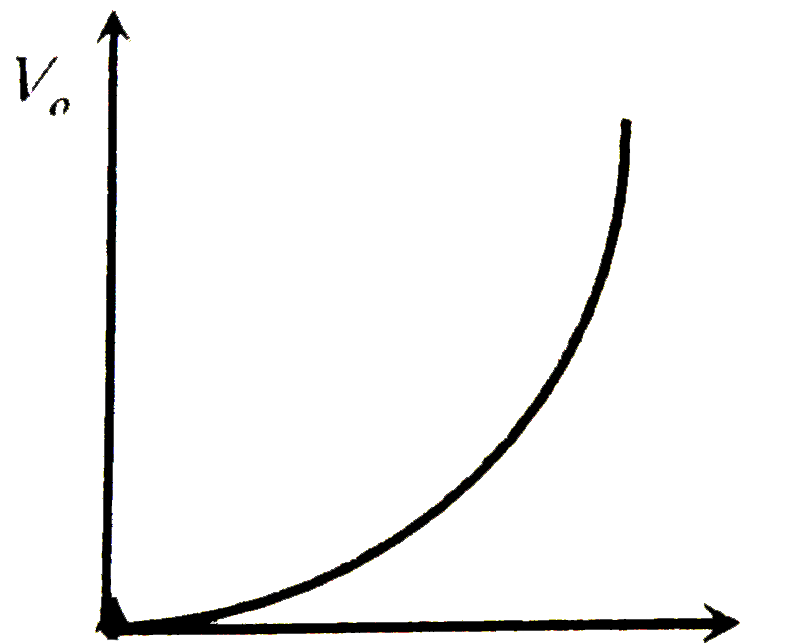 B
B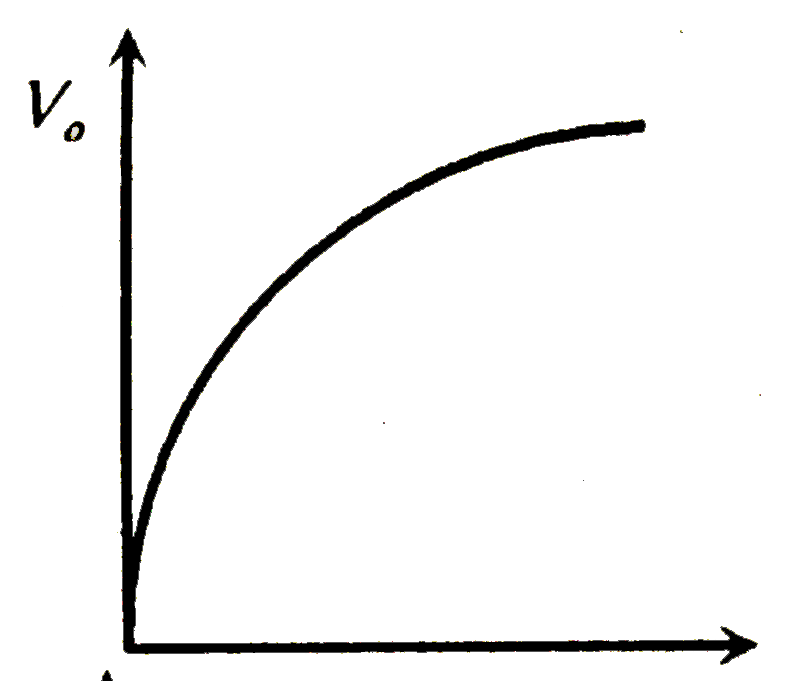 C
C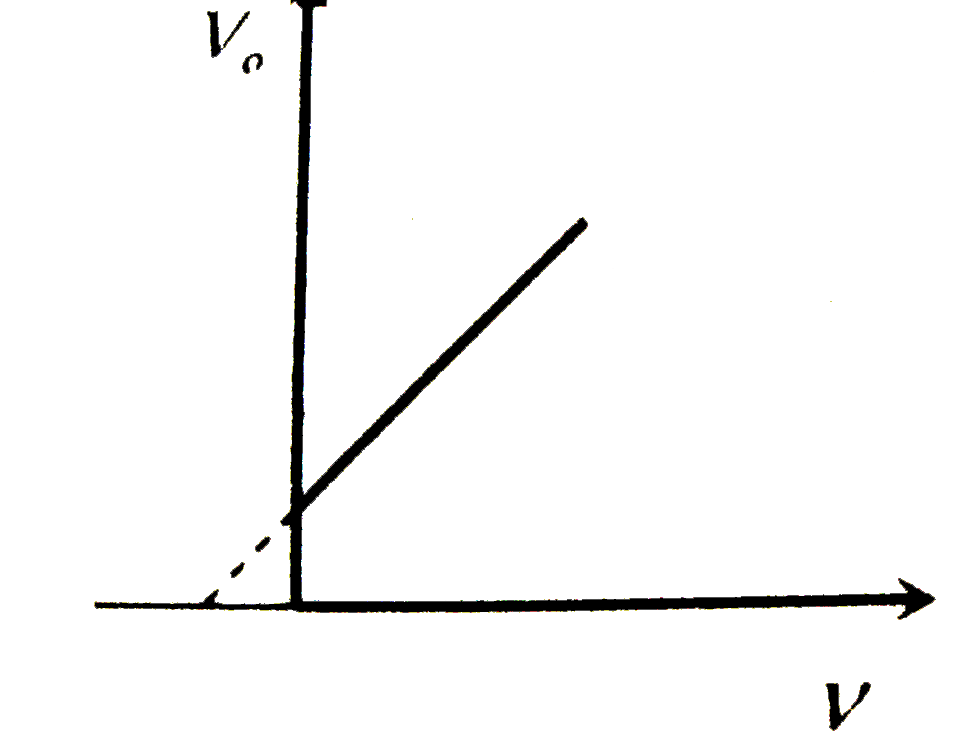 D
D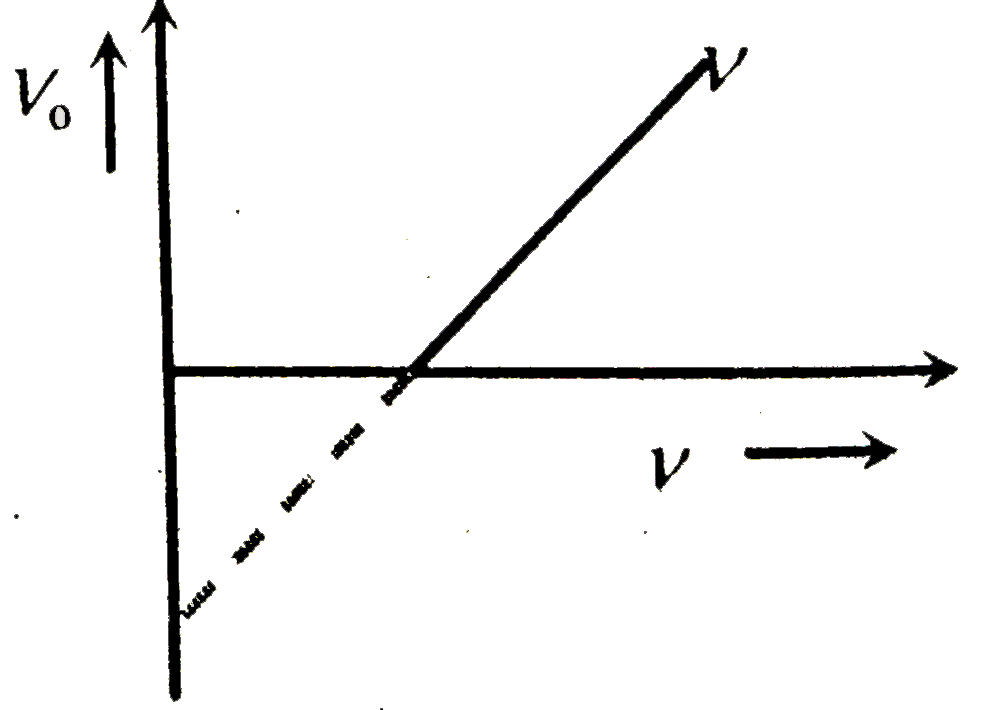
For a photoelectric cell, the graph shown the variation of cut off voltage (V0) with frequency (v) of incident light is
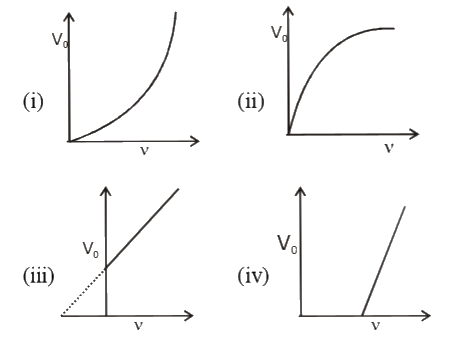 A(i)B(ii)C(iii)D(iv)
In photoelectric effect the slope of straight line graph between stopping potential (V0) and freqency of incident light (v) gives:
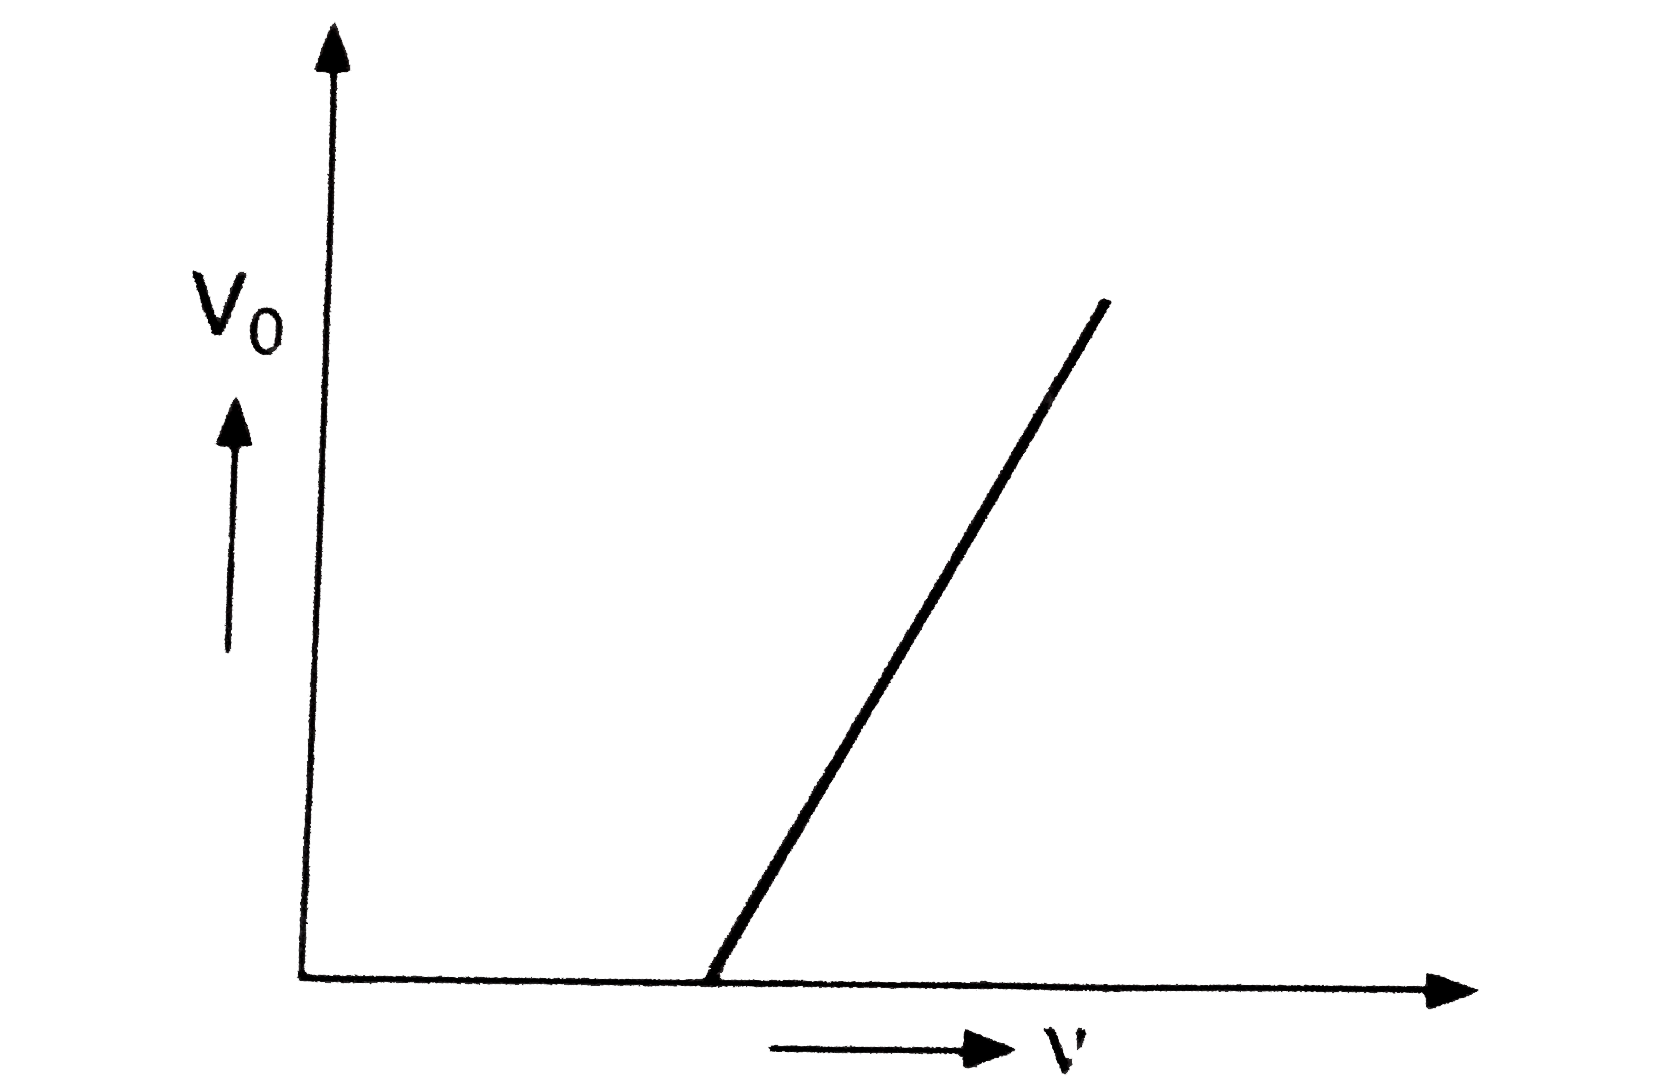 Acharge on electronBwork function of emitterCPlanck's constantDratio of Planck's constant to charge on electron
Define photoelectric effect. Draw a graph to show the variation of stopping potential with frequency of incident radiation on a metal plate.
View SolutionSketch a graph showing the variation of impedance of LCR circuit the frequency of applied voltage.
View SolutionPlot a graph showing variation of stopping potential (V0) with the frequency (v) of the incident radiation for a given photosensitive material. Hence, state the significance of the threshold frequency in photoelectric emission.
Using the principle of energy conservation, write the equation relating the energy of incident photon, threshold frequency and the maximum kinetic energy of the emitted photoelectrons.
View SolutionIn photoelectric effect the slope of straight line graph between stopping potential (Vs) and frequency of incident light (v) gives
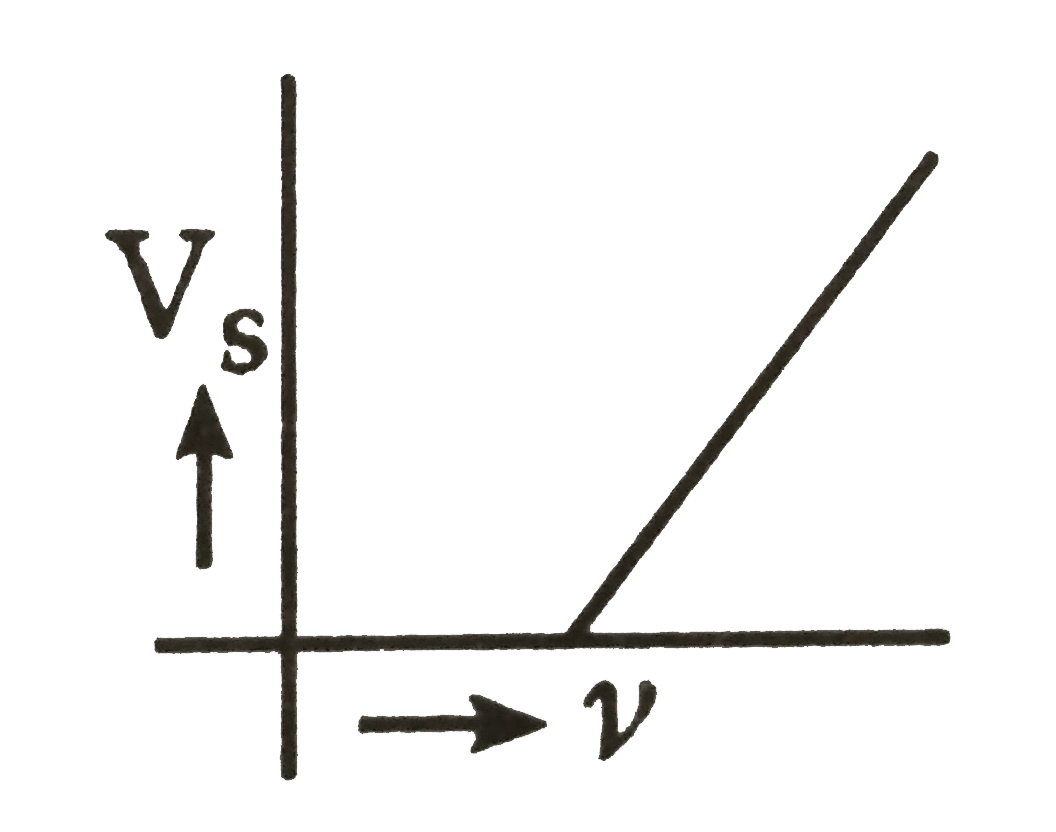
View SolutionIn photoelectric effect the slope of straight line graph between stopping potential (Vs) and frequency of incident light (v) gives

View Solution
