Define photoelectric effect. Draw a graph to show the variation of stopping potential with frequency of incident radiation on a metal plate.
Step-by-Step Solution
Step 1: Define the Photoelectric Effect
The photoelectric effect is a phenomenon where electrons are emitted from a material (usually a metal) when it is exposed to light (or electromagnetic radiation) of sufficient frequency. This effect demonstrates the particle nature of light, as it suggests that light consists of particles called photons, which can transfer energy to electrons in the material.
Definition:
The photoelectric effect is the emission of electrons from a material when it is illuminated by light of a frequency above a certain threshold frequency.
---
Step 2: Understand the Relationship Between Stopping Potential and Frequency
The stopping potential (V₀) is the minimum voltage needed to stop the emitted electrons from reaching the anode in a photoelectric experiment. The stopping potential is directly related to the frequency of the incident radiation. As the frequency of the incident radiation increases, the energy of the photons increases, which in turn increases the kinetic energy of the emitted electrons.
The relationship can be expressed by the equation:
eV0=hf−ϕ
where:
- e is the charge of an electron,
- V0 is the stopping potential,
- h is Planck's constant,
- f is the frequency of the incident radiation,
- ϕ is the work function of the material (the minimum energy required to remove an electron from the surface).
---
Step 3: Draw the Graph
To illustrate the variation of stopping potential with frequency, we can plot a graph where:
- The x-axis represents the frequency of the incident radiation (f).
- The y-axis represents the stopping potential (V₀).
Graph Characteristics:
1. The graph will start at a certain threshold frequency (f₀), below which no electrons are emitted (stopping potential is zero).
2. As the frequency increases beyond the threshold frequency, the stopping potential increases linearly.
3. The slope of the line corresponds to the ratio of Planck's constant to the charge of the electron (he).
Graph Sketch:
- Draw a horizontal line along the x-axis until the threshold frequency (f₀).
- From the threshold frequency, draw a straight line with a positive slope indicating that as frequency increases, stopping potential increases.
---
The photoelectric effect is the emission of electrons from a material when it is illuminated by light of a frequency above a certain threshold frequency.
eV0=hf−ϕ
where:
- e is the charge of an electron,
- V0 is the stopping potential,
- h is Planck's constant,
- f is the frequency of the incident radiation,
- ϕ is the work function of the material (the minimum energy required to remove an electron from the surface).
- The y-axis represents the stopping potential (V₀).
1. The graph will start at a certain threshold frequency (f₀), below which no electrons are emitted (stopping potential is zero).
2. As the frequency increases beyond the threshold frequency, the stopping potential increases linearly.
3. The slope of the line corresponds to the ratio of Planck's constant to the charge of the electron (he).
- Draw a horizontal line along the x-axis until the threshold frequency (f₀).
- From the threshold frequency, draw a straight line with a positive slope indicating that as frequency increases, stopping potential increases.
Topper's Solved these Questions
- BOOK - MBD -HARYANA BOARDCHAPTER - DUAL NATURE OF MATTER AND RADIATIONSEXERCISE - LONG ANSWER TYPE QUESTION1videos
DUAL NATURE OF MATTER AND RADIATIONS
- BOOK - MBD -HARYANA BOARDCHAPTER - DUAL NATURE OF MATTER AND RADIATIONSEXERCISE - OBJECTIVE TYPE QUESTIONS17videos
DUAL NATURE OF MATTER AND RADIATIONS
- BOOK - MBD -HARYANA BOARDCHAPTER - DUAL NATURE OF MATTER AND RADIATIONSEXERCISE - OBJECTIVE TYPE QUESTIONS17videos
DUAL NATURE OF MATTER AND RADIATIONS
- BOOK - MBD -HARYANA BOARDCHAPTER - CURRENT ELECTRICITYEXERCISE - OBJECTIVE TYPE QUESTIONS20videos
CURRENT ELECTRICITY
- BOOK - MBD -HARYANA BOARDCHAPTER - E.M.I. and A.C.EXERCISE - Exercise10videos
E.M.I. and A.C.
Similar Questions
Draw and explain the graph showing the variation of stopping potential with frequency of incident radiation in relation to photoelectric effect.
View SolutionDraw a graph showing the variation of stopping potential with frequency of the incident radiation. What does the slope of the line with frequency axis indicate? What information can be obtained from the values of intercept on the potential axis?
View Solution
Knowledge Check
- Question 1 - Select One
In photoelectric effect the slope of stop of stopping potential versus frequency of incident light for a given surface will be
Ahe−1Be hCeDh - Question 2 - Select One
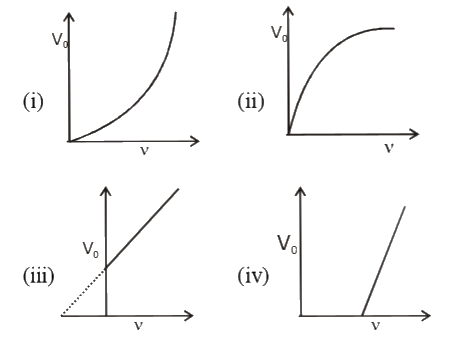
For a photoelectric cell, the graph shown the variation of cut off voltage (V0) with frequency (v) of incident light is
 A(i)B(ii)C(iii)D(iv)
 - Question 3 - Select One
In a photoelectric experiment, a student plotted the graph of stopping potential (Vs) against the frequency of incident radiation (v). But he could not write the unit of the slope of the graph. What is the corrent unit ?
AJ.A.BC/J-sCJ/s/CDJ/A
Draw a graph showing the variation of stopping potential with frequency of the incident on a metal plate. How can the value of Planck's constant be determined from this graph?
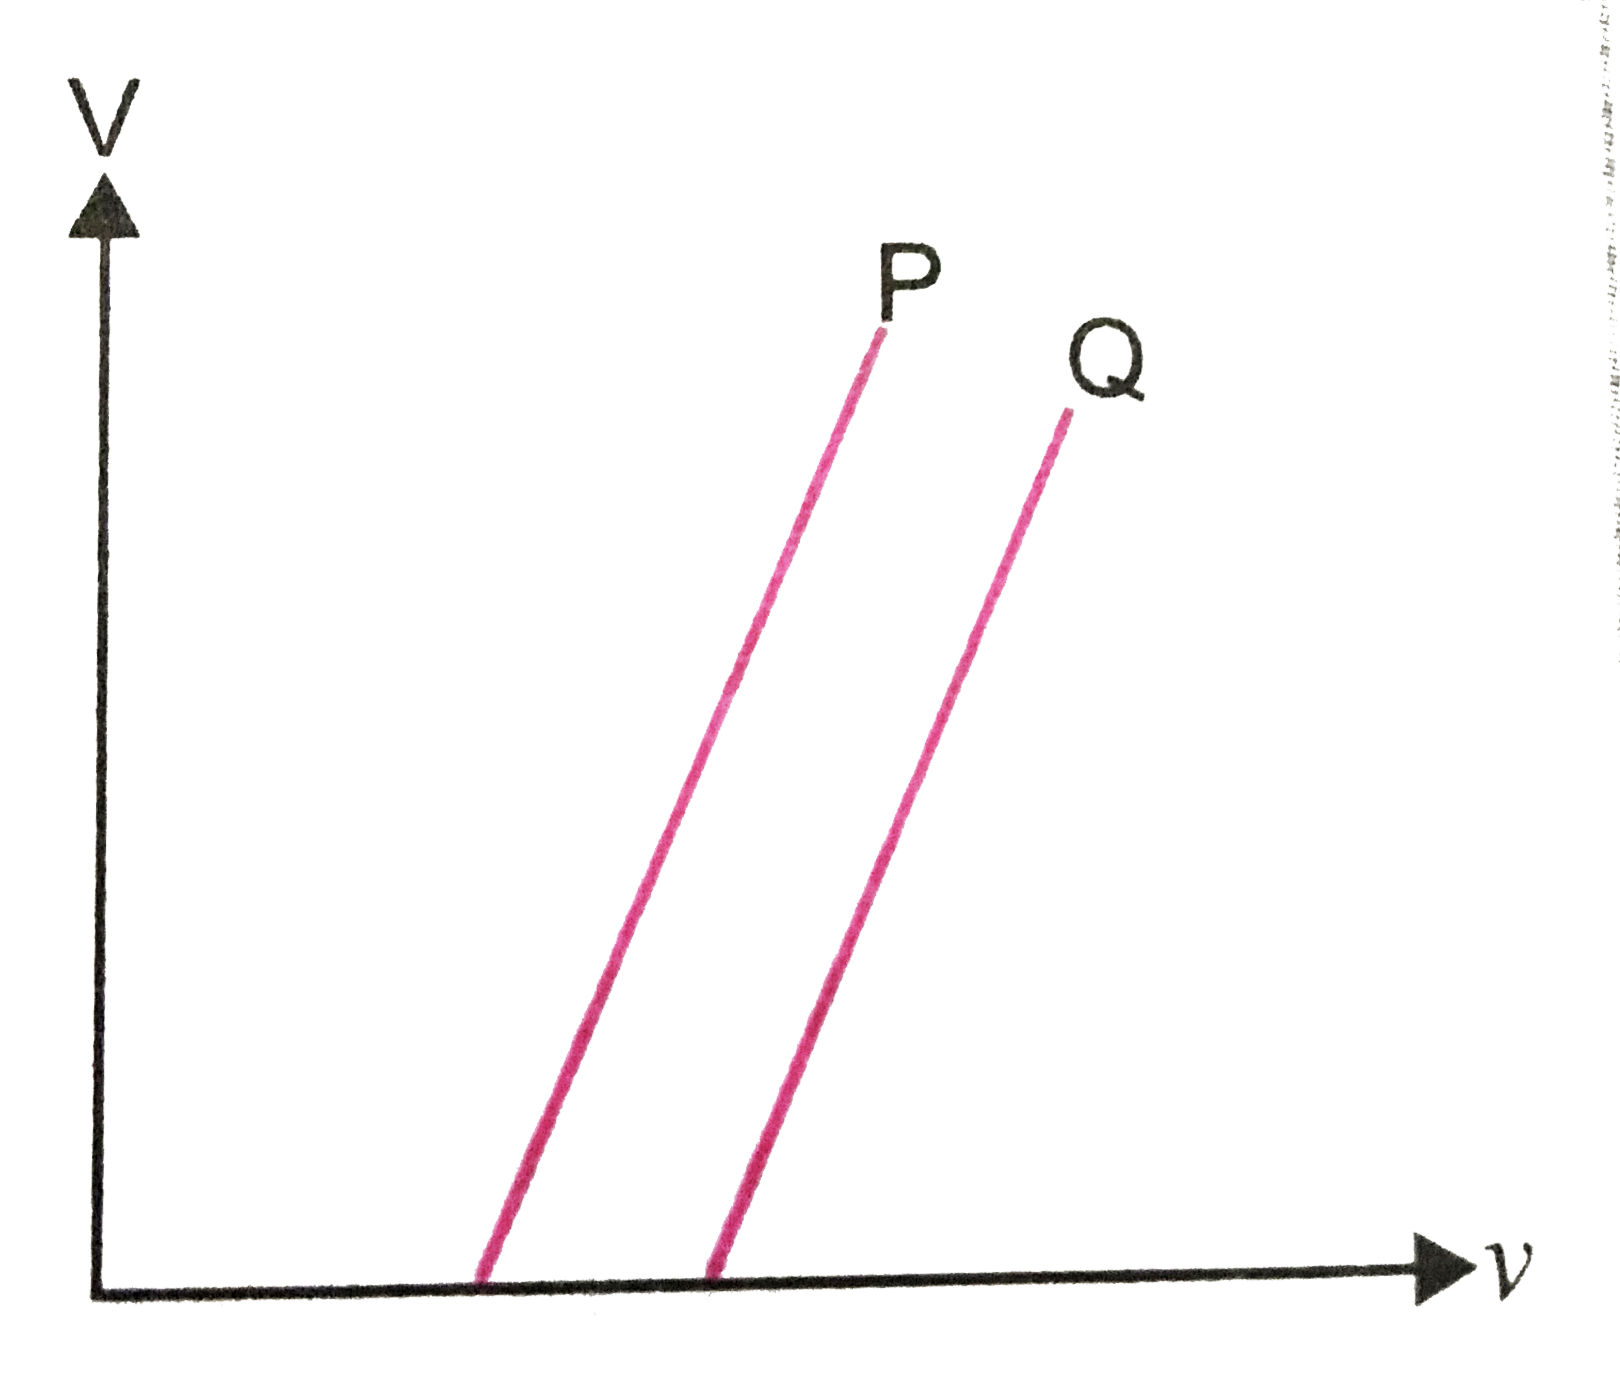
View SolutionIn a photoelectric effect experiment, the graph between the stopping potential (V) and frequency (v) of the incident radiations on two different metal plates P and Q are shown in plates, P and Q has greater value of work function ? (ii) What does the slope of the lines depict?
 View Solution
The figure shows the variation of stopping potential VQ with the frequency v of the incident radiations for two photosensitive metals P and
Which metal has smaller threshold wavelength ? Justify your answer.View SolutionPlot a graph showing variation of stopping potential (V0) with the frequency (v) of the incident radiation for a given photosensitive material. Hence, state the significance of the threshold frequency in photoelectric emission.
Using the principle of energy conservation, write the equation relating the energy of incident photon, threshold frequency and the maximum kinetic energy of the emitted photoelectrons.View SolutionDraw a plot showing the variation of photoelectric current versus the intensity of incident radiation on a given photosenstive surface.
View Solution

