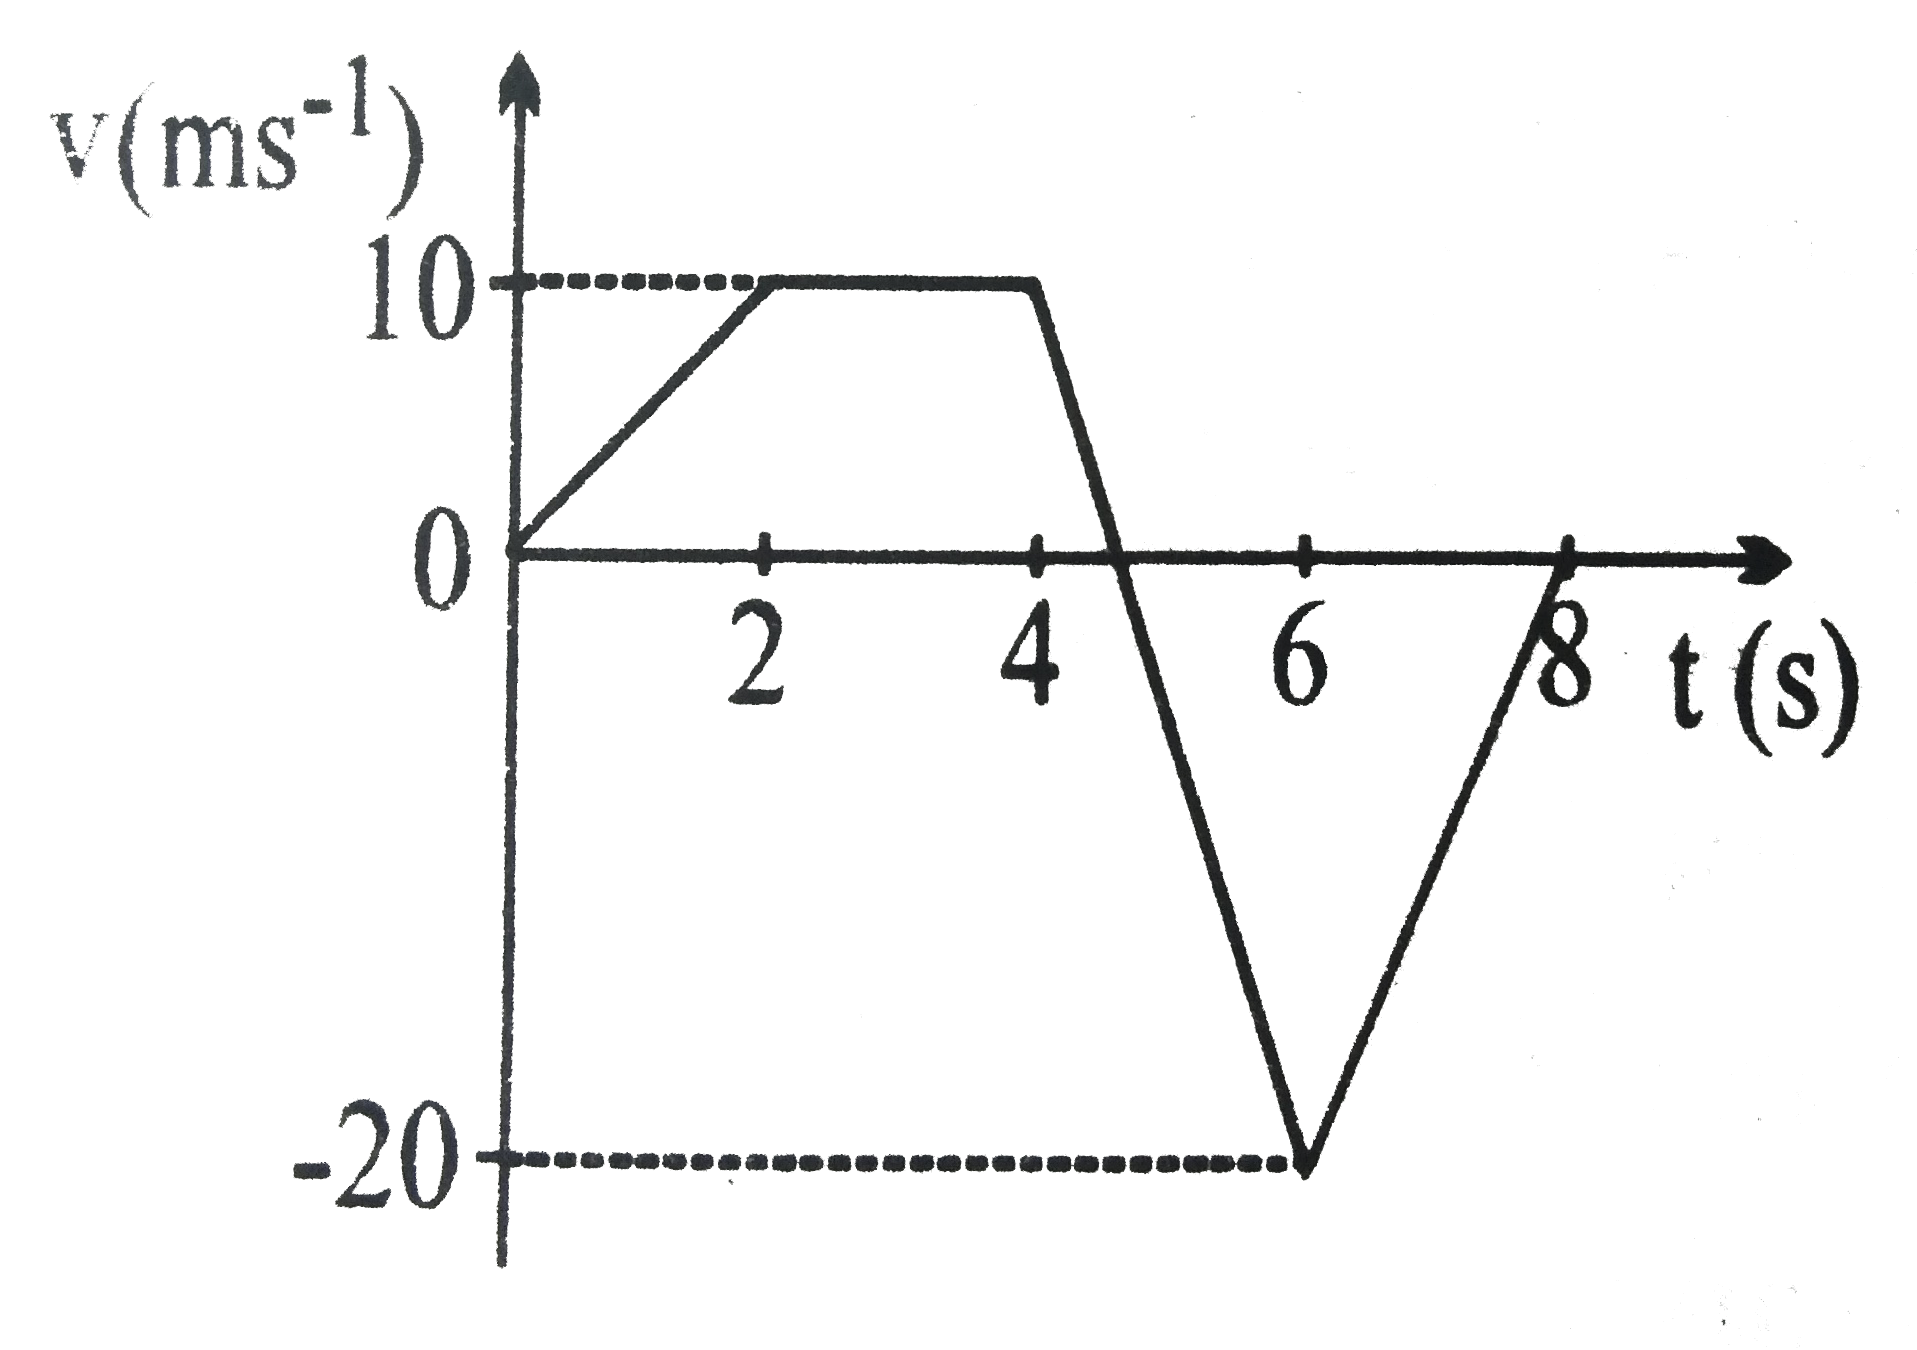
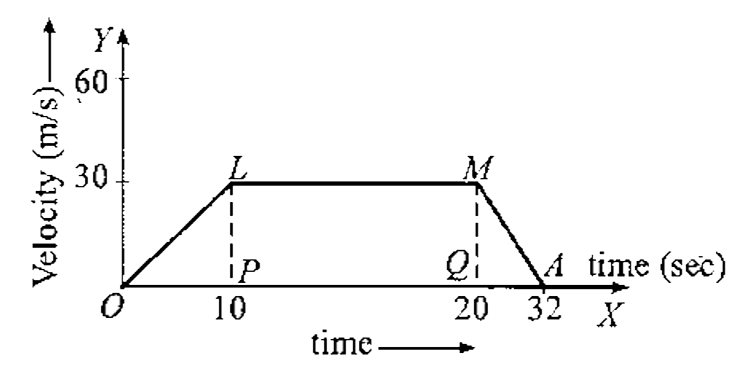
The following figure-1.124 shows the velocity-time graph of a train. The total distance travelled by the train is :
780 m
1200 m
660 m
1500 m
The correct Answer is:A
Step by step video, text & image solution for The following figure-1.124 shows the velocity-time graph of a train. The total distance travelled by the train is : by Physics experts to help you in doubts & scoring excellent marks in Class 11 exams.
Topper's Solved these Questions
- BOOK - PHYSICS GALAXY - ASHISH ARORACHAPTER - KINEMATICSEXERCISE - Advance MCQs with One or More Options Correct17videos
KINEMATICS
- BOOK - PHYSICS GALAXY - ASHISH ARORACHAPTER - KINEMATICSEXERCISE - Unsolved Numerical Pro.83videos
KINEMATICS
- BOOK - PHYSICS GALAXY - ASHISH ARORACHAPTER - KINEMATICSEXERCISE - Conceptual MCQs Single Option Correct35videos
KINEMATICS
- BOOK - PHYSICS GALAXY - ASHISH ARORACHAPTER - GRAVITATIONEXERCISE - Unsolved Numerical94videos
GRAVITATION
- BOOK - PHYSICS GALAXY - ASHISH ARORACHAPTER - LINEAR MOMENTUM & ITS CONSERVATIONEXERCISE - exercise 1.33videos
LINEAR MOMENTUM & ITS CONSERVATION
Similar Questions
Knowledge Check
- Question 1 - Select One
The figure shows a velocity-time graph of a particle moving along a straight line
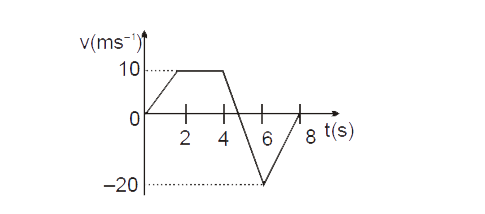
The total distance travelled by the particle isA66.6 mB51.6 mCzeroD36.6m - Question 2 - Select One
In the following velocity -time graph ,the distance travelled by the body in meres is :
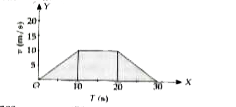 A200B250C300D400
 - Question 3 - Select One
The following figure shows the velocity time graph of a body. According to this at the point B-
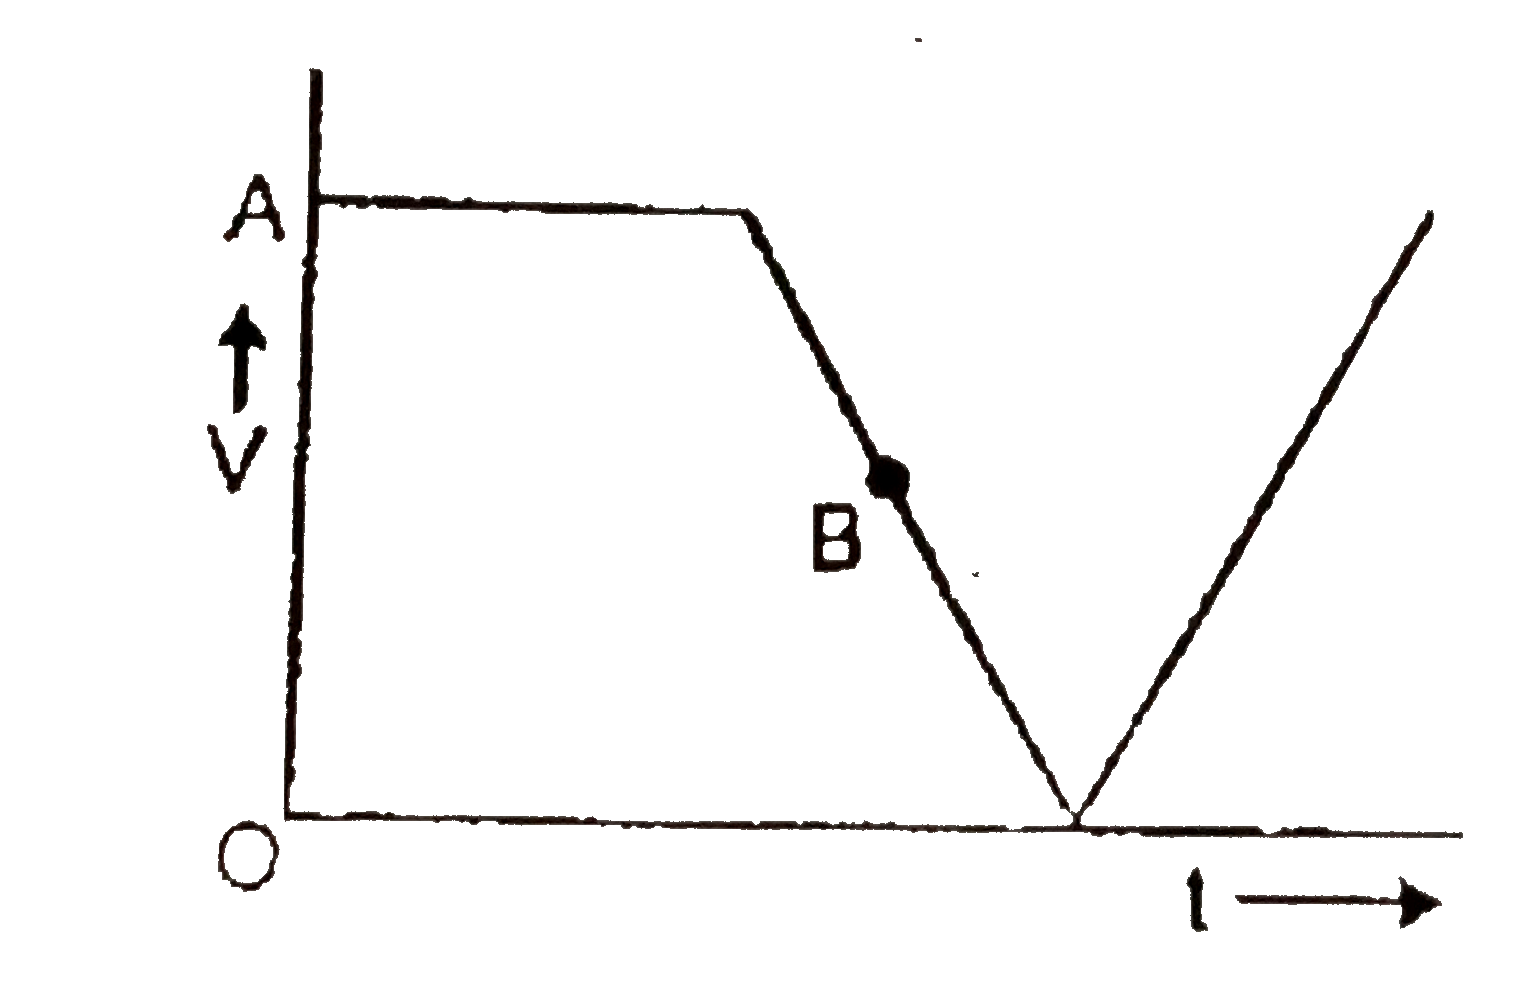 AThe force is zeroBThe force is in the direction of the motionCThe force is in opposite direction of the motionDIt is only the gravitational force
The figure shows a velocity-time graph of a particle moving along a straight line
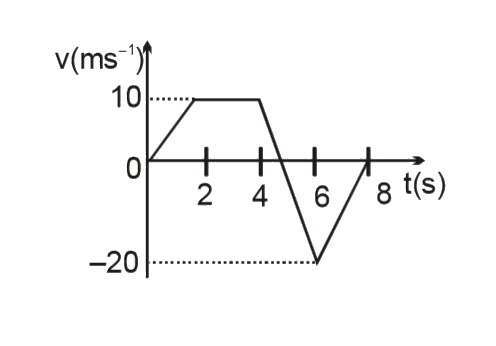
Q. The total distance travelled by the particle isView SolutionThe following figure-l .123 shows the velocity-time graph of a moving body along a straight line. The displacement and distance travelled in six seconds be respectively given as :
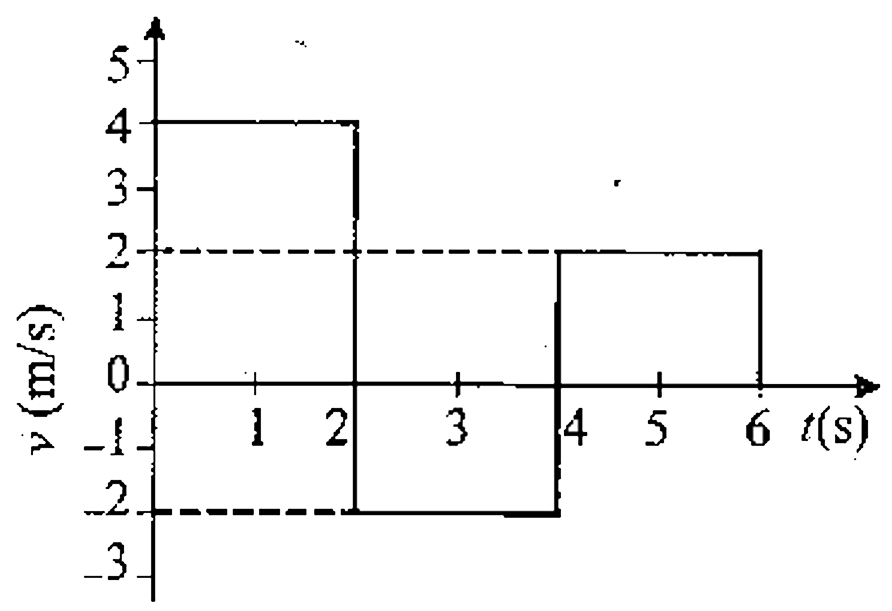 View Solution
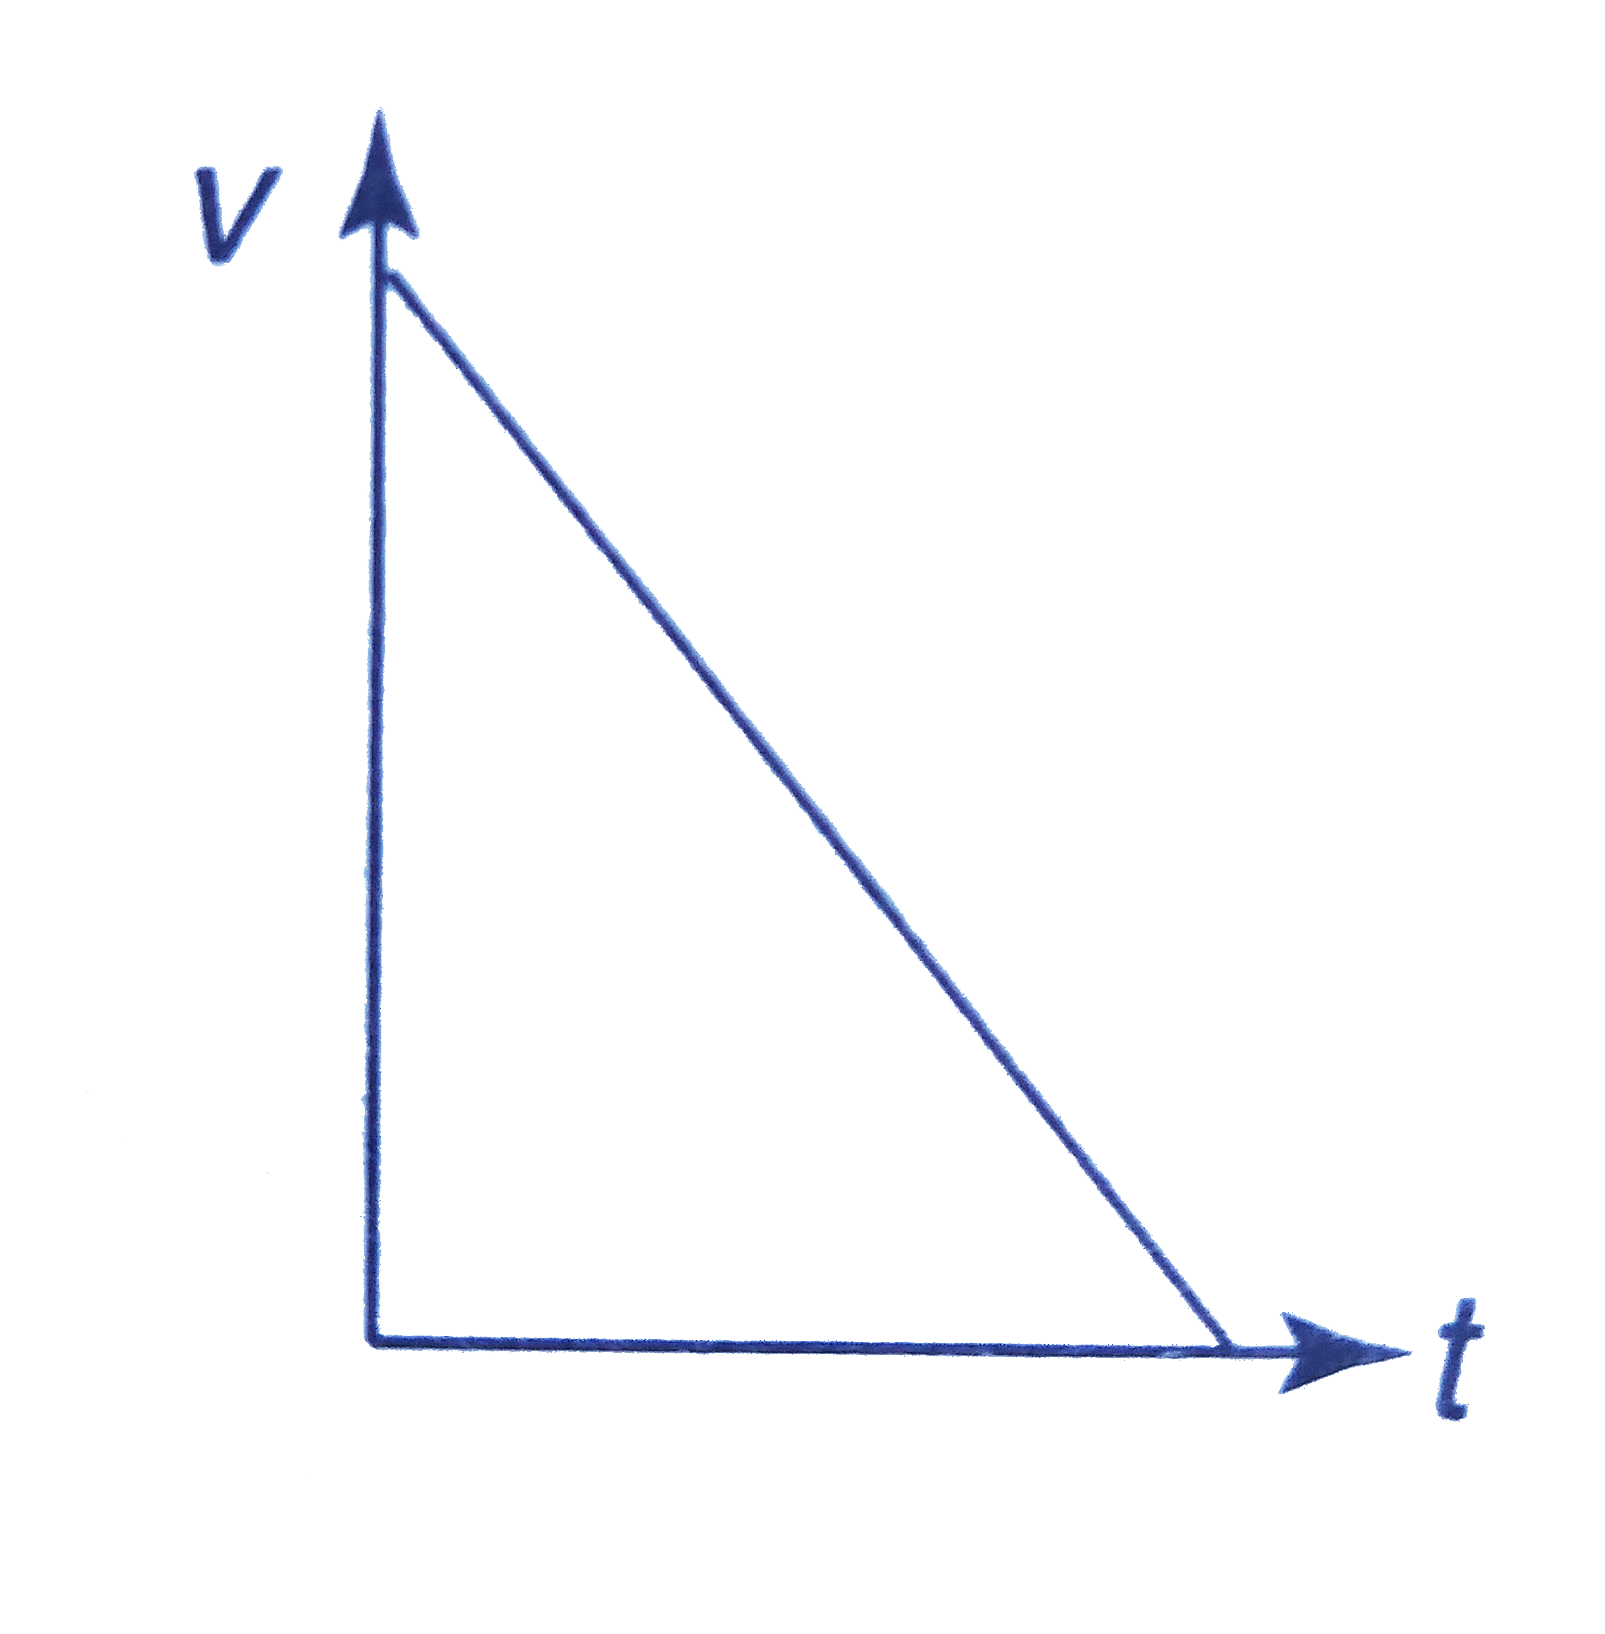
Figure gives the velocity-time graph. This shows that the body is.
 View Solution
The speed of a train increases at a constant rate α from zero to v and then remains constant for an interval and finally decreases to zero at a constant rate β. The total distance travelled by the train is l. The time taken to complete the journey is t. Then,
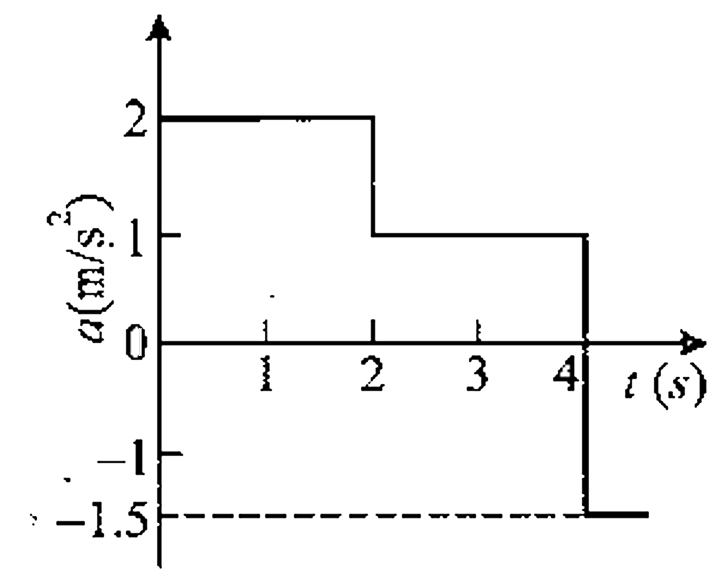
View SolutionThe figure-1.125 shows the acceleration versus time graph of a train. If it starts from rest, the distance it travels before it comes to rest is :
 View Solution


