
The figure above shows two positively charged particles. The +Q charge is fixed in position, and the +q charge is brought close to +Q and released from rest. Which of the following graphs best depicts the acceleration (a) of the +q charge as a function of its distance (r) from +Q?


The correct Answer is:A
If the mass of the +q change is m, then its acceleration is
a=FDm=kQqm1r2.
The graph in (A) best depicts an inverse-square relationship between a and r.
Topper's Solved these Questions
Similar Questions
What is the acceleration of the positive charge q? Is it in uniform acceleration?
View SolutionTwo equal positive charges , Q , are fixed at points (0,d) and (0,−d) on the y-axis. A charged particle having charge −q and mass m is released from rest at point (d,0) on the x-axis . Discuss the motion of charged particle.
View Solution
Knowledge Check
Consider two positive point charges, each of magnitude q, placed on the y-axis at the points (0, a) and (0, -a). A positively charged particle of charge q' and mass m is displaced slightly from the origin in the direction of the positive x-axis.
At the origin, charge q' will be inA B
B C
C D
D
Two equal negative charges are fixed at points and on y-axis. A positive charge Q is released from rest at the point on the x-axis. The charge Q will:
Aexecute simple harmonic motion about the originBmove to the origin and remain at restCmove to infinityDsame as at point 25 cm aways form the surfaceTwo charge +q1 and +q2 placed on x-axis at posiution A and B as shown in figure. Which graph best represent potential as a function of distance r from charge q1
 A
A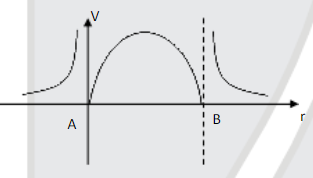 B
B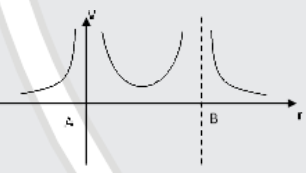 C
C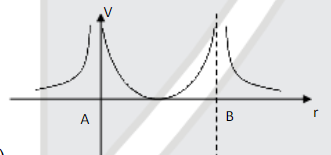 D
D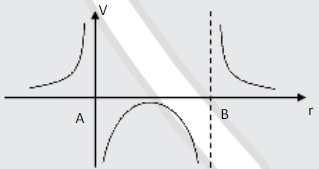
Two charge +q1 and +q2 placed on x-axis at posiution A and B as shown in figure. Which graph best represent potential as a function of distance r from charge q1

View SolutionTwo equal positive charges Q are fixed at points (a, 0) and (−a,0) on the x-axis. An opposite charge -q at rest is relased from point (0, a) on the y-axis. The charge -q will
View SolutionThe negative charge −q2 is fixed, while positive charge q1 as well as the conducting sphere S is free to move figure. If the system is released from rest,
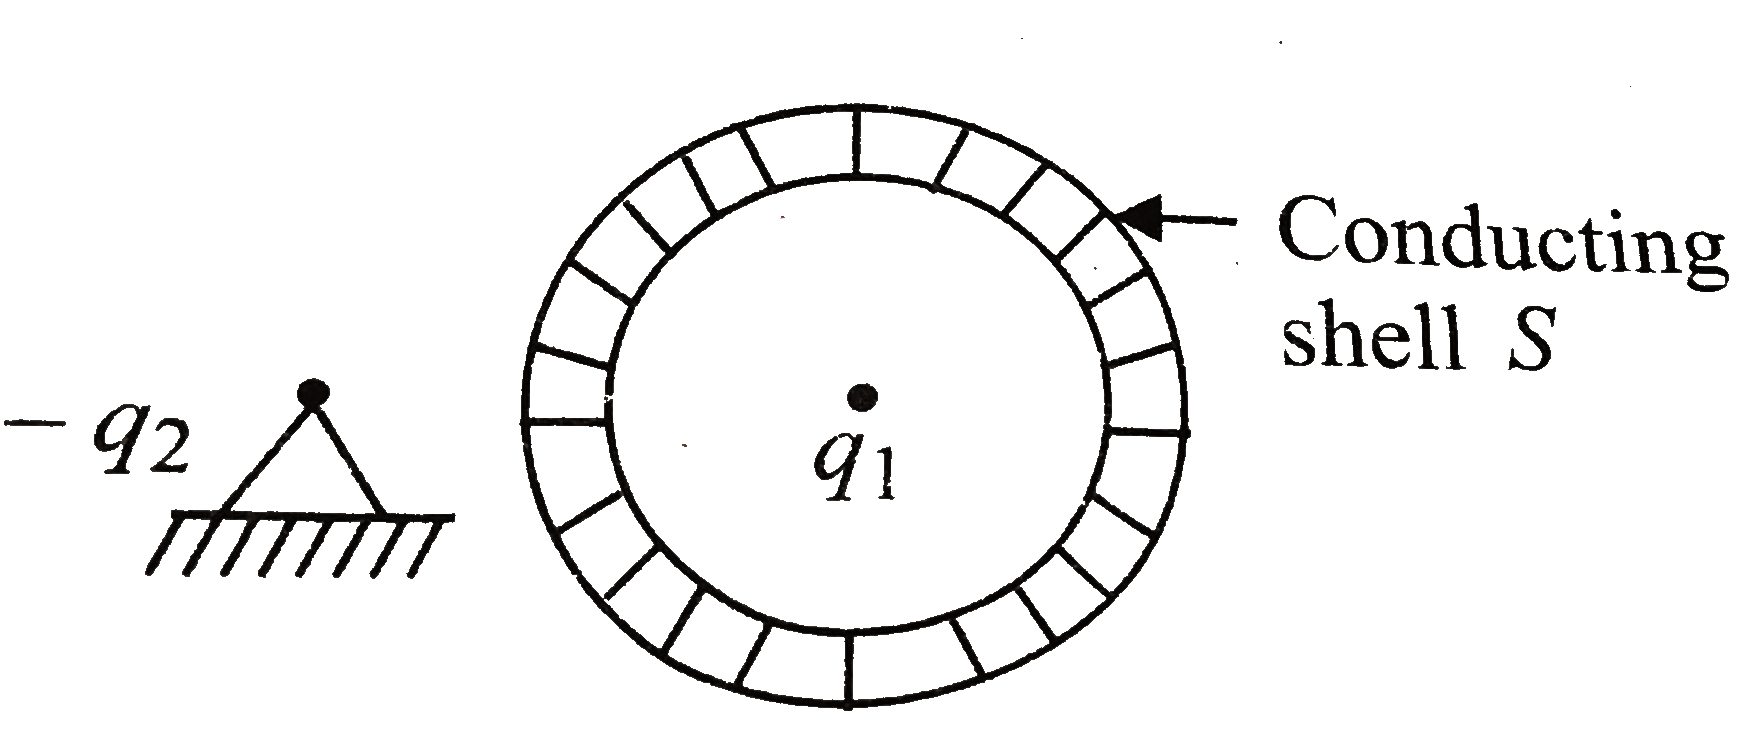

View Solution
