Graph of ln S∘ vs 1T is plotted for two gases A and B [S∘ represents solubility in molarity and T is in Kelvin]. Compare Henry's constant KH for the two gases at same temperature.
![Graph of ln S^(@) vs (1)/(T) is plotted for two gases A and B [S^(@) represents solubility in molarity and T is in Kelvin]. Compare Henry's constant K(H) for the two gases at same temperature.](https://d10lpgp6xz60nq.cloudfront.net/physics_images/GRB_PHY_CHM_P2_V03_QB_C13_E01_104_Q01.png)
A
KH,A>KH,B
B
KH,A<KH,B
C
KH,A=KH,B
D
KH,A may be greater or less than KH,B
Text Solution
The correct Answer is:A
|
Topper's Solved these Questions
- GRAPHICAL INTERPRETATIONBOOK - GRB PUBLICATIONCHAPTER - GRAPHICAL INTERPRETATIONEXERCISE - E. Surface Chemistry
1 Videos
- GRAPHICAL INTERPRETATIONBOOK - GRB PUBLICATIONCHAPTER - GRAPHICAL INTERPRETATIONEXERCISE - Surface Chemistry
4 Videos
- GRAPHICAL INTERPRETATIONBOOK - GRB PUBLICATIONCHAPTER - GRAPHICAL INTERPRETATIONEXERCISE - D. Liquid Solutions
1 Videos
- F-BLOCK ELEMENTSBOOK - GRB PUBLICATIONCHAPTER - F-BLOCK ELEMENTSEXERCISE - Subjective type
7 Videos
- HYDROCARBON (ALIPHATIC)BOOK - GRB PUBLICATIONCHAPTER - HYDROCARBON (ALIPHATIC)EXERCISE - Previous years jee questions
28 Videos
Similar Questions
Knowledge Check
which of the following option is correct with respect to comparison of Henry's constant KH of different gases at different temperatures?
AKH of O2 at 293 K<KH of Ar at 293 KBKH of O2 at 293K>KH of N2 at 293KCKH of CH4 at 298 K<KH of O2 at 293KDKH of He at 293K<KH of N2 at 293KA graph plotted between log k vs 1T is represented by
A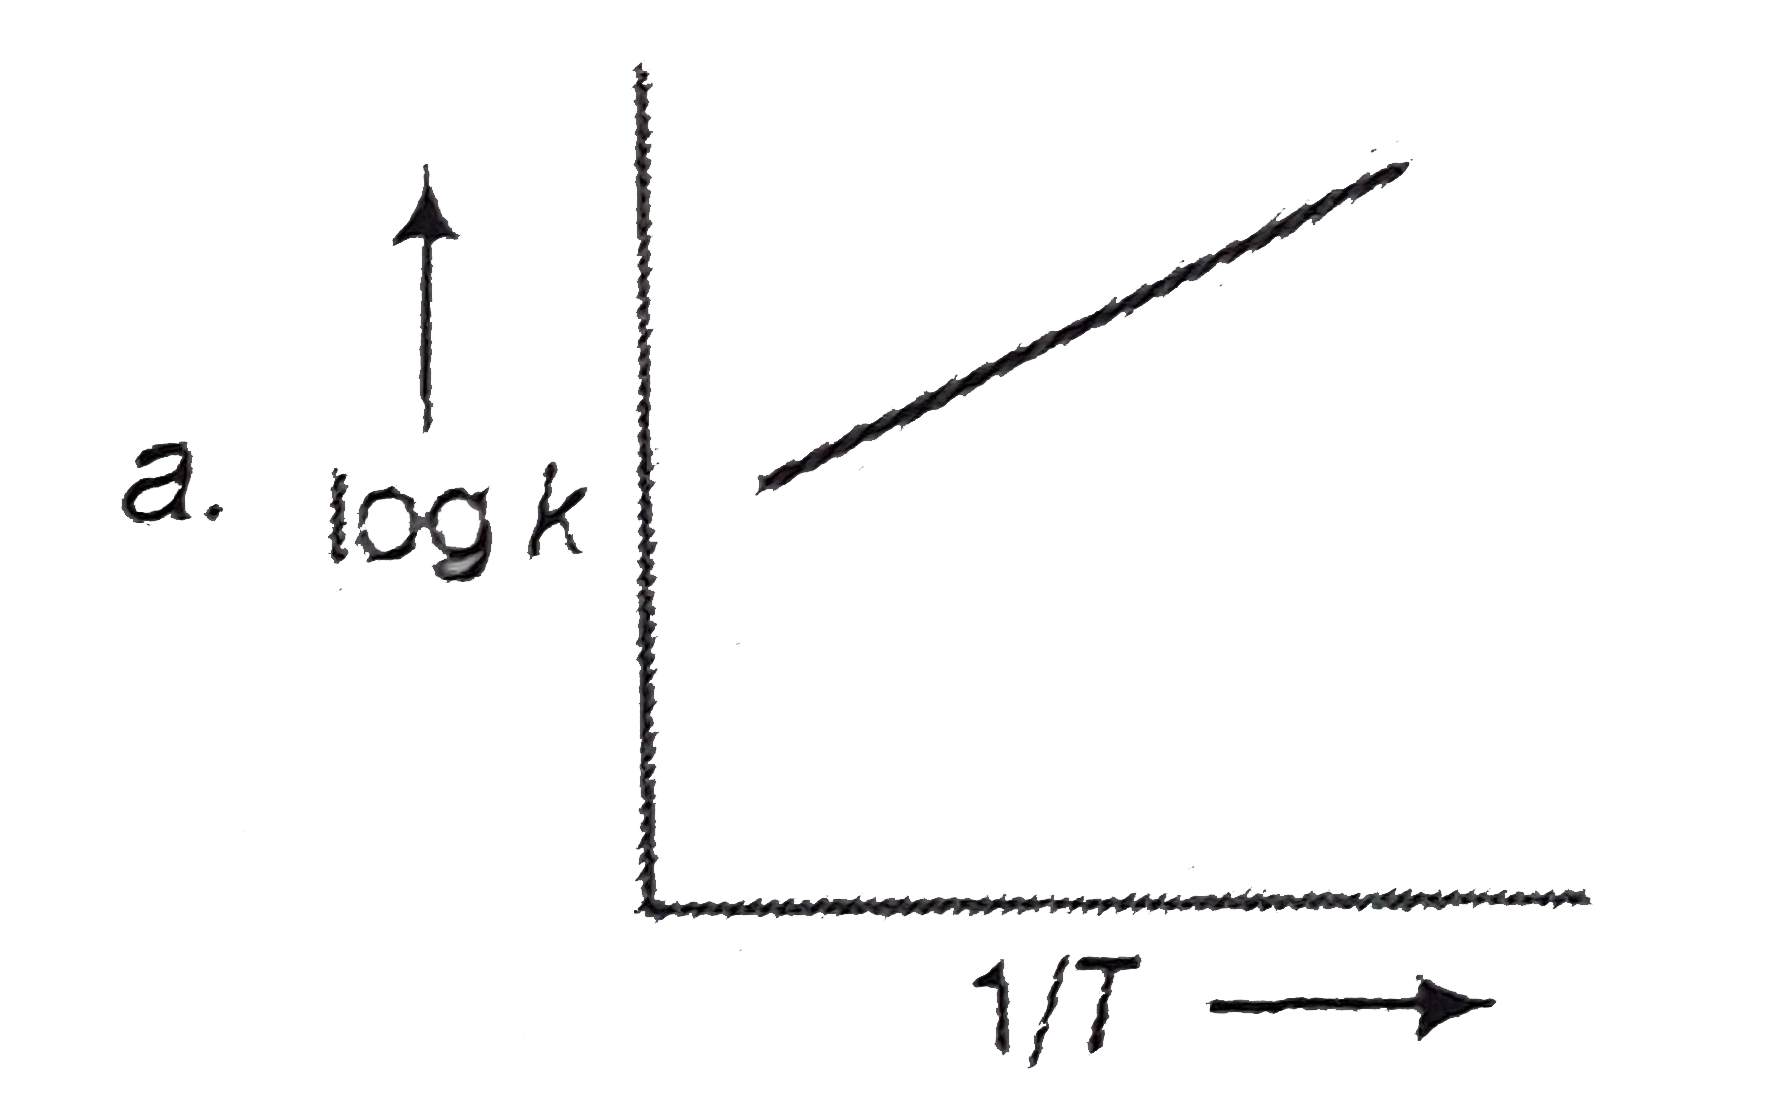 B
B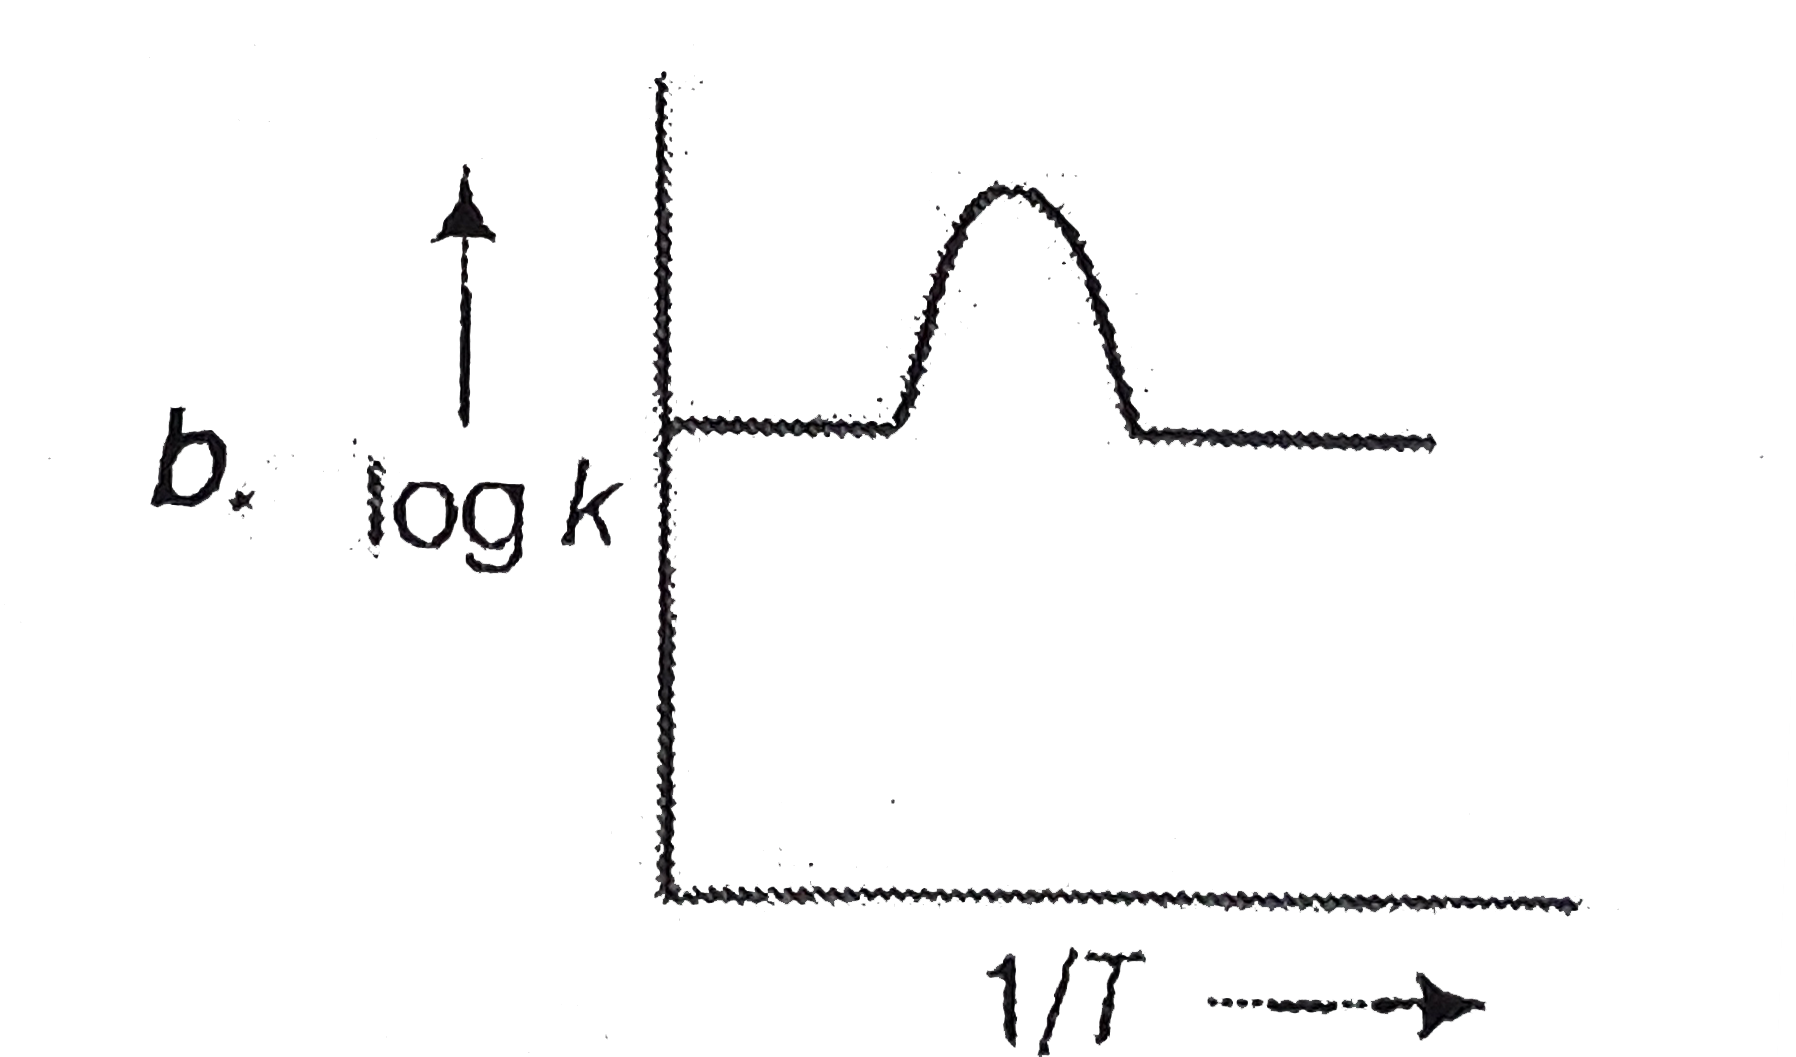 C
C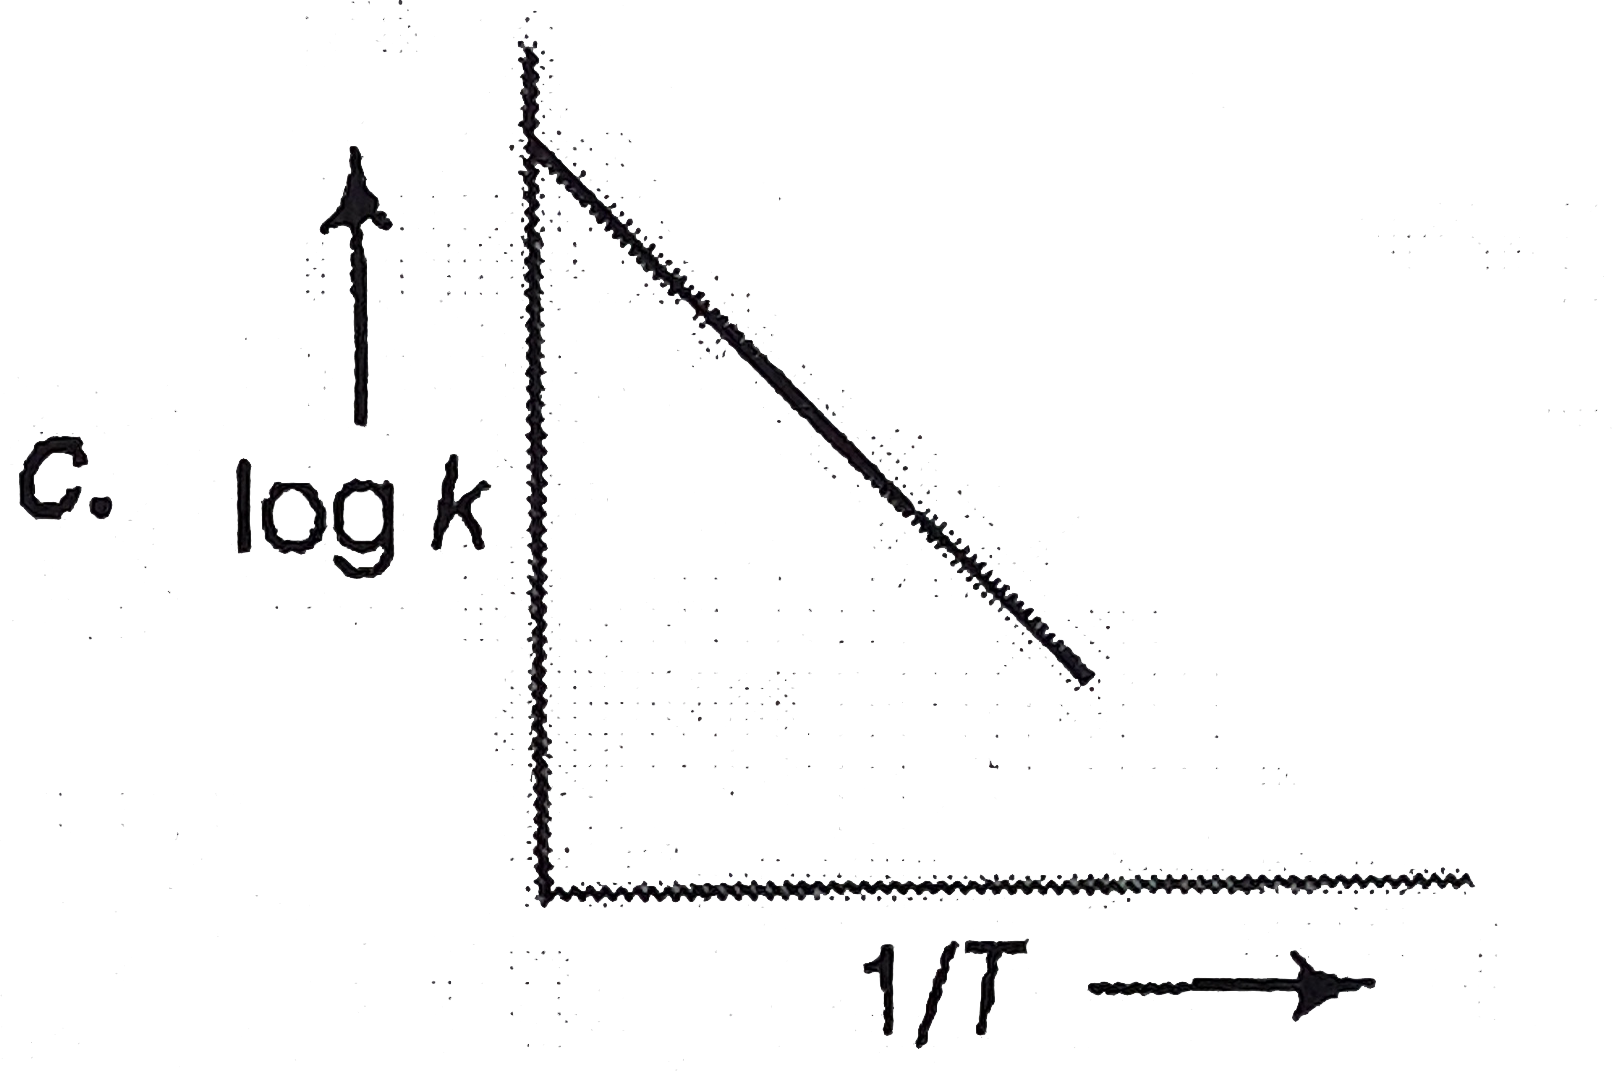 D
D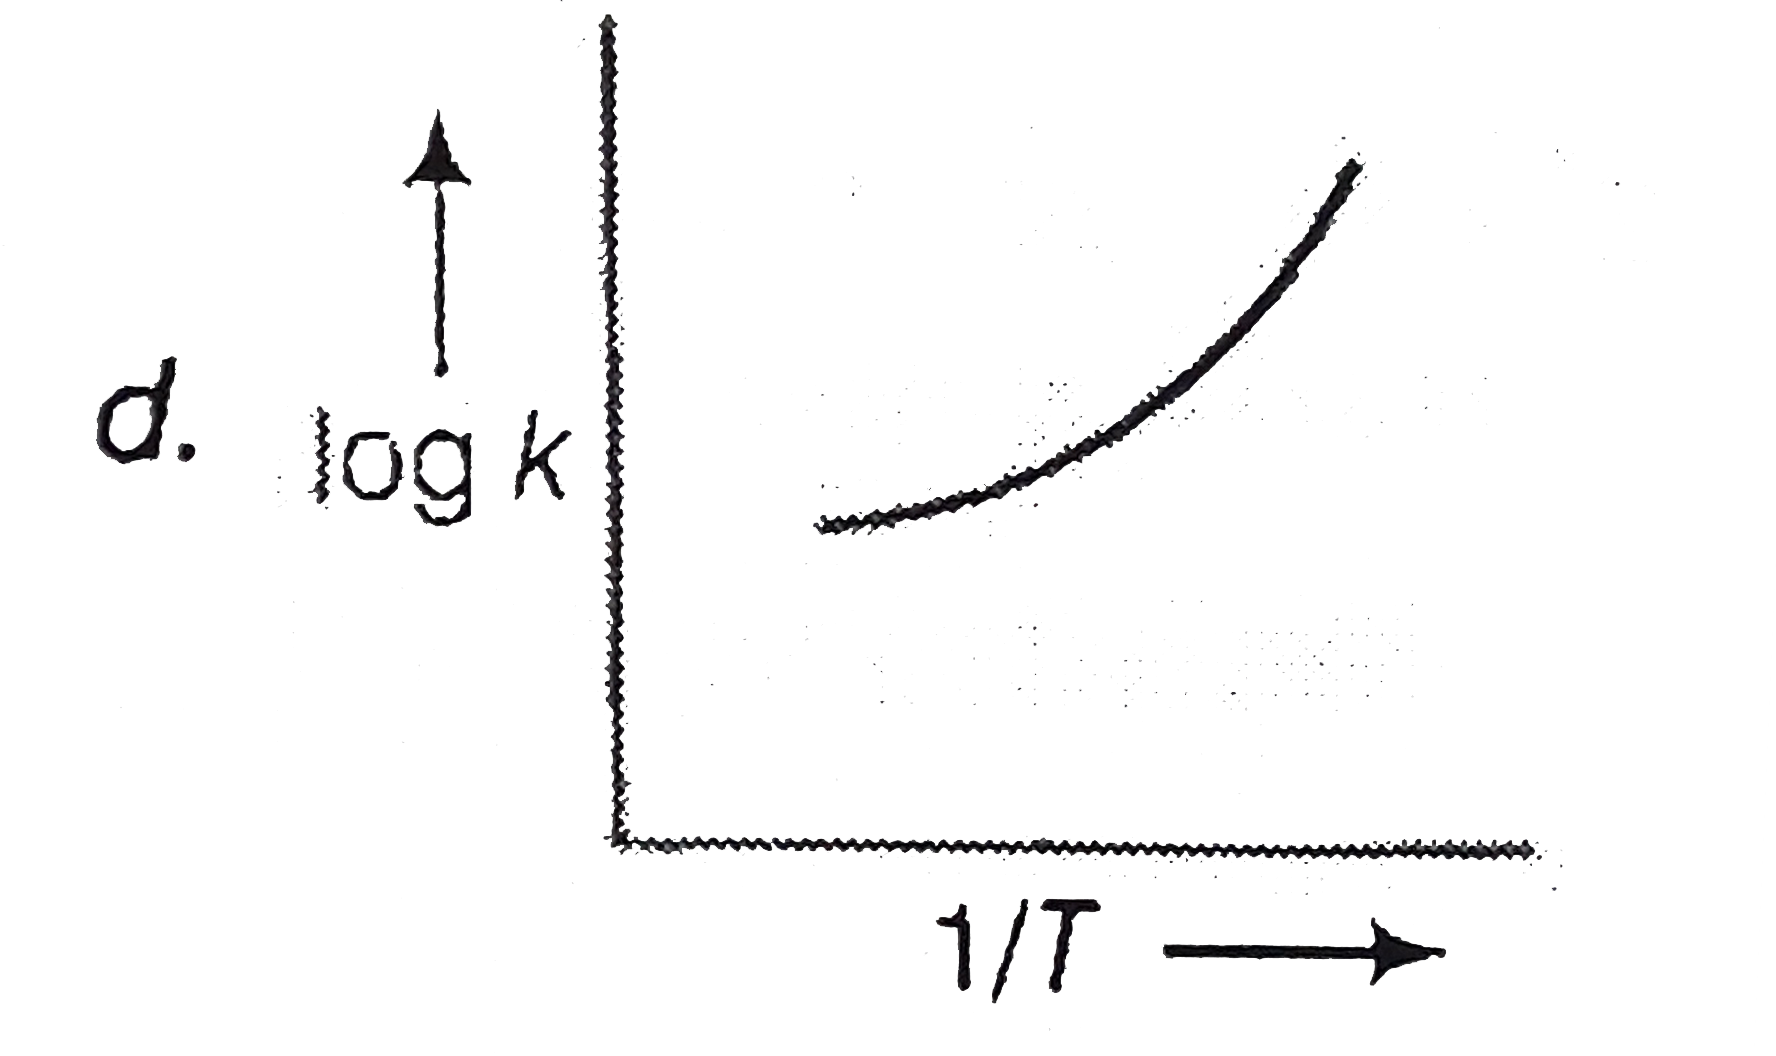
Which of the plots of ln K vs (1T) is/are correct?
A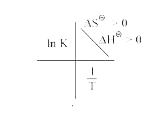 B
B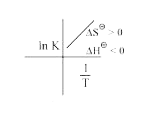 C
C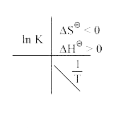 D
D
Henry law constant for two gases are 21.5 and 49.5 atm, which gas is more soluble ?
View SolutionPlot ln K vs. 1/T for two reactions A and B are given below. Which reaction is more sensitive to temperature :-
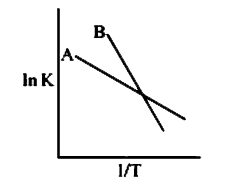
View SolutionAt constant temperature of 273K. 1v vs are plotted for two ideal gases A&B as shown below. Ratio of number of moles of gas A & B are
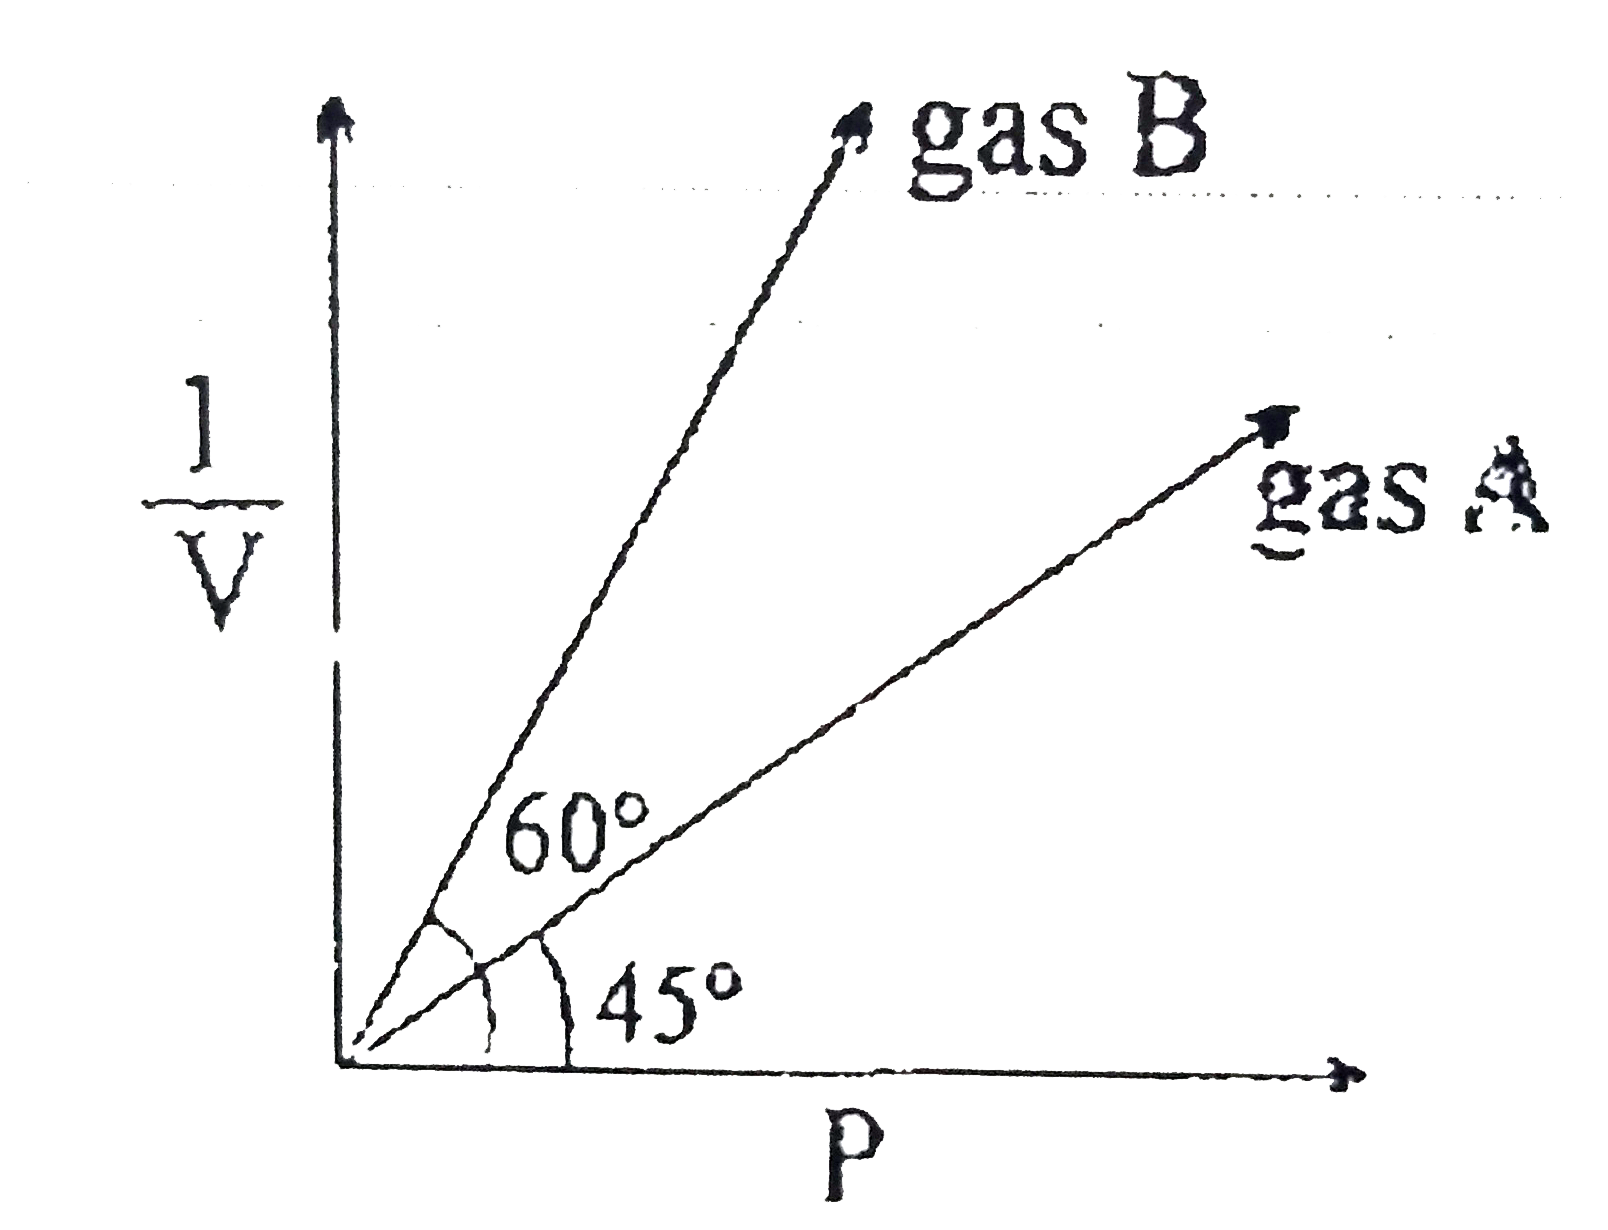
View SolutionAt constant temperature of 273K,1V vs P are plotted for two ideal gases A and B as given below. Ratio of number of moles of A and B are:
View SolutionIf two gases A and B and temperatures TA and TB respectively have identical Maxwellian plots, then which of the following statements is true?
View Solution
