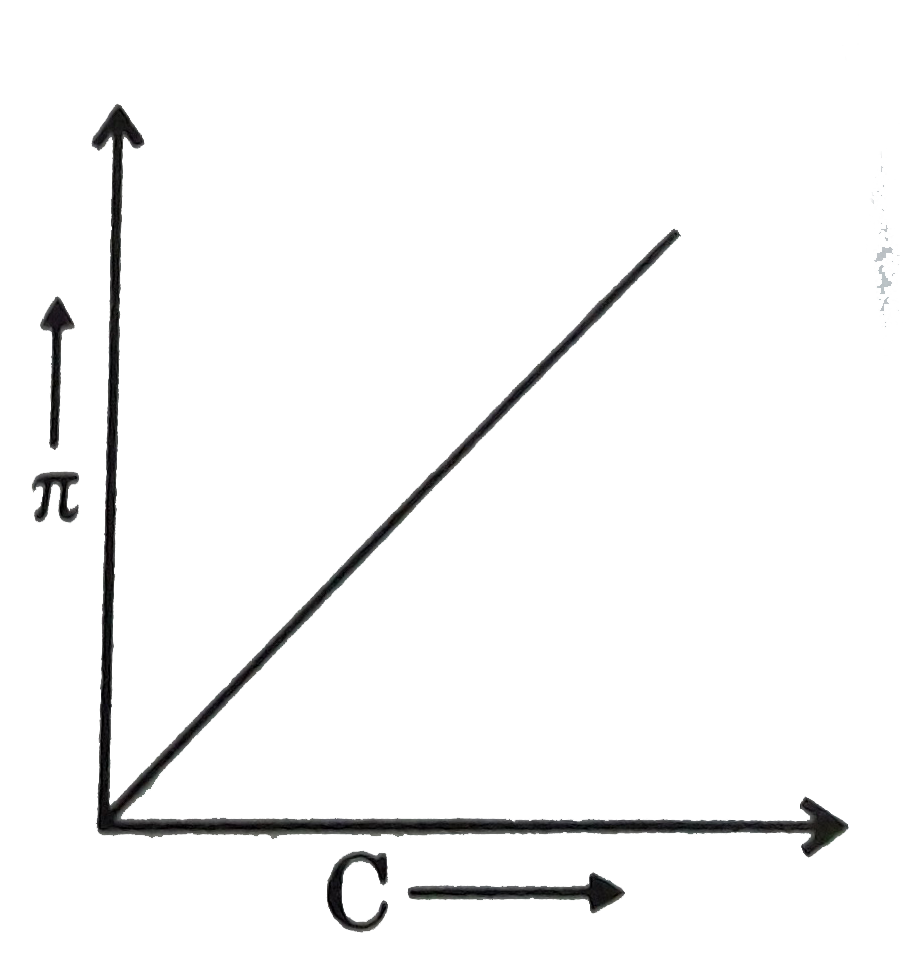
A graph showing variation of osmotic pressure (π) versus molar concentration. C of an aqueous solution at temperature T is given below. The slope of the line is equal to:

solution constant R
absolute temperature T
RT
degree of ionization of solute
The correct Answer is:C
Topper's Solved these Questions
- GRAPHICAL INTERPRETATIONBOOK - GRB PUBLICATIONCHAPTER - GRAPHICAL INTERPRETATIONEXERCISE - E. Surface Chemistry
1 Videos
- GRAPHICAL INTERPRETATIONBOOK - GRB PUBLICATIONCHAPTER - GRAPHICAL INTERPRETATIONEXERCISE - Surface Chemistry
4 Videos
- GRAPHICAL INTERPRETATIONBOOK - GRB PUBLICATIONCHAPTER - GRAPHICAL INTERPRETATIONEXERCISE - D. Liquid Solutions
1 Videos
- F-BLOCK ELEMENTSBOOK - GRB PUBLICATIONCHAPTER - F-BLOCK ELEMENTSEXERCISE - Subjective type
7 Videos
- HYDROCARBON (ALIPHATIC)BOOK - GRB PUBLICATIONCHAPTER - HYDROCARBON (ALIPHATIC)EXERCISE - Previous years jee questions
28 Videos
Similar Questions
A graph showing variation of osmotic pressure (π) versus molar concentration 'C' of an aqueous solution at temperature T is given below

The slope of the line represents
View SolutionA graph showing variation of osmotic pressure (π) versus molar concentration 'C' of an aqueous solution at temperature T is given below

The slope of the line represents
View Solution
Knowledge Check
The osmotic pressure (pi) of a solution is given by reation
Aπ=RTCBπ=CTRCπ=RCTDπC=RTOsmotic pressure of a solution at a given temperature
Aincreases with concentrationBdecreases with concentrationCremains sameDinitially increases and then decreasesThe osmotic pressure of one molar solution at 27∘C is
A2.46 atmB24.6 atmC1.21 atmD12.1 atm
The graph between the log K versus 1T is a straight line. The slope of the line is
View SolutionAt a given temperature, osmotic pressure of a concentrated solution of a substance __
View SolutionAt a given temperature, osmotic pressure of a concentrated solution of a substance __
View SolutionThe relation between osmotic pressure, concentration and temperature of a solution is given by:
View SolutionIf the molar concentration of the given sugar solution is 0.3 M, find out the osmotic pressure of this solution
View Solution
