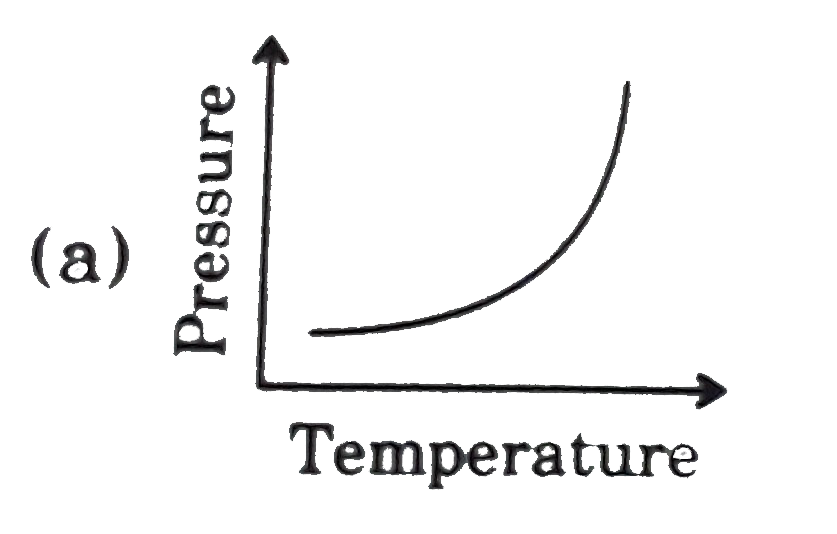
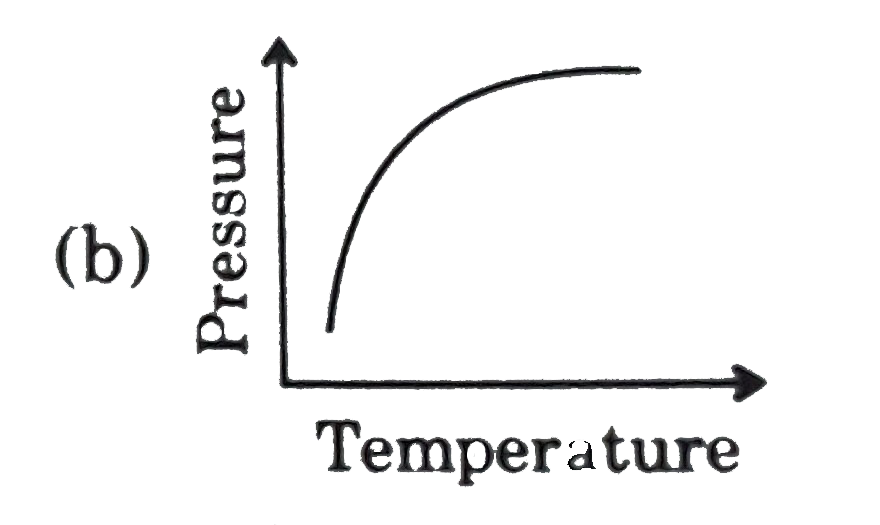
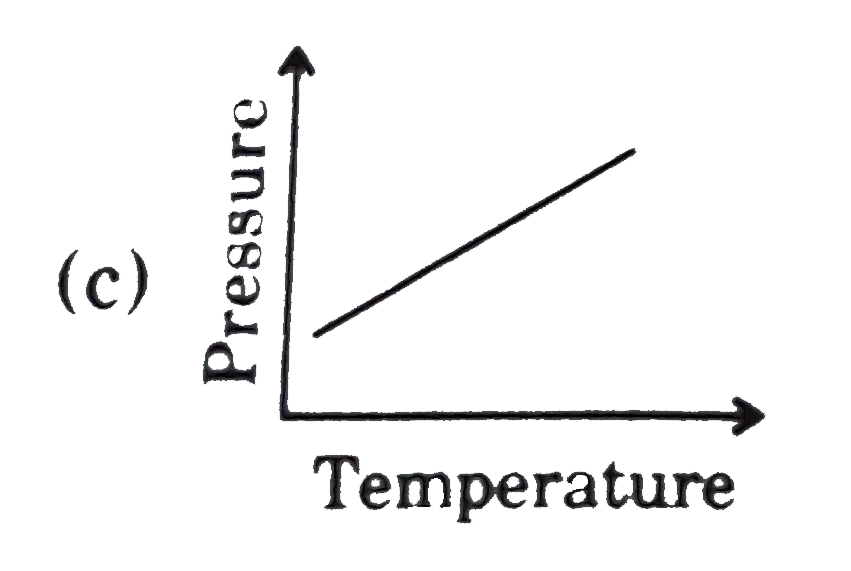
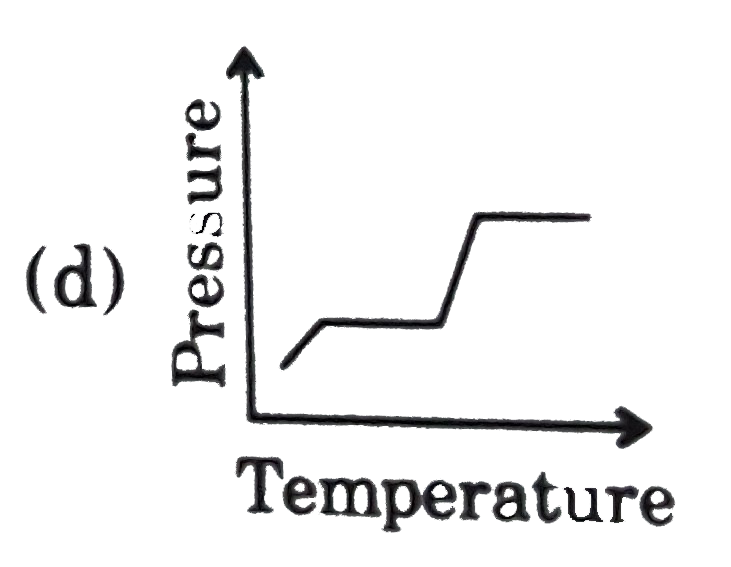
Which graph best represents the vapour pressure of water as a function of temperature from 0∘C to 100∘C ?


The correct Answer is:A
Step by step video, text & image solution for Which graph best represents the vapour pressure of water as a function of temperature from 0^(@)C to 100^(@)C ? by Chemistry experts to help you in doubts & scoring excellent marks in Class 12 exams.
Topper's Solved these Questions
- BOOK - GRB PUBLICATIONCHAPTER - GRAPHICAL INTERPRETATIONEXERCISE - H. Chemical Kinetics1videos
GRAPHICAL INTERPRETATION
- BOOK - GRB PUBLICATIONCHAPTER - GRAPHICAL INTERPRETATIONEXERCISE - Chemical Kinetics80videos
GRAPHICAL INTERPRETATION
- BOOK - GRB PUBLICATIONCHAPTER - GRAPHICAL INTERPRETATIONEXERCISE - G. Chemical Equilibrium1videos
GRAPHICAL INTERPRETATION
- BOOK - GRB PUBLICATIONCHAPTER - F-BLOCK ELEMENTSEXERCISE - Subjective type7videos
F-BLOCK ELEMENTS
- BOOK - GRB PUBLICATIONCHAPTER - HYDROCARBON (ALIPHATIC)EXERCISE - Previous years jee questions28videos
HYDROCARBON (ALIPHATIC)
Similar Questions
Relative humidity id defind as the ration of partial pressure of water in air at a given temperature to the vapour pressure of water at that that temperature Calculate the mass of water per litre air at
(a) 20∘C and 45% relative humidity
(b) 0∘C and 95% relative humidity
(c ) Discuss wether temperature or relative humidity has the greater effect on the mass of water vapour in air Given P∘H2O=17.5 torr at 20∘C and 4.58 torr 0∘C .View SolutionWhat happens if water vapour at a pressure of 0.003 atmosphere is cooled to 0∘C?
View Solution
Knowledge Check
- Question 1 - Select One
The saturated vapour pressure of water at 100∘––C
A750 mm of HgB760 mm of HgC76 mm of HgD7.6 mm of Hg - Question 2 - Select One
The saturation vapour pressure of water at 100∘C is
A739 mm of mercuryB750 mm of mercuryC760 mm of mercuryD712 mm of mercury - Question 3 - Select One
On heating water from 0∘C to 100∘C its volume
AIncreases at each .∘CBFirst increases till 4∘C and then decreasesCFirst decreases till 4∘C and then increasesDRemains same
What is the vapour pressure of a solution of glucose which has an osmotic pressure of 3 atmosphere at 20∘C ? The vapour pressure of water at 20∘C is 17.39 mm. Consider the density of solution equal to that of solvent.
View SolutionWhen the pressure on water is increased the boiling temperature of water as compared to 100∘C will be
View SolutionThe graph which represents the variation of mean kinetic energy of moleules with temperature ∘C is ?
View SolutionThe relation between the volume and temperature of a sample of water in the range 0∘C to 100∘C is best represented as
View SolutionThe vapour pressure of a solution of 5g of non-electrolyte in 100g of water at a particular temperature is 2985Nm−2. The vapour pressure of pure water at that temperature is 3000Nm−2. The molecular weight of the solute is
View Solution

