The graph which represents the variation of mean kinetic energy of moleules with temperature ∘C is ?
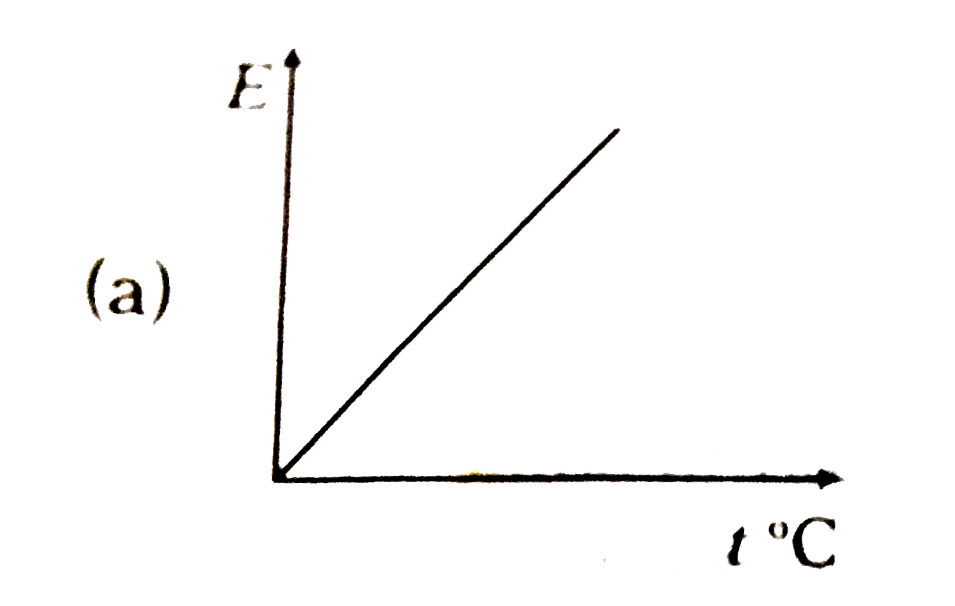
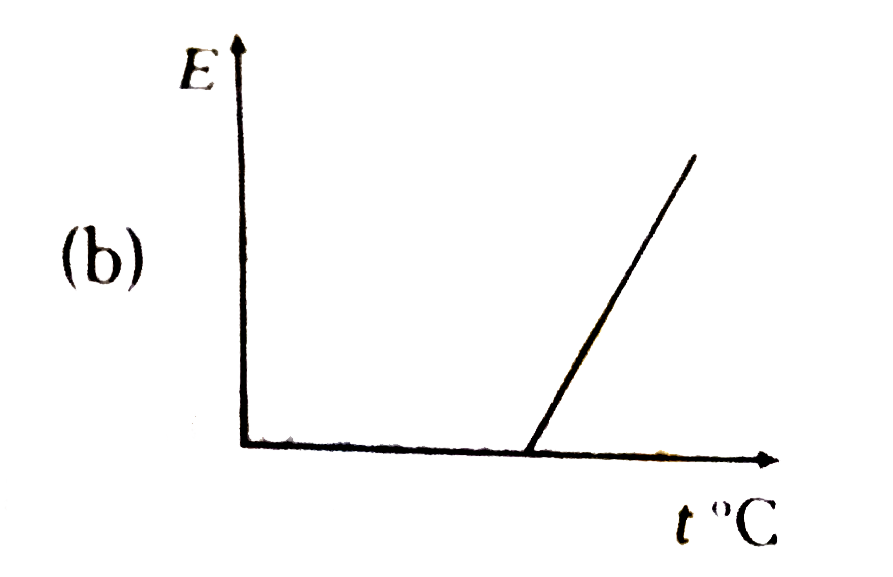
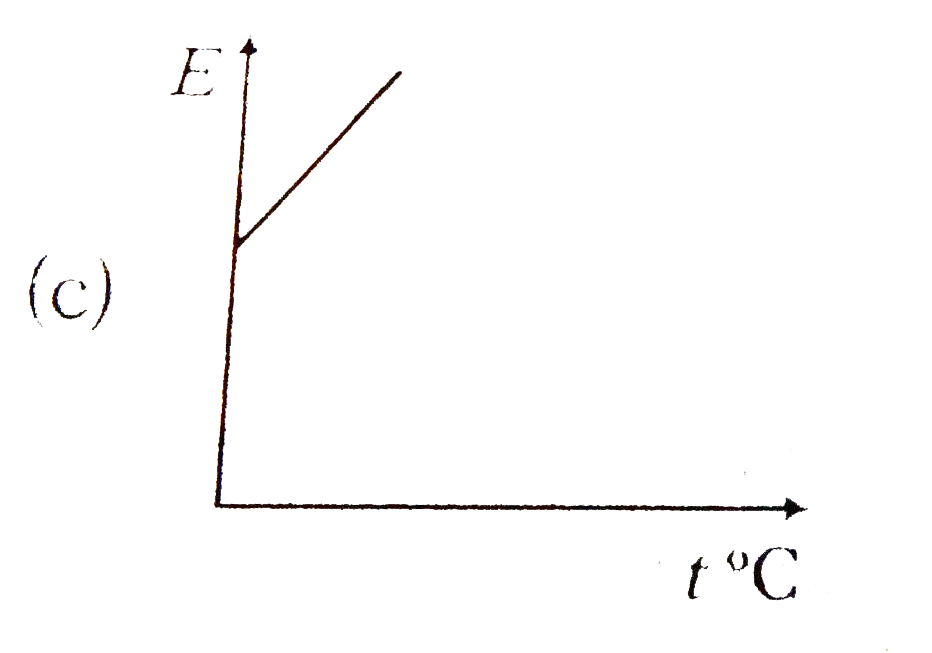
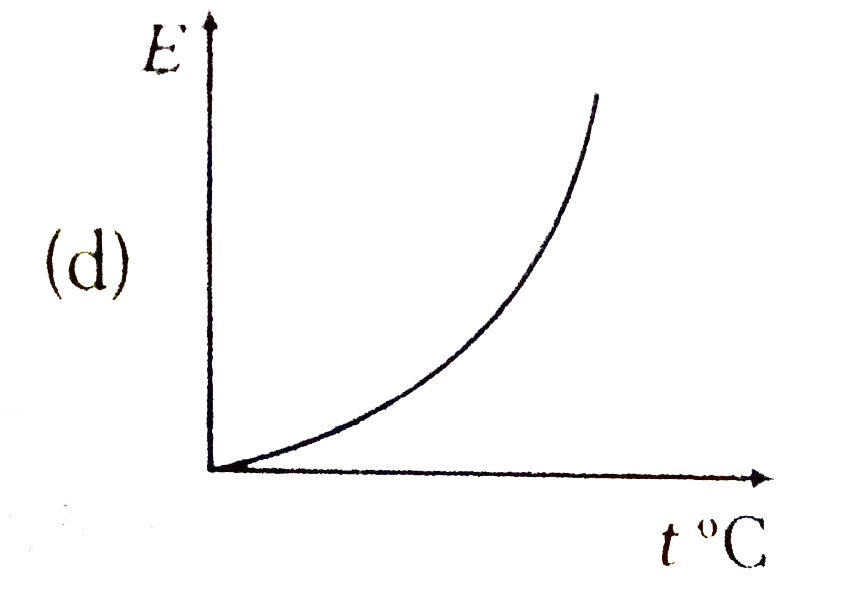
The correct Answer is:C
Mean kinetic energy of gas moleules
E=f2kT=f2k(t+273)=(f2k)t+f2×273k
Comparing it with standard equationof staright line y= mx + c. We get m = f/2 k and c = f/2 273 k. So the graph
between E and t will be straight line with positive intercept on E-axis and positive slope with t-axis
Topper's Solved these Questions
- BOOK - DC PANDEYCHAPTER - THERMOMETRY THERMAL EXPANSION AND KINETIC THEORY OF GASESEXERCISE - A Tacking it together55videos
THERMOMETRY THERMAL EXPANSION AND KINETIC THEORY OF GASES
- BOOK - DC PANDEYCHAPTER - THERMOMETRY THERMAL EXPANSION AND KINETIC THEORY OF GASESEXERCISE - B medical entrance special format questions14videos
THERMOMETRY THERMAL EXPANSION AND KINETIC THEORY OF GASES
- BOOK - DC PANDEYCHAPTER - THERMOMETRY THERMAL EXPANSION AND KINETIC THEORY OF GASESEXERCISE - Check point 14.320videos
THERMOMETRY THERMAL EXPANSION AND KINETIC THEORY OF GASES
- BOOK - DC PANDEYCHAPTER - SUPERPOSITION OF WAVESEXERCISE - Level 2 Subjective8videos
SUPERPOSITION OF WAVES
- BOOK - DC PANDEYCHAPTER - THERMOMETRY,THERMAL EXPANSION & KINETIC THEORY OF GASESEXERCISE - Level 2 Subjective9videos
THERMOMETRY,THERMAL EXPANSION & KINETIC THEORY OF GASES
Similar Questions
Knowledge Check
- Question 1 - Select One
For a simple harmonic oscillator moving along a straight line, the graphs which represent the variation of kinetic energy K, potential energy U and total energy T with displacement are
A B
B C
C D
D
- Question 2 - Select One
At a constant pressure, of the following graphs that one which represents the variation of the density of an ideal gas with the absolute temperature T, is
A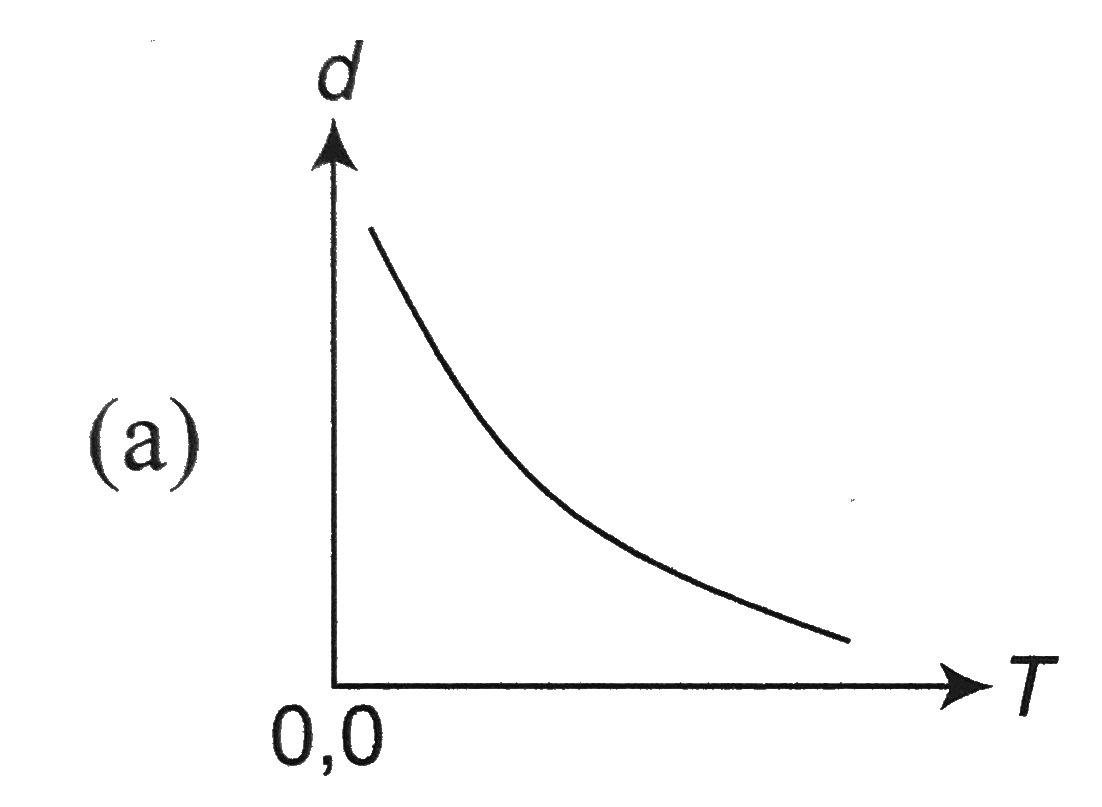 B
B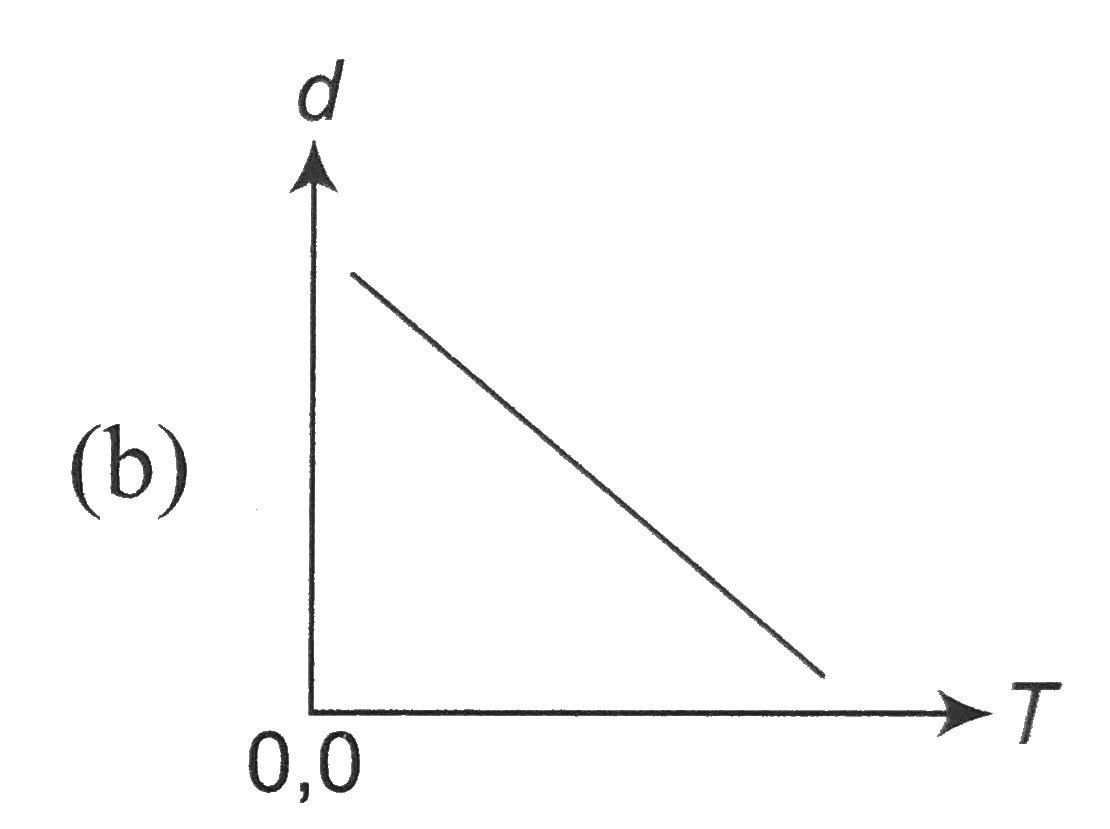 C
C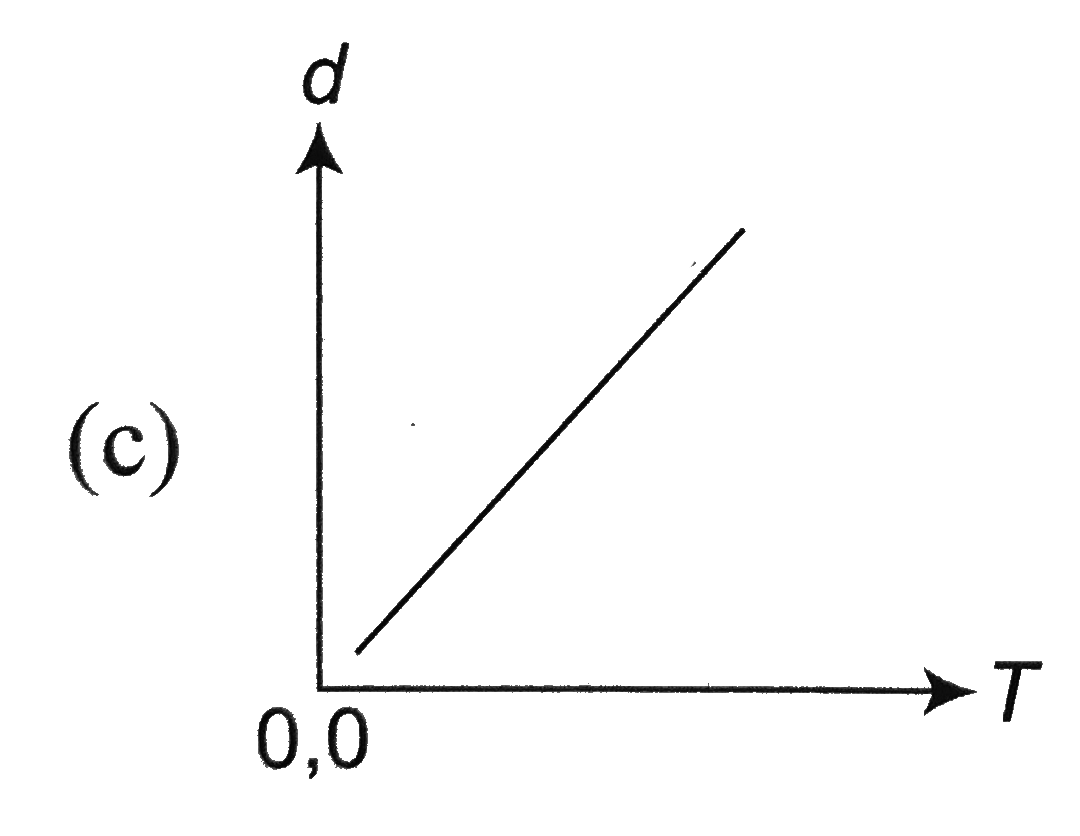 D
D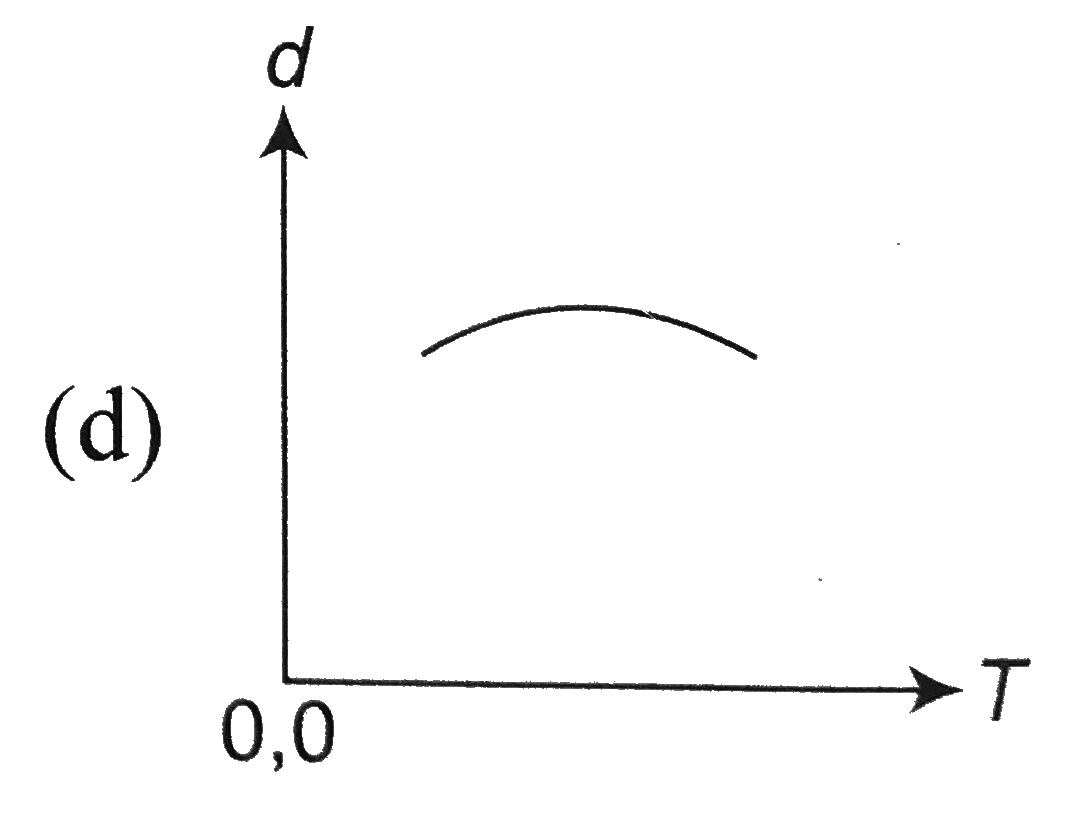
- Question 3 - Select One
The correct graph which shows the variation of paramagnetic susceptibility S with temperature T is
A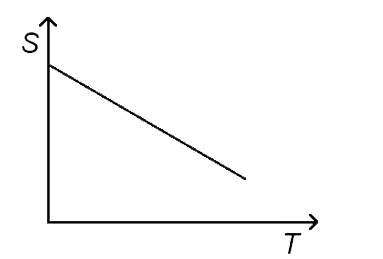 B
B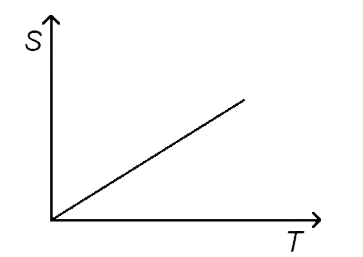 C
C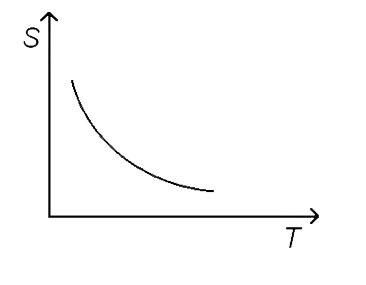 D
D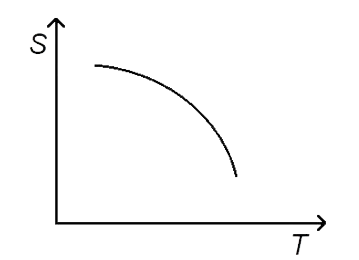
which of the following graph represents the variation of resistivity (ρ) with temperature (T) for copper?
View SolutionA body moves from rest with a constant ac- celeration. Which of the following graphs represents the variation of its kinetic energy (E) with distance travelled (x)?
View SolutionA body moves from rest with a constant acceleration. Which one of the following graphs represents the variation of its kinetic energy K with the distance travelled x?
View SolutionA body moves from rest with a constant acceleration. Which one of the following graphs represents the variation of its kinetic energy K with the distance travelled x?
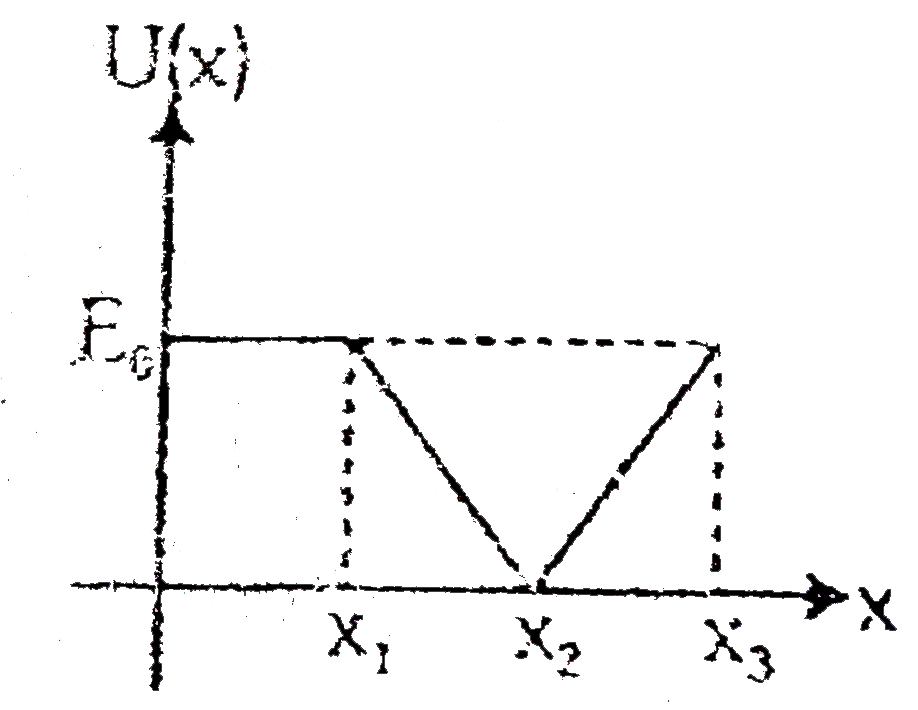
View SolutionThe potential energy U(x) of a particle moving along x−axis is shown in figure. Which one of the following graphs represents the variation of kinetic energy of this particel if its total mechanical enery is E0
 View Solution
