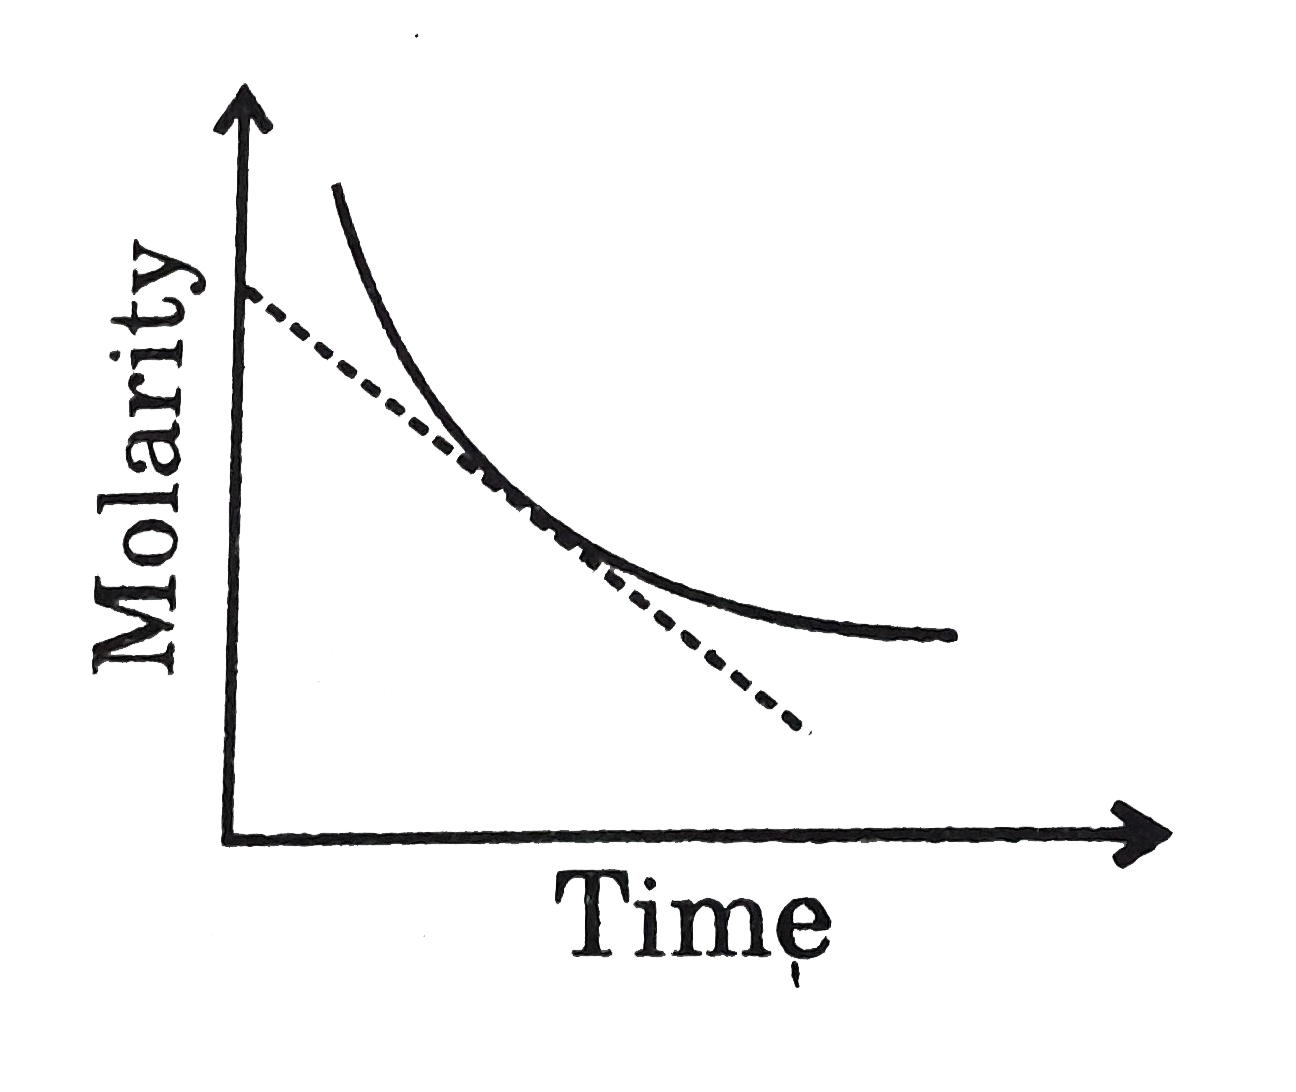
What quantity is represented by the slope of the dashed line in the accompanying diagram for the concentration change in a reaction ?

Instantaneous reaction rate
Rate constant
Reaction order for that reactant
Activation energy
The correct Answer is:A
Step by step video, text & image solution for What quantity is represented by the slope of the dashed line in the accompanying diagram for the concentration change in a reaction ? by Chemistry experts to help you in doubts & scoring excellent marks in Class 12 exams.
Updated on:21/07/2023Topper's Solved these Questions
- GRAPHICAL INTERPRETATIONBOOK - GRB PUBLICATIONCHAPTER - GRAPHICAL INTERPRETATIONEXERCISE - I.Electrochemistry
1 Videos
- GRAPHICAL INTERPRETATIONBOOK - GRB PUBLICATIONCHAPTER - GRAPHICAL INTERPRETATIONEXERCISE - Electrochemistry
9 Videos
- GRAPHICAL INTERPRETATIONBOOK - GRB PUBLICATIONCHAPTER - GRAPHICAL INTERPRETATIONEXERCISE - H. Chemical Kinetics
1 Videos
- F-BLOCK ELEMENTSBOOK - GRB PUBLICATIONCHAPTER - F-BLOCK ELEMENTSEXERCISE - Subjective type
7 Videos
- HYDROCARBON (ALIPHATIC)BOOK - GRB PUBLICATIONCHAPTER - HYDROCARBON (ALIPHATIC)EXERCISE - Previous years jee questions
28 Videos
Similar Questions
Knowledge Check
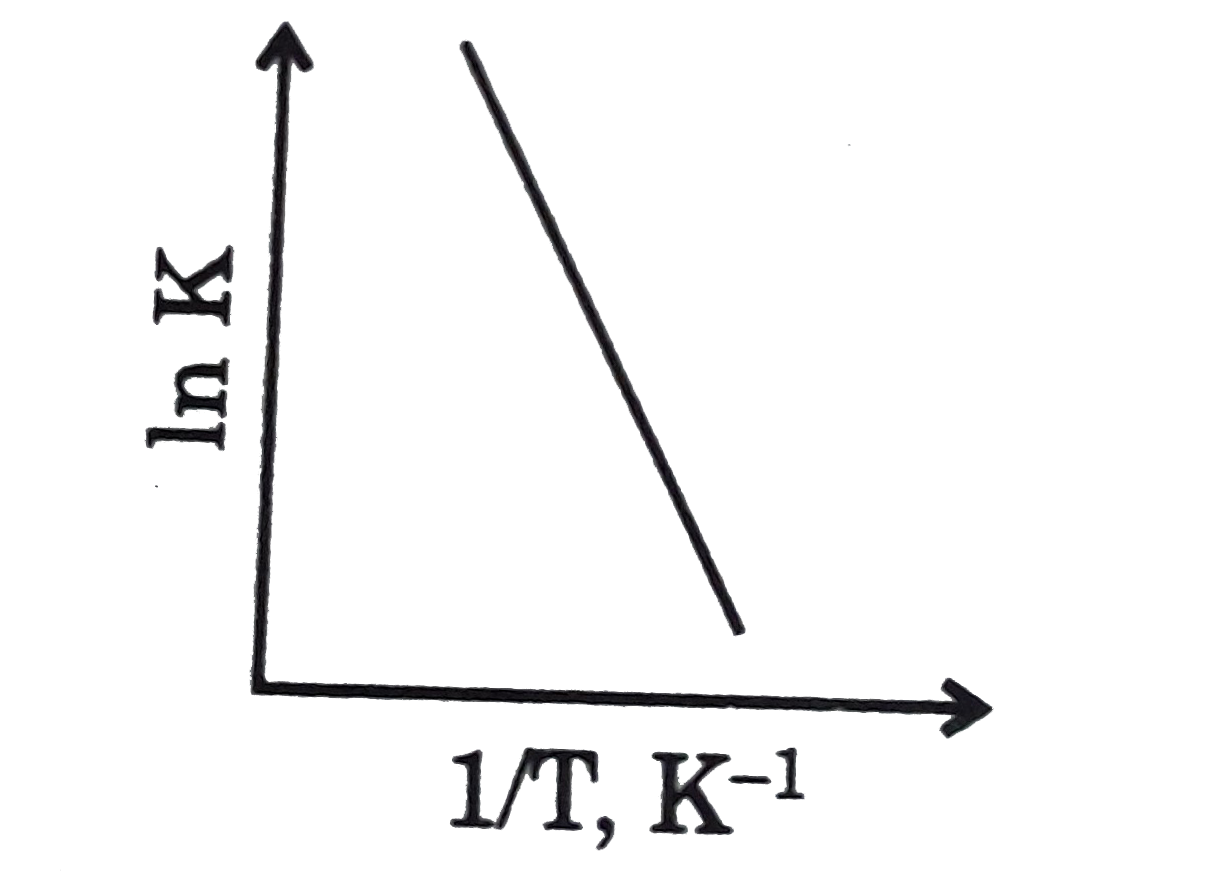
What quantity is represented by the slope of the line in this graph of the temperature dependence of the natural log of an equilibrium constant ?
 A−ΔG∘B−ΔG∘/RC−ΔH∘D−ΔH∘/R
The slope of the straight line obtained by plotting rate versus concentration of reactant in a first order reaction is
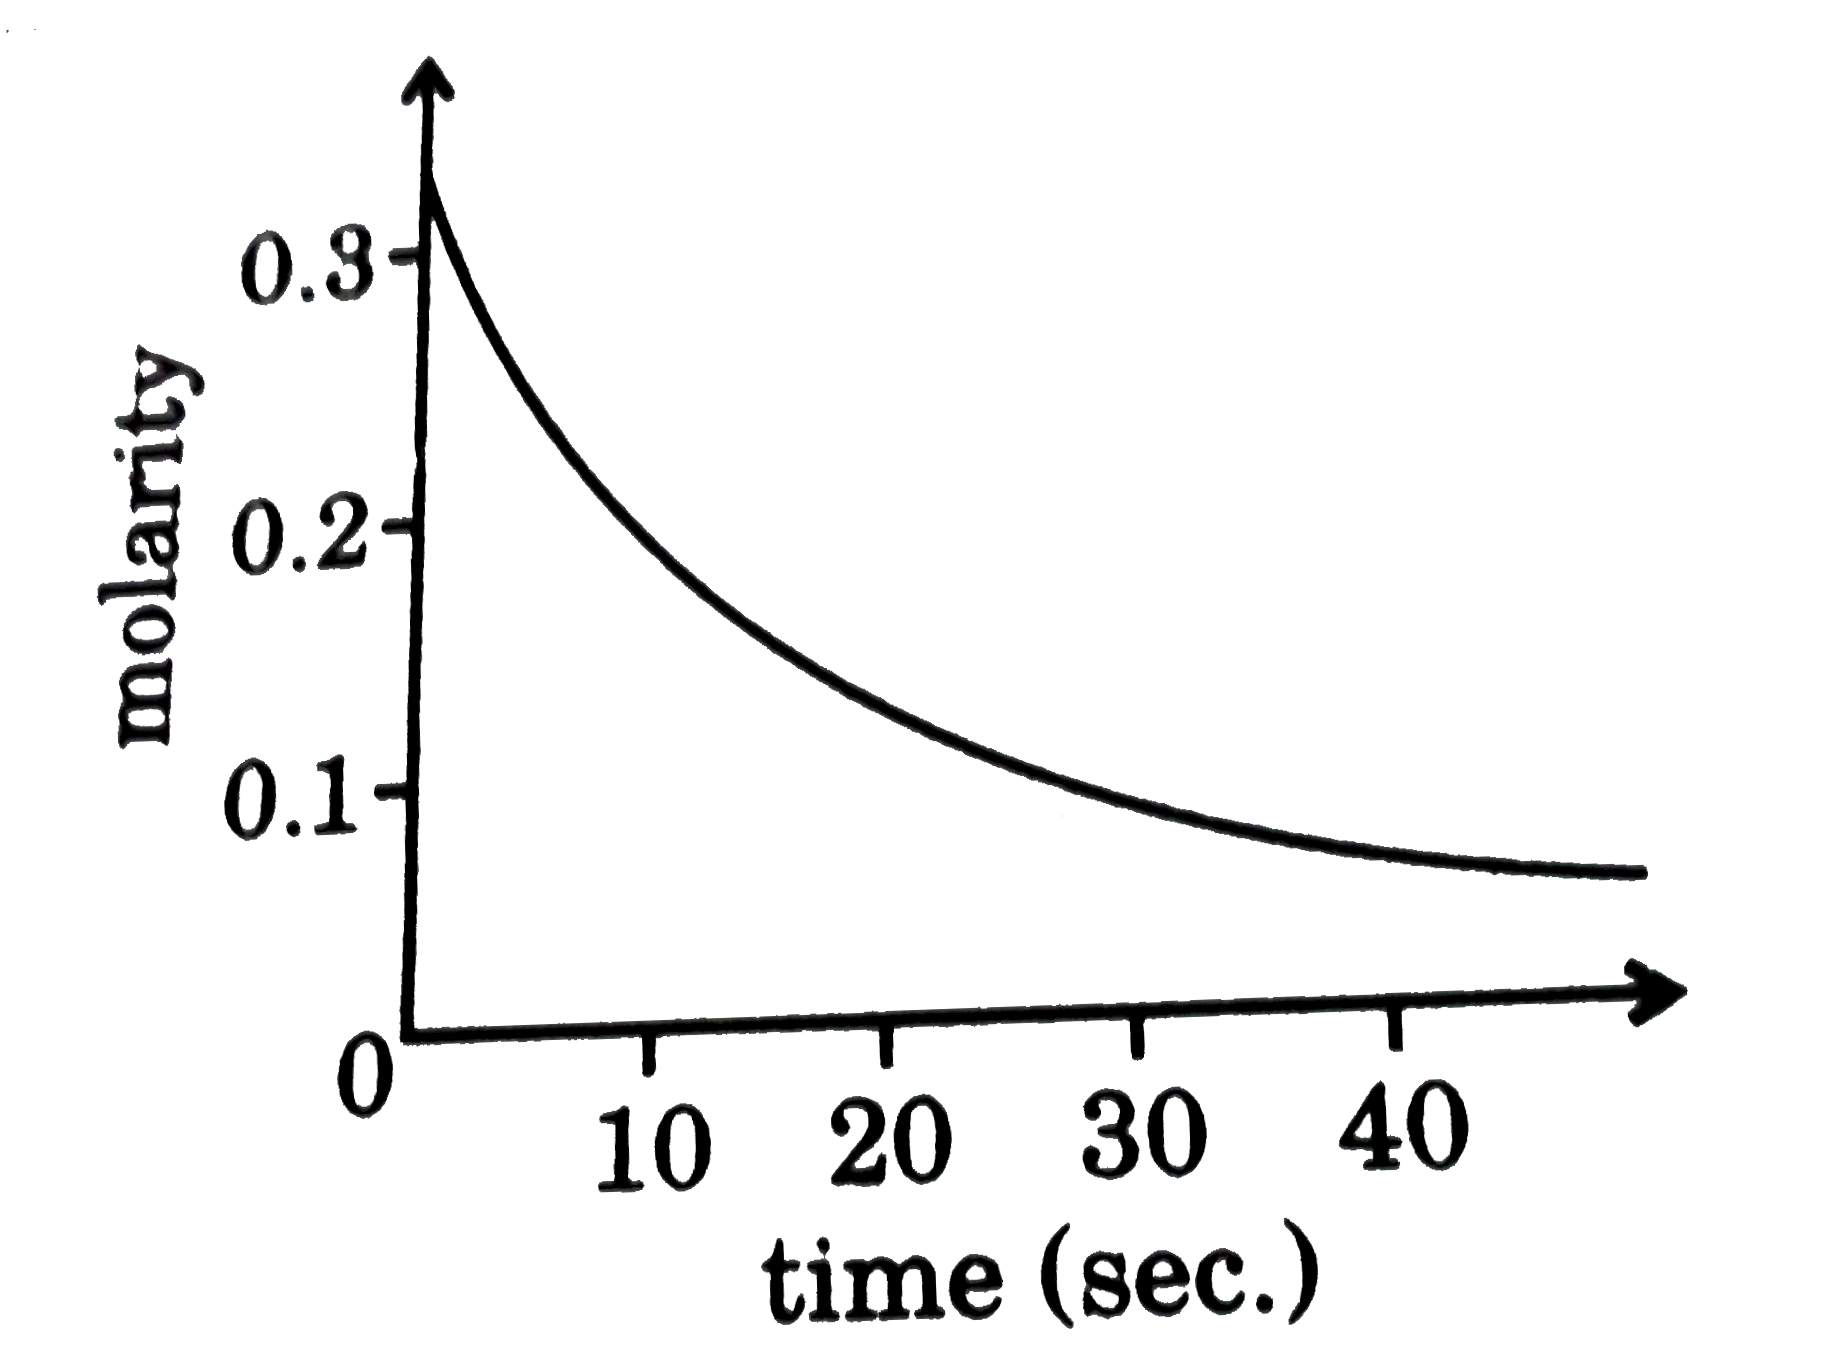
A−kB−k2.303Ck2.303DkFor the reaction represented by the accompanying diagram, which reaction rate is the greatest ?
 AAverage rateBFinal rateCInitial rateDRate at 20 seconds
Name the quantity that represents rate of change of velocity ?
View SolutionWhat is slope of a straight line?
View SolutionThe reaction A+B→ products is first order in each of the reactants.
(a) How does the rate of reaction change if the concentration of A is increased by factor 3 ?
(b) What is the change in the rate of reaction if the concentration of A is halved and concentration of B is doubled ?
View SolutionEnergy changes accompanying the chemical reactions can take place :
View SolutionThe enthalpy change of a reaction represents.
View Solution
