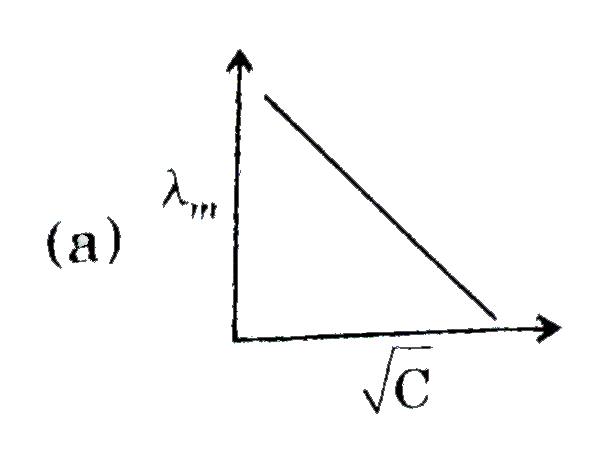
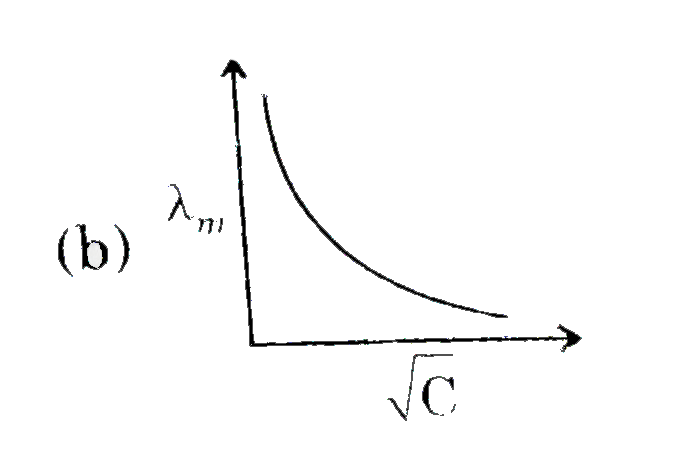
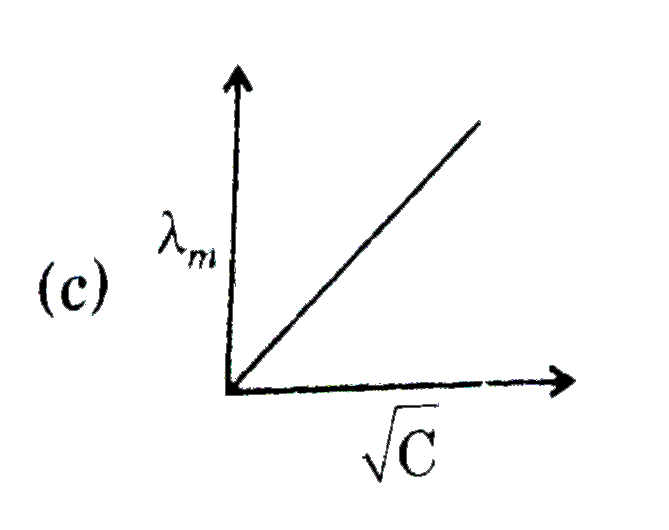
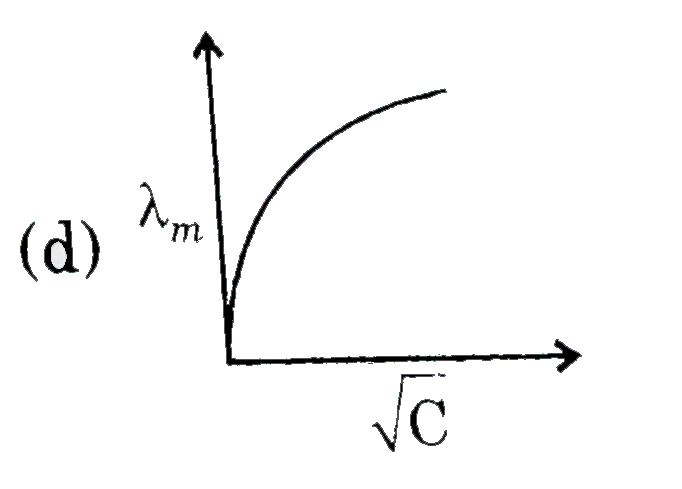
Which of the following curve represents the variation of λm with √C for AgNO3?
A
B
C
D
Text Solution
The correct Answer is:A
|
Topper's Solved these Questions
- GRAPHICAL INTERPRETATIONBOOK - GRB PUBLICATIONCHAPTER - GRAPHICAL INTERPRETATIONEXERCISE - Multiple Objective Type
68 Videos
- GRAPHICAL INTERPRETATIONBOOK - GRB PUBLICATIONCHAPTER - GRAPHICAL INTERPRETATIONEXERCISE - Comprehension 1
1 Videos
- GRAPHICAL INTERPRETATIONBOOK - GRB PUBLICATIONCHAPTER - GRAPHICAL INTERPRETATIONEXERCISE - I.Electrochemistry
1 Videos
- F-BLOCK ELEMENTSBOOK - GRB PUBLICATIONCHAPTER - F-BLOCK ELEMENTSEXERCISE - Subjective type
7 Videos
- HYDROCARBON (ALIPHATIC)BOOK - GRB PUBLICATIONCHAPTER - HYDROCARBON (ALIPHATIC)EXERCISE - Previous years jee questions
28 Videos
Similar Questions
Knowledge Check
Which of the following curve represents the variation of λM with √C for AgNO3?
A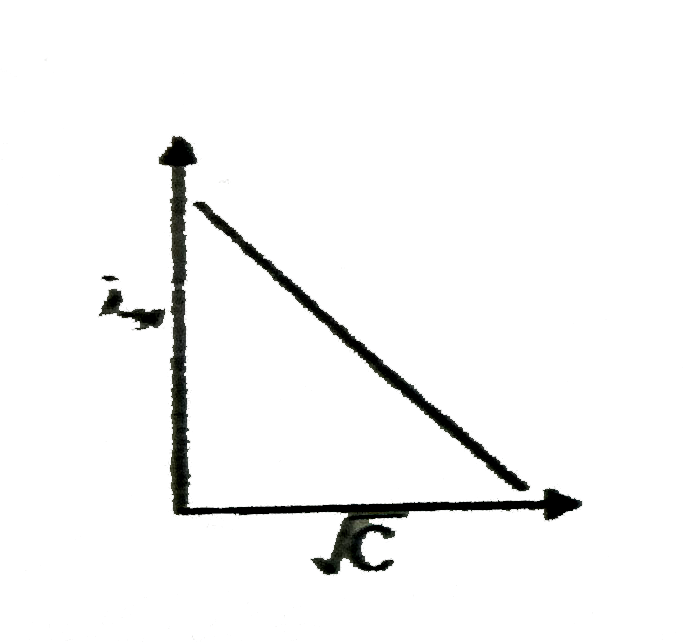 B
B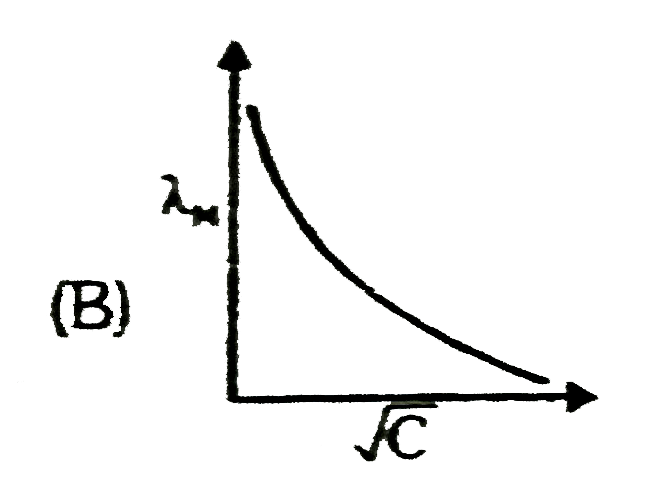 C
C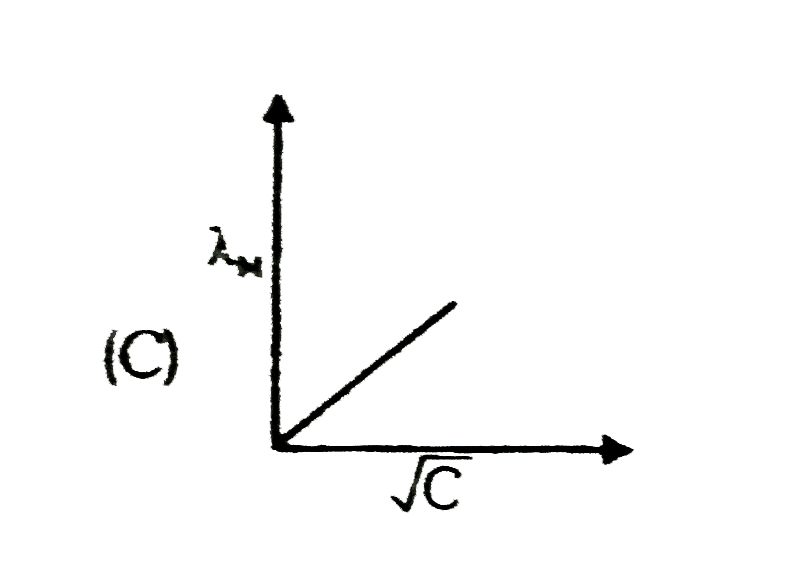 D
D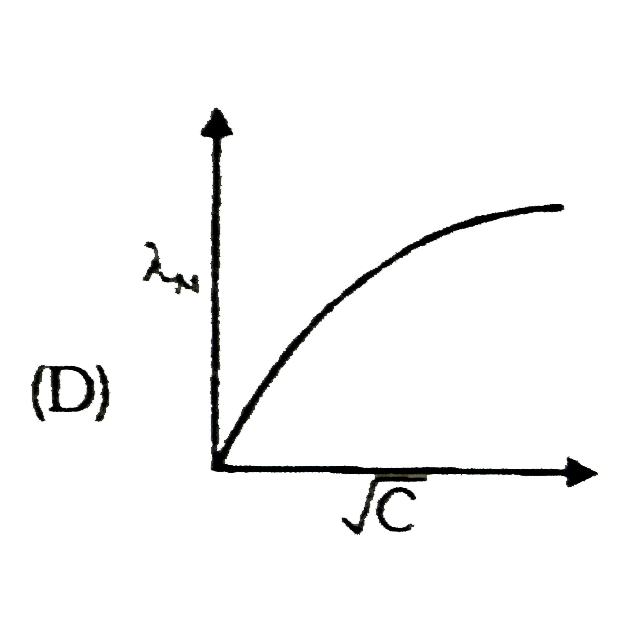
Which of the following curve gives the variation of λm with √C for CH3COOH ?
A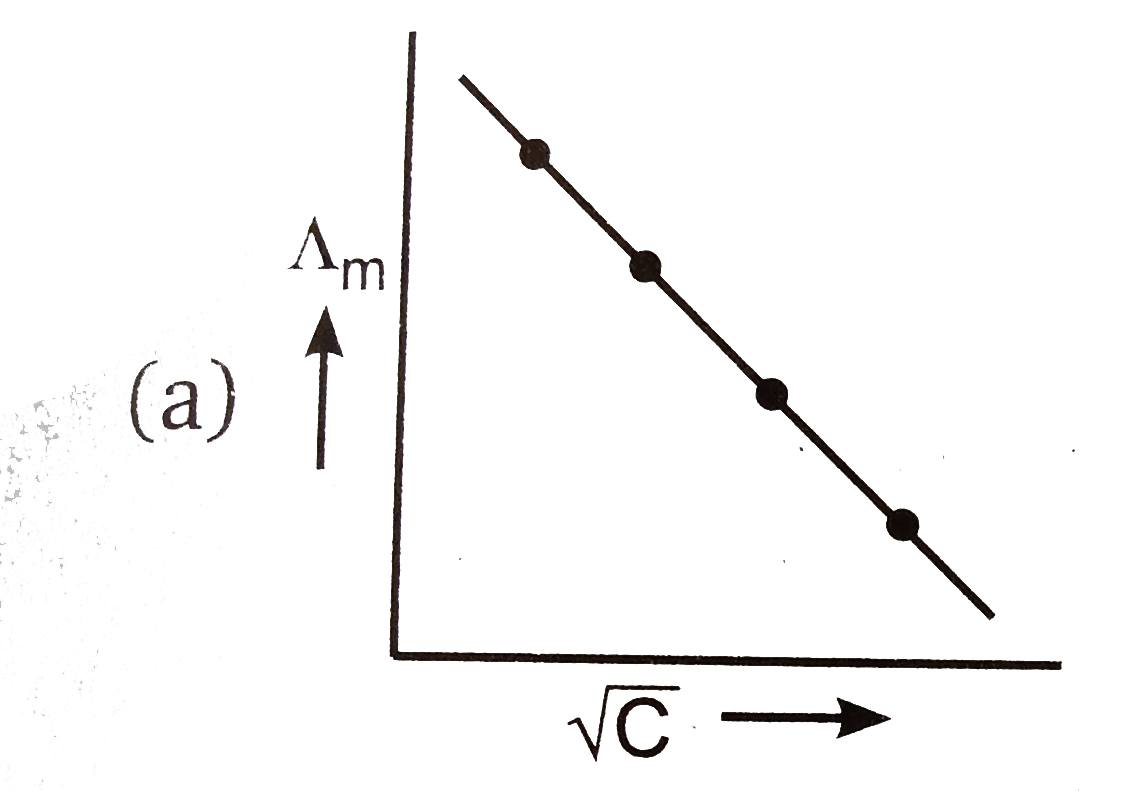 B
B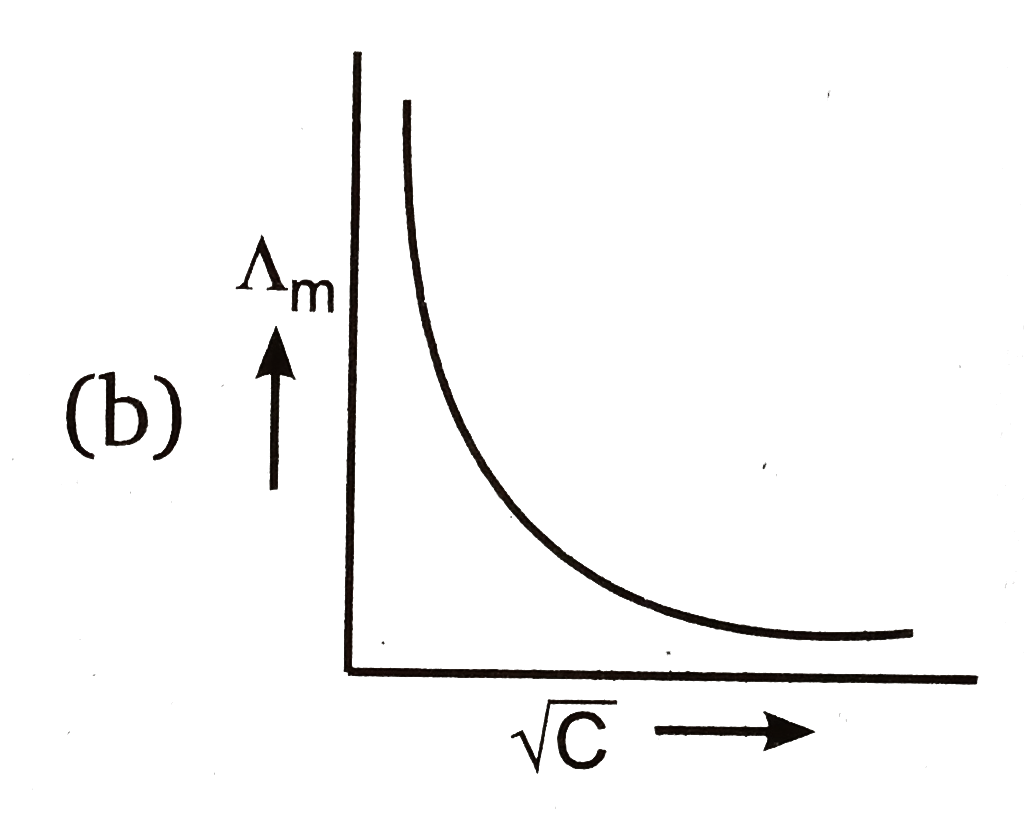 C
C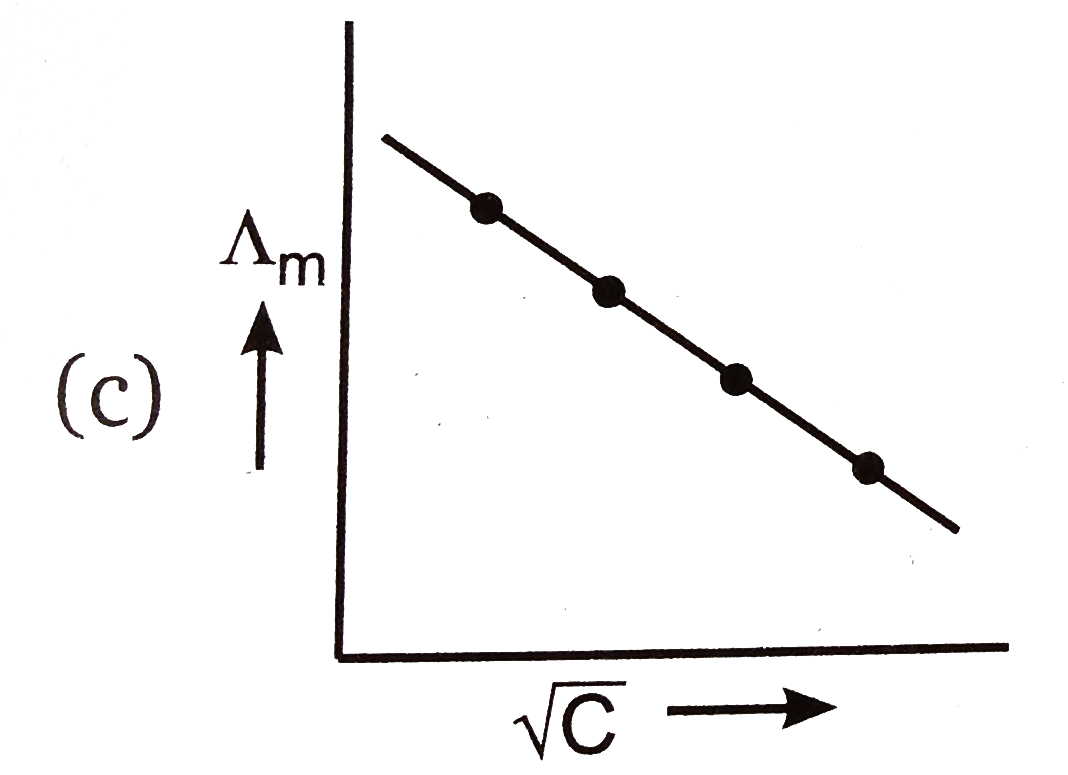 D
D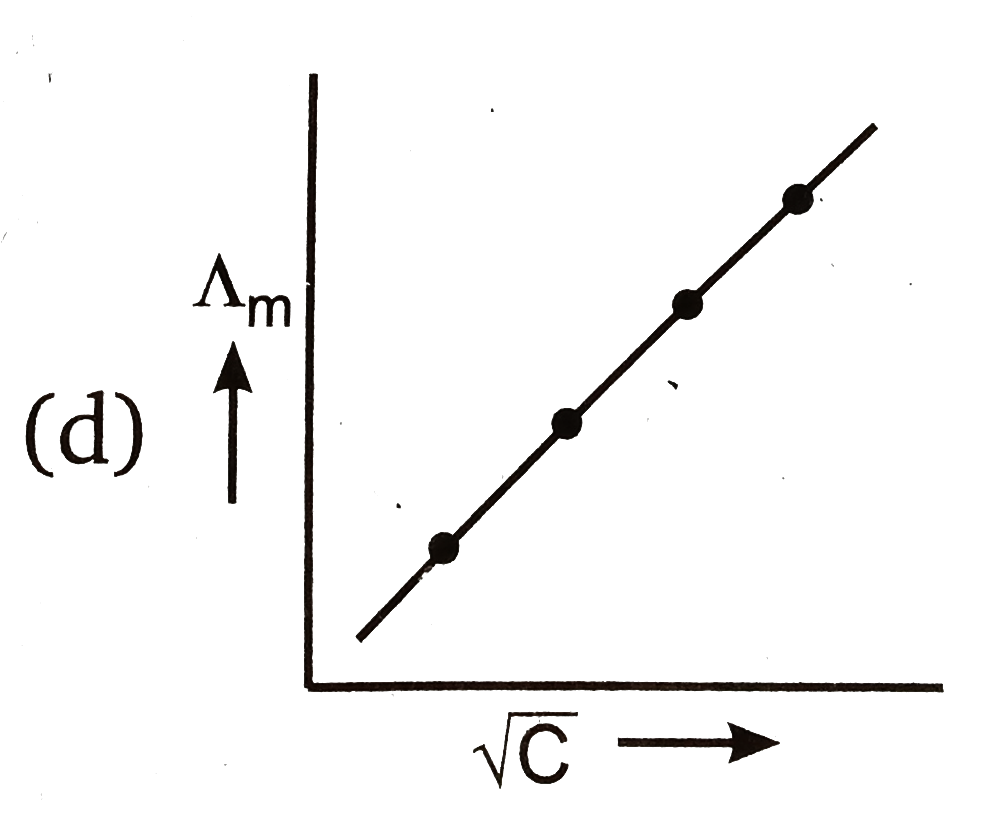
Which of the following curve gives the variation of Λm with √C for CH3COOH ?
A B
B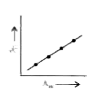 C
C Dnone of these.
Which of the following curve gives the variation of Λ∘m with √C to CH3COOH?
View SolutionWhich of the following curve gives the variation of Λmwith√C for CH3COOH ?
View SolutionWhich of the following curve gives the variation of Λmwith√C for CH3COOH ?
View SolutionWhich of the following curve gives the variation of ∧∞m with √c for CH3COOH
View SolutionWhich of the following curves represents the variation of impedance (Z) with frequency f in series LCR circuit?
View Solution
