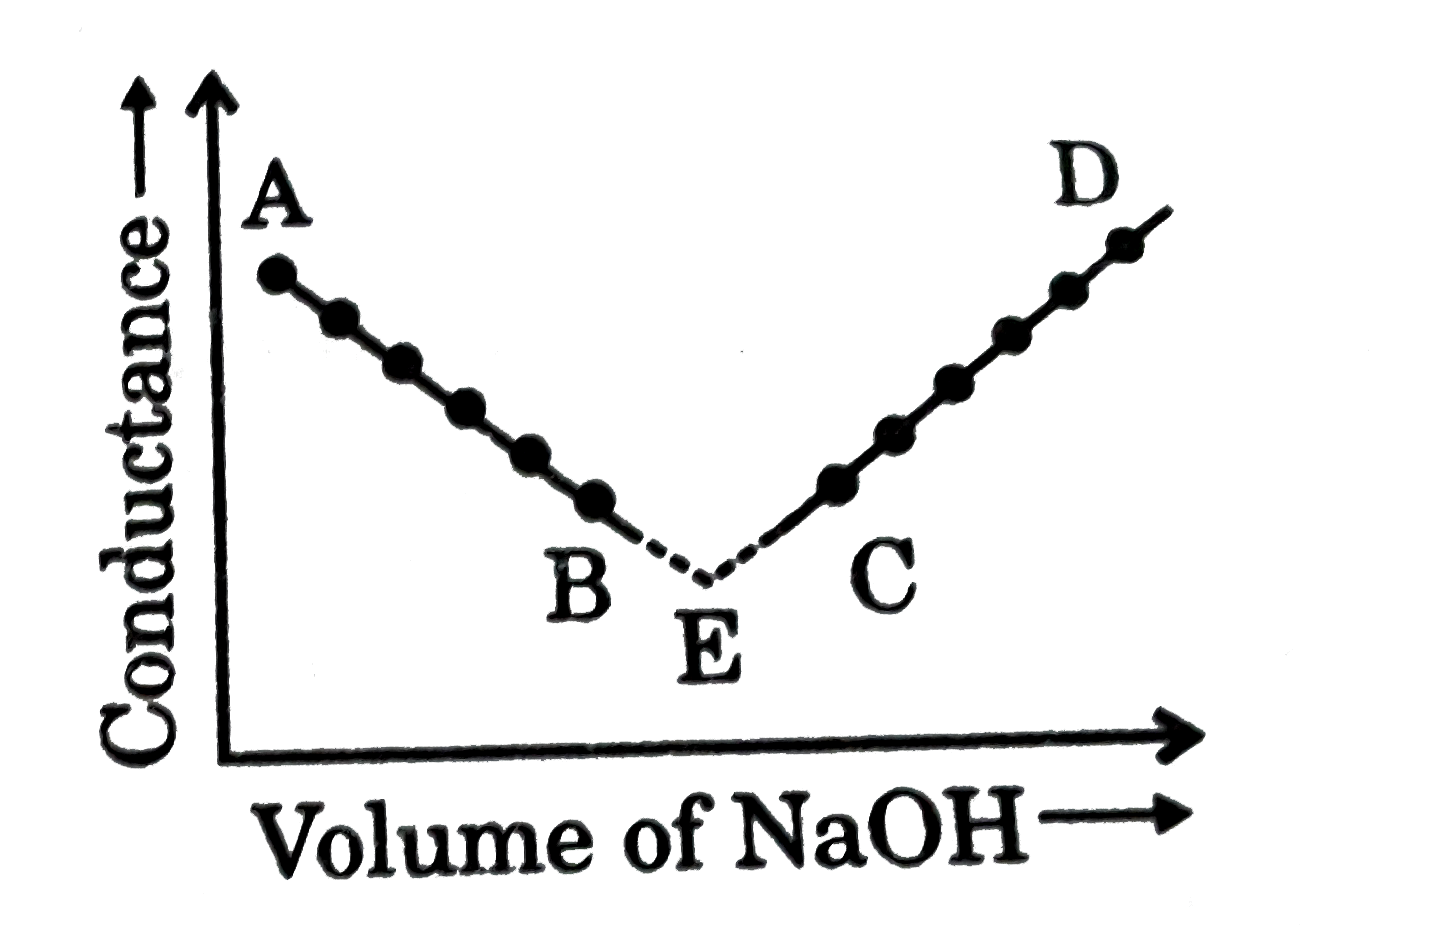
The principle on conductometric titration is based in the fact that during the titration, one of the ions is replaced by the other and invariably thses two ions differ in the ionic conductivity with the result that the conductivity of the solution varies during the course of the titration.Take,for example,the titration between strong acid, say HCl. and a strong base, say NaOH.Before NaOH is added the conuctance of HCl solution has a high value due ti the persence if highly hydrogen ions.As NaOH is added,H+ ions are the replaced by relatively slower moving Na+ ions.Consequently, the conductance of the solution decrease and this continues right upto the enuivalence point where the solution contains only NaCL.Beyond the equivalence point if more of NaOH is added, then the solution contains an excess of the fast moving OH− with the result that its as more of NaoH added, we plot the conductance value vs the amount of NaOH added we get curve of the type shown in figure.The descending portion AB represents the conductance before the equivalence point (solution cintains a mixture if acid HCl and the salt NaCL and the ascending portion CD represents the conductances after the equivalence point (solution contains the salt NaCL and the excess of NaOH). The point E which repersents only the minimum conductance is alkali and thus repersents the equivalence point.This point can, however, be obtained by the extrapoltion of the lines AB and CD and therefore one is not very particular in location this point experimentally as it is in the case of ordinary acid -base involving the acid base indicators 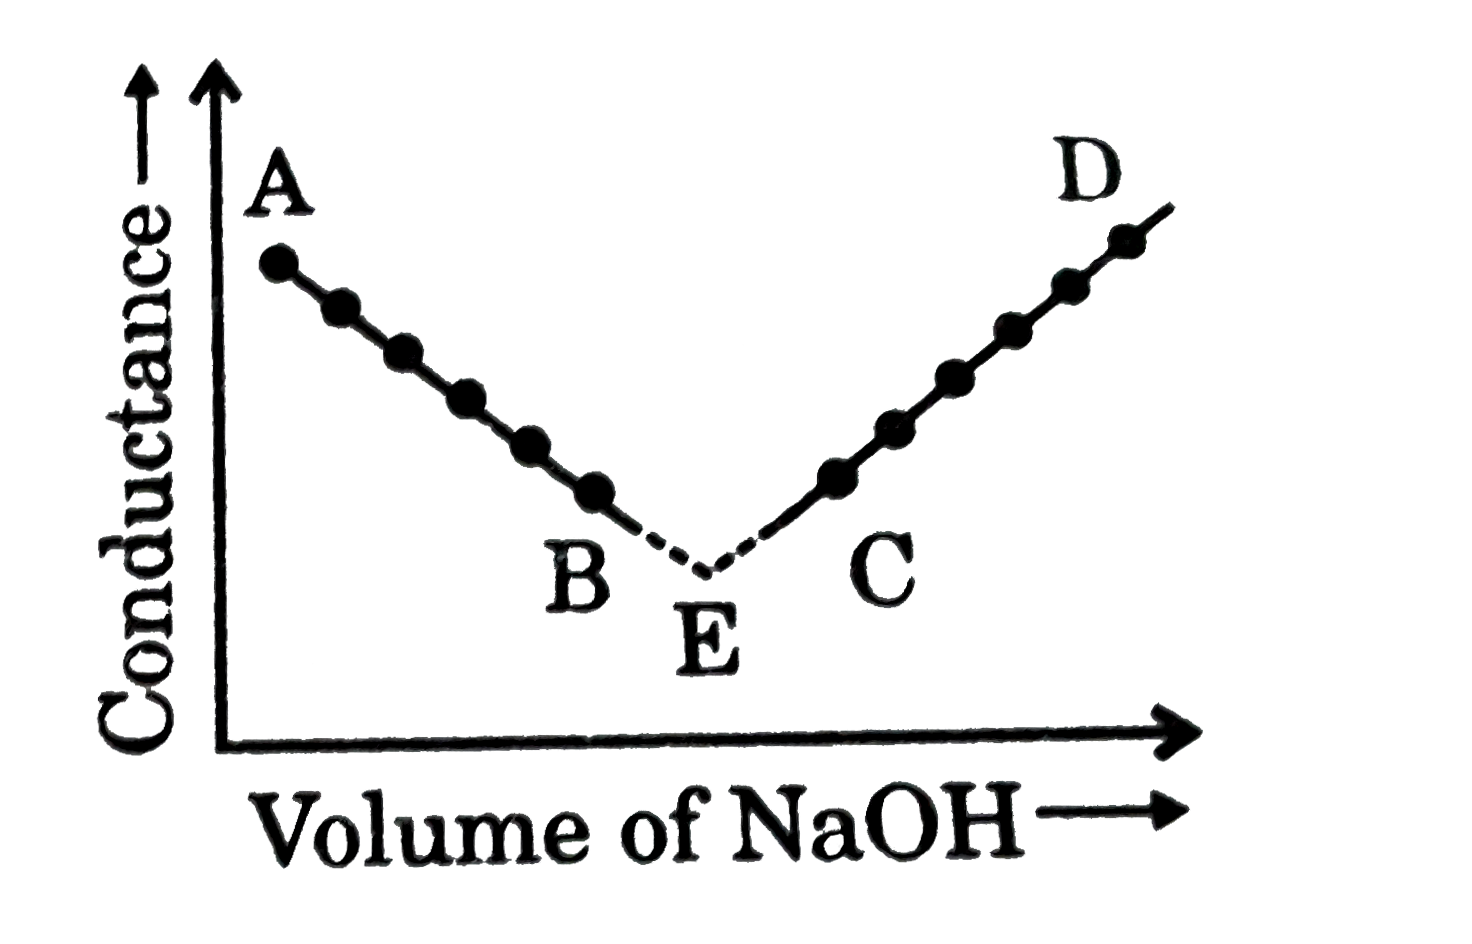
LET us take the specific exaanple of acetic acid being titration against NaOH.Before the addition the of alkali, the solution shows poor conductance due to feeble inization of acetic acid.Initially the addtion of alkali causes not only the replacement of H+ by Na+ but also suppresses the thus the conductance of the solution decrease in the begnning .But very soon the conductance starts increasing as addetion NaOH thus causing neutralizes the undissociated HAc to HAc with strong condutance eletroyte Na+Ac−.The increase in conducting OH− ions gtthe graph near the highly equivalence point actual equivalence point can as usual be ontained by the extrapoiation method
In all thses graphs it been assumed that the vloume change due addition of solution from burette in negligible heane vloume change of the sloution in beaker the conuctance of which is measured is almost constant throughout the measurement
the nature of curve obtained for the titration between weak acid vs strong base as described in the above will be
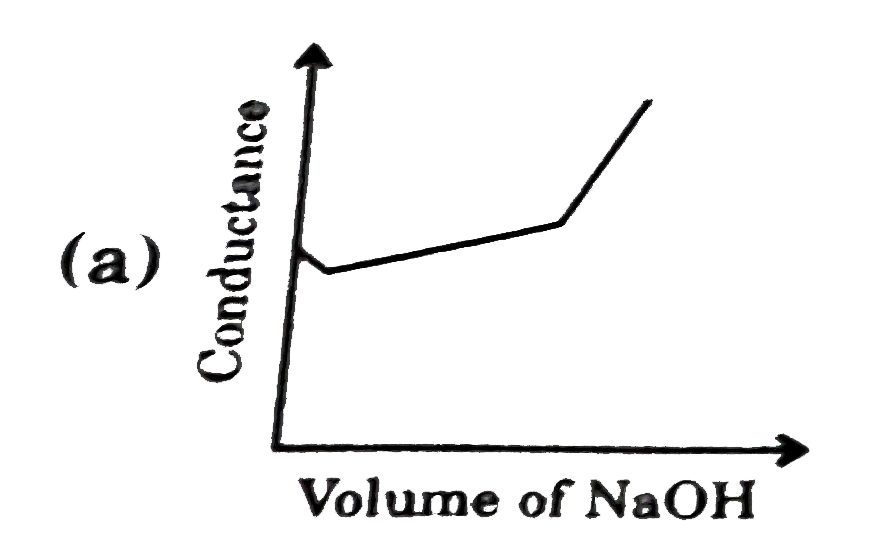
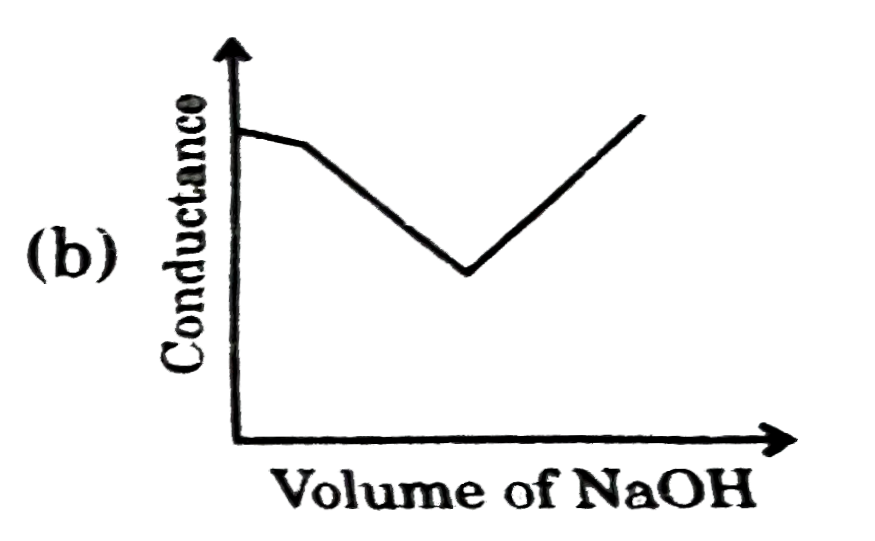
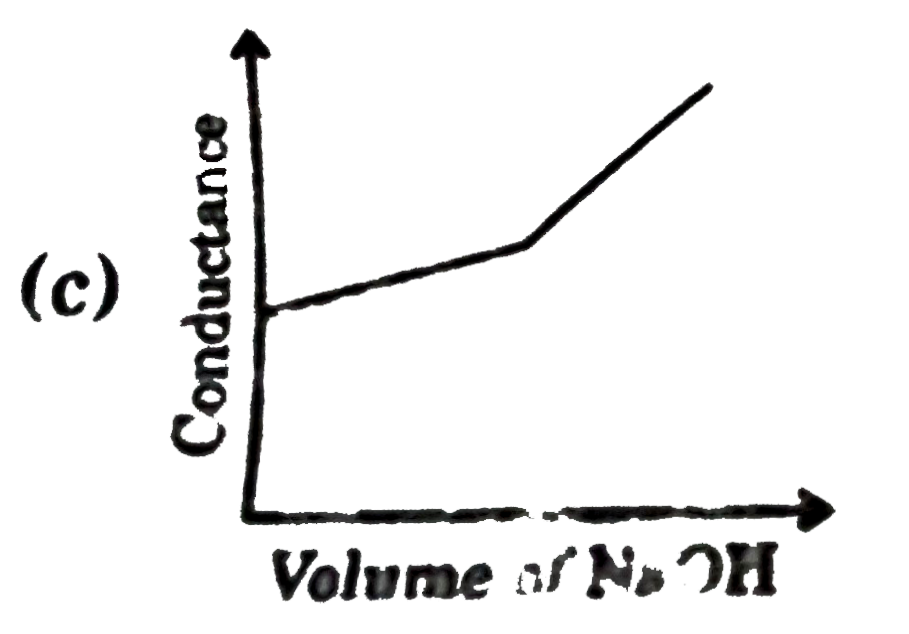
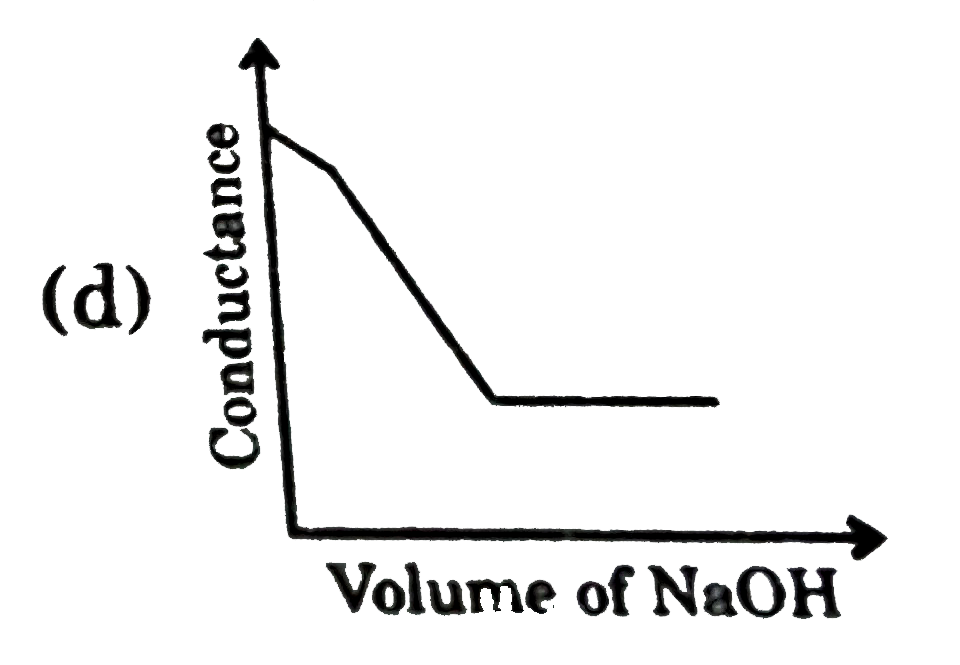
The correct Answer is:A
Topper's Solved these Questions
- GRAPHICAL INTERPRETATIONBOOK - GRB PUBLICATIONCHAPTER - GRAPHICAL INTERPRETATIONEXERCISE - Comprehension 11
1 Videos
- GRAPHICAL INTERPRETATIONBOOK - GRB PUBLICATIONCHAPTER - GRAPHICAL INTERPRETATIONEXERCISE - Comprehension 12
1 Videos
- GRAPHICAL INTERPRETATIONBOOK - GRB PUBLICATIONCHAPTER - GRAPHICAL INTERPRETATIONEXERCISE - Comprehension 9
1 Videos
- F-BLOCK ELEMENTSBOOK - GRB PUBLICATIONCHAPTER - F-BLOCK ELEMENTSEXERCISE - Subjective type
7 Videos
- HYDROCARBON (ALIPHATIC)BOOK - GRB PUBLICATIONCHAPTER - HYDROCARBON (ALIPHATIC)EXERCISE - Previous years jee questions
28 Videos
Similar Questions
Titration are one of the methods we can use to discover the precise concentration of solutions. A typical titration involves adding a solution from a burette to another solution in a flask. The end point of the titration is found by watching a colour change taking place.However, a problem arises when a suitable indicator cannot be found, or when the colour change involved are unclear. In these cases, redox potential may sometimes come to the rescue.
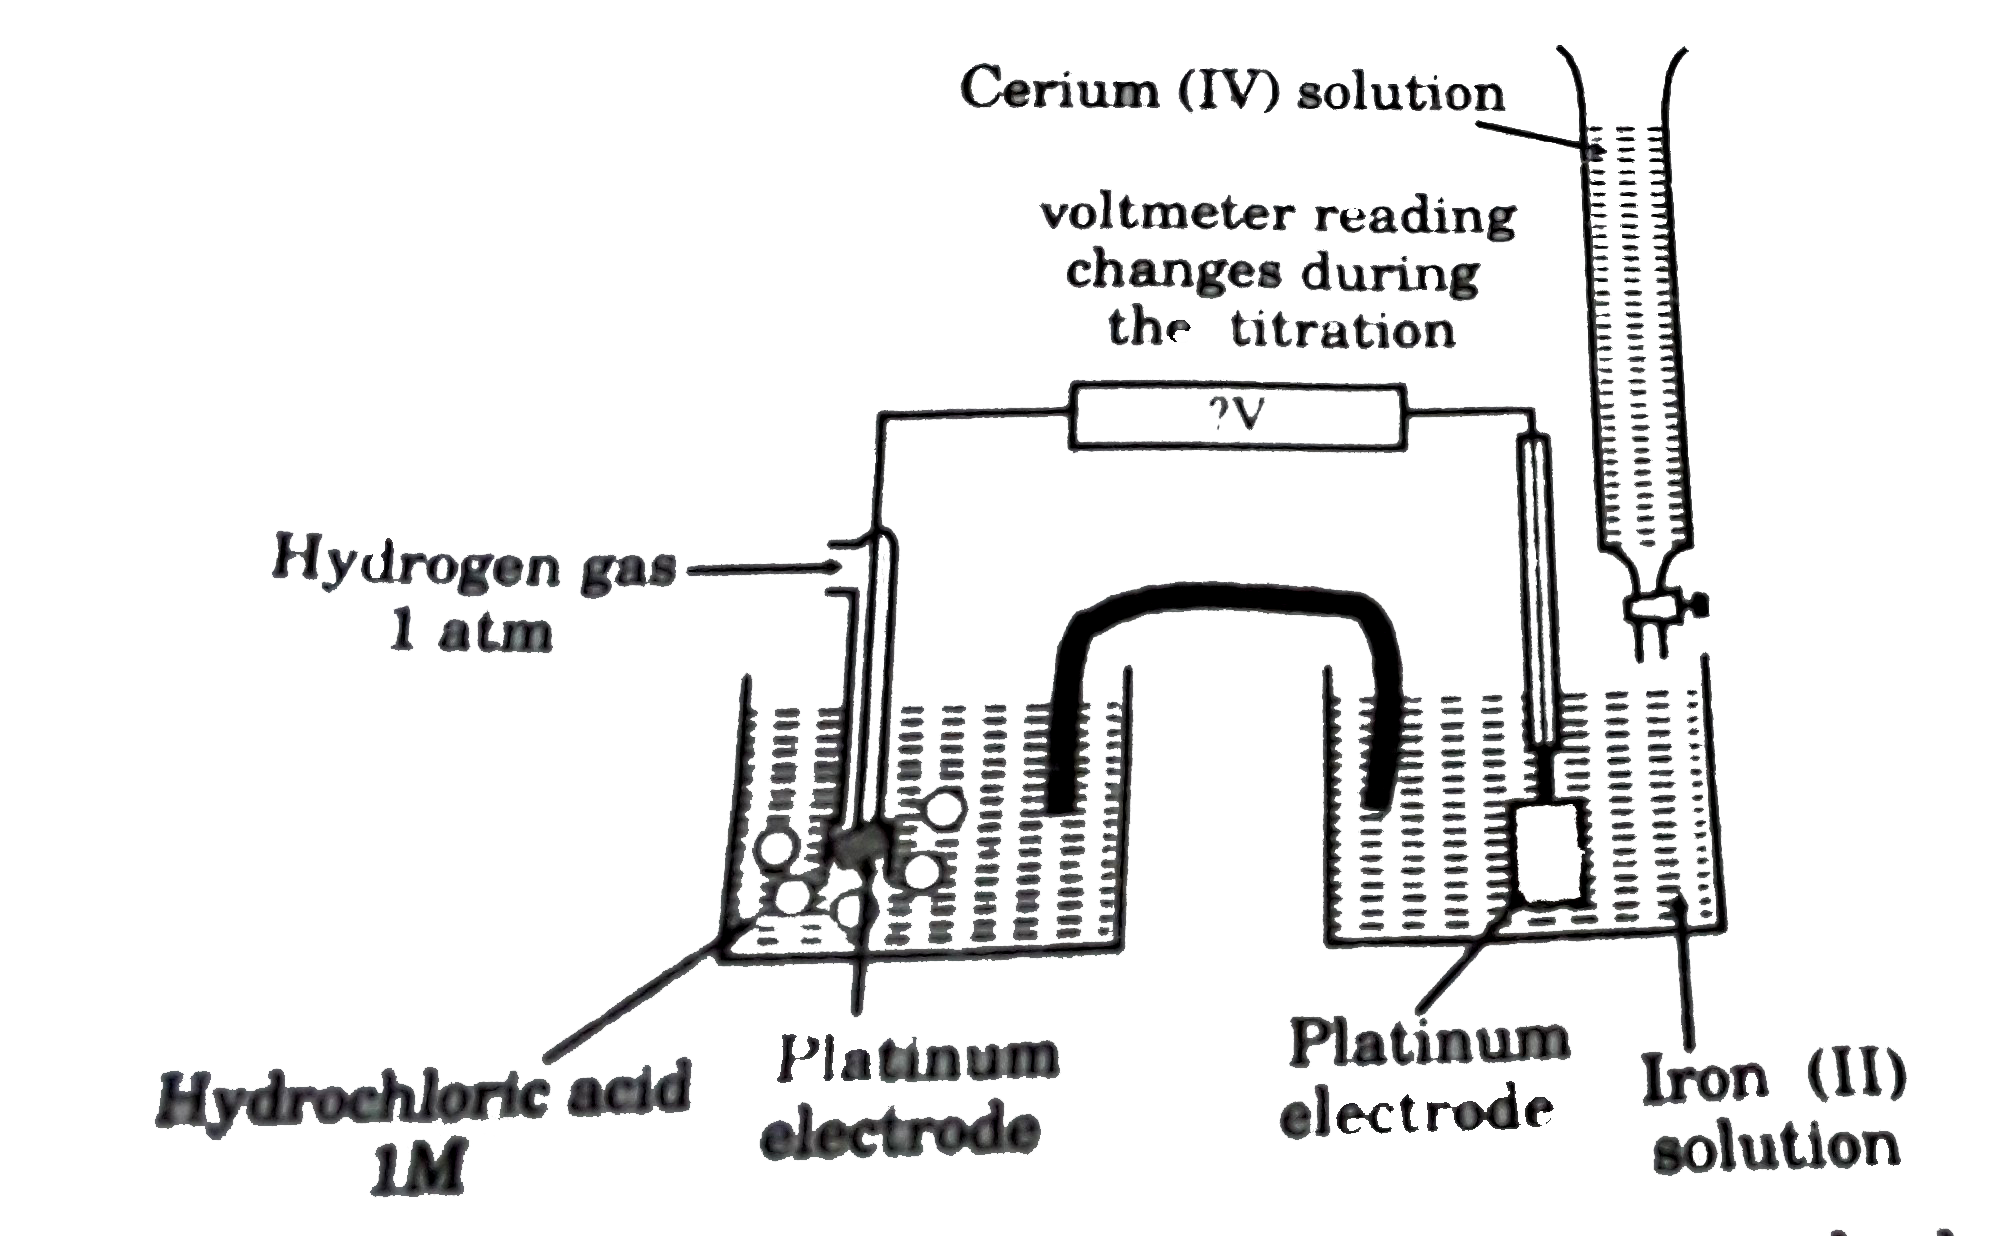
A perticularly well known example (Fig.) is a method of discovering then concentration of iron (II) ions in a solution by titrating them with a solution of cerium (IV). The redox potential that are of interest here areE∘Fe3+∣Fe2+=0.77VandE∘Ce4+∣Ce3+=1.61V. These tell us that cerium (IV) ions are the oxidising agents. They should react according to the equation
Fe2+(aq)+Ce4+(aq)→Fe3+(aq)+Ce3+(aq).
Now imagine that we know the concentration of the cerium (IV) ions solution in the burette. We want to measure the concentration of the cerium (IV) solution from the burette, some of the iron (II) ions are will be oxidised. As a consequence the beaker would now contain large number of unreacted iron (II) ions , but also some iron (III) ions as well. All of the cerium (III). The solution in the beaker now represents an iron (III)/iron(II) half cell although not at standard conditions.Thus , the emf of the cell will be near, but not equal to E∘Fe3+∣Fe2+.
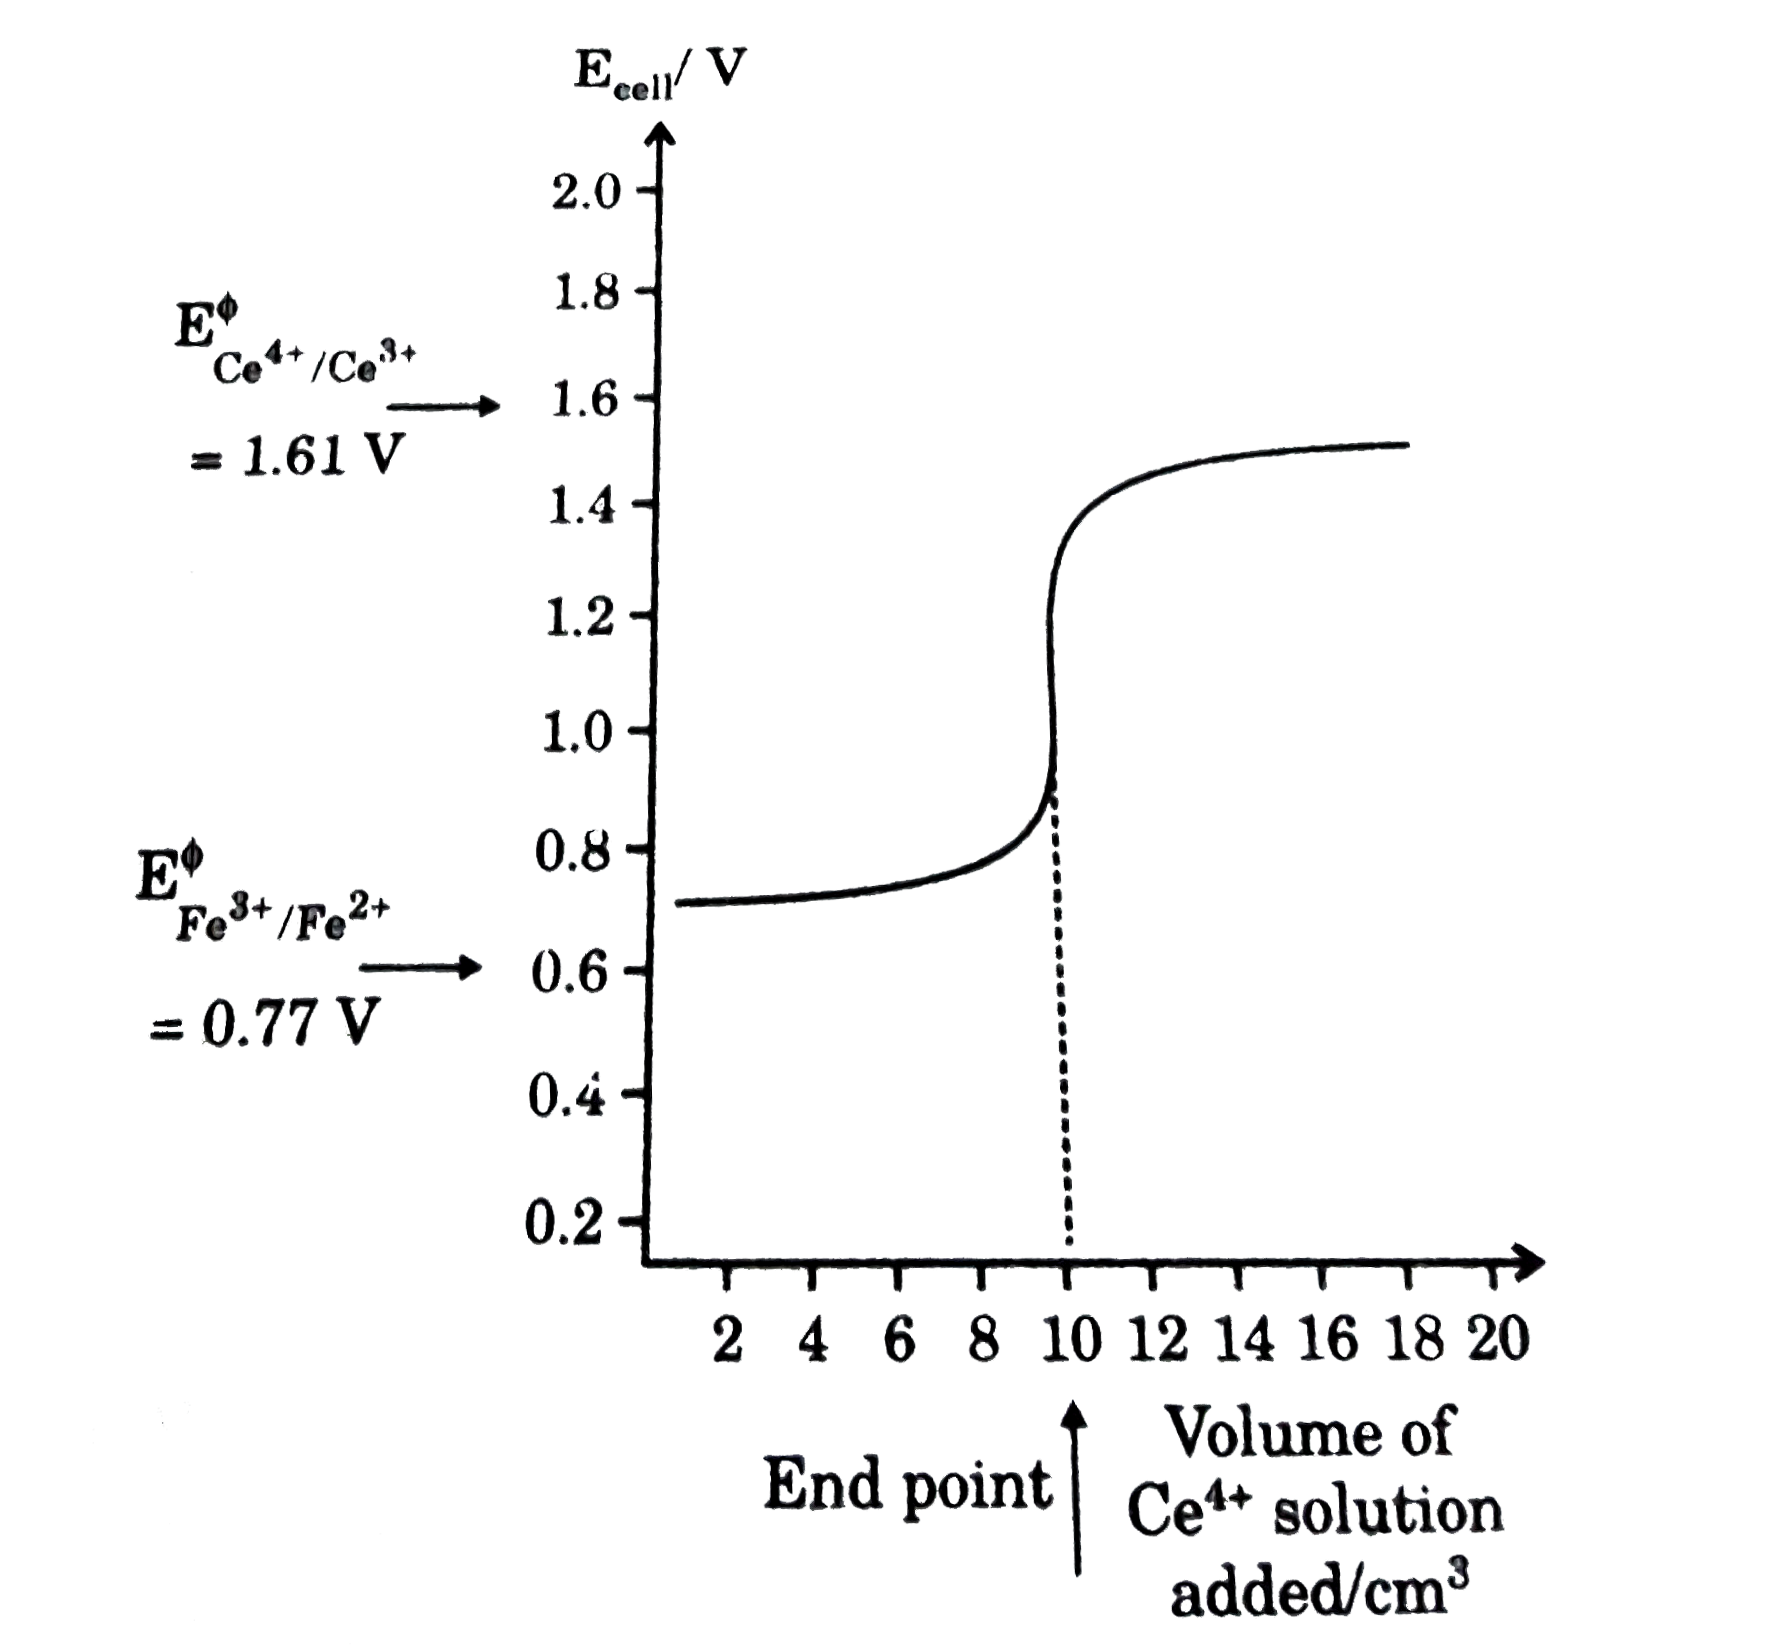
If we continue to add cerium (IV) solution , the number of iron (II) ions is gradually reduced and eventually only a very few are left (Table).At this stage the next few drops of cerium (IV) solution convert all the remaining irom (II) ions into iron (III), and some of the cerium (IV) ions are left unreacted. Once this happens we no longer have an iron (III)/iron(II) half-cell. Instead we have a solution in which there is a large number of cerium (III) ions and a smaller number of cerium (IV) ions. The solution in the beaker now behaves as a cerium (IV)/cerium(III)half-cell (although not a standard one.)
Just before all the iron (II) ions are converted into iron (III) we have a cell with an EMF of around +0.77V. After all the iron (II) ions are oxidised we have a cell with an emf of about +1.61V. This rapid rise in emf occurs with the addition of just one drop of cerium (IV) solution. You should be able to understand why a graph of cell emf against volume of cerium (IV) solution of the iron (II) solution calculated in the usual way.
When an ion is converted into a complex ion, the redox potential change. you can see this in the combination of standard emf of the iron (III)/iron(II) system (+0.36V). The cyanide ion is said to stabilize the oxidation state of the iron. If you were to make up a cell
Pt(s)∣∣ ∣∣Fe(CN)3−61mol dm−1(aq),Fe(CN)4−6∣∣ ∣∣∣∣ ∣∣Fe3+(aq)1mol dm−3,Fe2+(aq)∣∣ ∣∣Pt(s)
what would be the emf and what would be the cell reaction?
View SolutionThe speed of a molecule of a gas changes continuously as a result of collisions with other molecules and with the walls of the container. The speeds of individual molecules therefore change with time.
A direct consequence of the distribution of speeds is that the average kinetric energy is constant for a given temperature.
The average K.E. is defined as
¯¯¯¯¯¯KE=1N(12mΣidNiu21)=12m(ΣidNiN.u21)
where dNN is the fraction of molecules having speeds between ui and ui+du and as proposed by maxwell dNN=4π(m2πKT)3/2exp(−mu22KT).u2.du
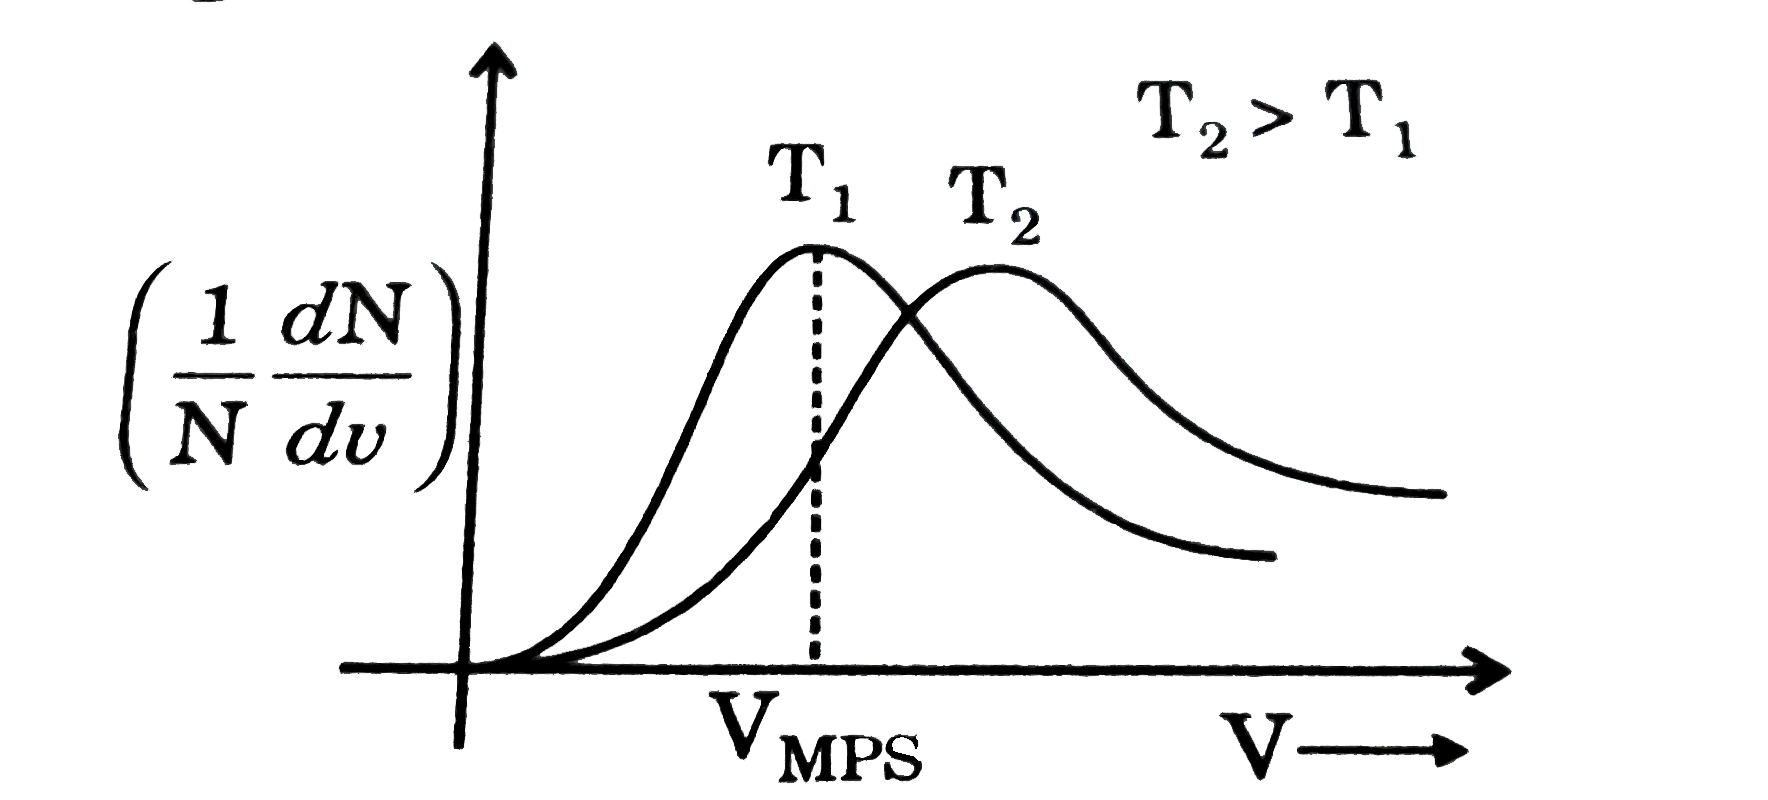
The plot of (1NdNdu) is plotted for a particular gas at two different temperature against u as shown.
The majority of molecules have speeds which cluster around vMPS in the middle of the range of v. There area under the curve between any two speeds V1andV2 is the fraction of molecules having speeds betweenV1andV2.
The speed distribution also depends on the mass of the molecules. As the area under the curve is the same (equal to unity) for all gas samples, samples which have the same VMPS will have identical Maxwellian plots. On the basis of the above passage answer the questions that follow.
If a gas sample contains a total of N molecules. The area under any given maxwellian plot is equal ot :
View SolutionIf an element can exist in several oxidation states, it is convenient to display the reduction potentials corresponding to the various half reactions in diagrammatic from, known as Latimer diagram. The Latimer diagram for chlorine in acid solution is
Cl−4+1.20V−−−−→ClO−3+1.60V−−−−→ClO−2+1.60V−−−−→
ClO−+1.67V−−−−→Cl2+1.36V−−−−→Cl−
In basic solution is :
ClO−4+0.37V−−−−→ClO−3+0.30V−−−−→ClO−2+0.68−−−→
ClO−+0.42V−−−−→Cl2+1.36−−−→Cl−. The standard potentials for two nonadjacent species can also be calculated by using the concept that ΔG∘ is an additive property but using potential is not an assitive property and ΔG∘=−nFx0, If a given oxidation state is a the next higher oxidation state disproportionation can occur. The reverse of relative stabilities of the oxidation state can also be understood by drawing a graph of ΔG∘/F against oxidation state, known as Frost diagram, Choosing the stability of zero oxidation state arbitrery as zero. The most stable oxidation state of a apecies lies lowest in the digram Disproportionation is spontaneous if the species lies above a straight line joining its two product species.
Which of the following couple have same value of potential at pH = 0 and pH = 14?
View SolutionThe first f-block organometallic compound [ThH(OR)(C5Me5)2] was prepared in late 1970s. Find the oxidation state of central metal atom/cation.
View SolutionWhich of the following will decolourise alkaline KMnO4?
View SolutionDuring the titration of a weak base with a strong acid, one should use an acid-base indicator that changes colour in the :
View SolutionConductance measurements and be used to detect the end point of acid-base titrations. Which of the following plots correctly represents the end point of the titration of strong acid and a strong base?
View SolutionThe principle on conductometric titration is based in the fact that during the titration, one of the ions is replaced by the other and invariably thses two ions differ in the ionic conductivity with the result that the conductivity of the solution varies during the course of the titration.Take,for example,the titration between strong acid, say HCl. and a strong base, say NaOH.Before NaOH is added the conuctance of HCl solution has a high value due ti the persence if highly hydrogen ions.As NaOH is added,H+ ions are the replaced by relatively slower moving Na+ ions.Consequently, the conductance of the solution decrease and this continues right upto the enuivalence point where the solution contains only NaCL.Beyond the equivalence point if more of NaOH is added, then the solution contains an excess of the fast moving OH− with the result that its as more of NaoH added, we plot the conductance value vs the amount of NaOH added we get curve of the type shown in figure.The descending portion AB represents the conductance before the equivalence point (solution cintains a mixture if acid HCl and the salt NaCL and the ascending portion CD represents the conductances after the equivalence point (solution contains the salt NaCL and the excess of NaOH). The point E which repersents only the minimum conductance is alkali and thus repersents the equivalence point.This point can, however, be obtained by the extrapoltion of the lines AB and CD and therefore one is not very particular in location this point experimentally as it is in the case of ordinary acid -base involving the acid base indicators
LET us take the specific exaanple of acetic acid being titration against NaOH.Before the addition the of alkali, the solution shows poor conductance due to feeble inization of acetic acid.Initially the addtion of alkali causes not only the replacement of H+ by Na+ but also suppresses the thus the conductance of the solution decrease in the begnning .But very soon the conductance starts increasing as addetion NaOH thus causing neutralizes the undissociated HAc to HAc with strong condutance eletroyte Na+Ac−.The increase in conducting OH− ions gtthe graph near the highly equivalence point actual equivalence point can as usual be ontained by the extrapoiation method
In all thses graphs it been assumed that the vloume change due addition of solution from burette in negligible heane vloume change of the sloution in beaker the conuctance of which is measured is almost constant throughout the measurement
The most appropriate titration curve ibtained when a mixture of a strong acid (say HCl) and a weak acid (sayCH3COOH0 is titration with (say NaOH) will be
View SolutionThe principle on conductometric titration is based in the fact that during the titration, one of the ions is replaced by the other and invariably thses two ions differ in the ionic conductivity with the result that the conductivity of the solution varies during the course of the titration.Take,for example,the titration between strong acid, say HCl. and a strong base, say NaOH.Before NaOH is added the conuctance of HCl solution has a high value due ti the persence if highly hydrogen ions.As NaOH is added, H^(+) ions are the replaced by relatively slower moving Na^(+) ions.Consequently, the conductance of the solution decrease and this continues right upto the enuivalence point where the solution contains only NaCL.Beyond the equivalence point if more of NaOH is added, then the solution contains an excess of the fast moving OH^(-) with the result that its as more of NaoH added, we plot the conductance value vs the amount of NaOH added we get curve of the type shown in figure.The descending portion AB represents the conductance before the equivalence point (solution cintains a mixture if acid HCl and the salt NaCL and the ascending portion CD represents the conductances after the equivalence point (solution contains the salt NaCL and the excess of NaOH). The point E which repersents only the minimum conductance is alkali and thus repersents the equivalence point.This point can, however, be obtained by the extrapoltion of the lines AB and CD and therefore one is not very particular in location this point experimentally as it is in the case of ordinary acid -base involving the acid base indicators LET us take the specific exaanple of acetic acid being titration against NaOH.Before the addition the of alkali, the solution shows poor conductance due to feeble inization of acetic acid.Initially the addtion of alkali causes not only the replacement of H^(+) by Na^(+) but also suppresses the thus the conductance of the solution decrease in the begnning .But very soon the conductance starts increasing as addetion NaOH thus causing neutralizes the undissociated HAc to HAc with strong condutance eletroyte Na^(+)Ac^(-) .The increase in conducting OH^(-) ions gtthe graph near the highly equivalence point actual equivalence point can as usual be ontained by the extrapoiation method In all thses graphs it been assumed that the vloume change due addition of solution from burette in negligible heane vloume change of the sloution in beaker the conuctance of which is measured is almost constant throughout the measurement If a 100 ml solution of 0.1 MHBr is titration using a very concentrated solution of NaOH then the conductivity (specific conductance0 of this solution at the equivalence wil be (assume volume change is negligible due addition of NaOH). Report your answer after mulitiplying it with 100 in Sm^(-1) [Given : lambda_((Na^(+)))^(@)=8xx10^(-3)Sm^(2)mol^(-1), lambda_((Br^(-)))^(@) = 4 xx 10^(-3) Sm^(2)mol^(-1)]
View SolutionIn the titration of weak acid against strong base match the pH of the solution at different stage of titration.


View SolutionStrong acid versus strong base: The principle of conductometric titrations is based on the fact that during the titration, one of the ions is replaced by the other and invariable these two ions differ in the ionic conductivity with the result that thhe conductivity of the solution varies during the course of the titration. take, for example, the titration between a strong acid, say HCl, and a string base, say NaOH before NaOH is added, the conductance of HCl solution has a high value due to the presence of highly mobile hydrogen ions. As NaOH is added, H^(+) ions are replaced by relatively slower moving Na^(+) ions. consequently the conductance of the solution decreases and this continues right upto the equivalence point where the solution contains only NaCl. Beyond the equivalence point, if more of NaOH is added, then the solution contains a excess of the fast moving OH^(-) ions with the result that its conductance is increased ad it condinues to increase as more and more of NaOH is added. If we plot the conductance value versus the amount of NaOH added, we get a curve of the type shown in Fig. The descending portion AB represents the conductances before the equivalence point (solution contains a mixture of acid HCl and the salt NaCl) and the ascending portion CD represents the conductances after the equivalence point (solution contains the salt NaCl and the excess of NaOH). The point E which represent the minium conductance is due to the solution containing only NaCl with no free acid or alkali and thus represents the equivalence point. this point can, however, be obtained by the extrapolation of the lines AB and DC, and therefore, one is not very particular in locating this point expermentally as it is in the case of ordinary acid-base titrations involving the acid-base indicators. Weak acid versus strong base: Let us take specific example of acetic acid being titrated against NaOH . Before the addition of alkali, the solution shows poor conductance due to feeble ionization of acetic acid. Initially the addition of alkali causes not only the replacement of H^(+) by Na^(+) but also suppresses the dissociation of acetic acid due to the common ion Ac^(-) and thus the conductance of the solution decreases in the beginning. but very soon the conductance start increasing as addition of NaOH neutralizes the undissociated HAc to Na^(+)Ac^(-) thus causing the replacement of non-conducting HAc with Strong-conducting electrolyte Na^(+)Ac^(-) . the increase in conductance continuous right up to the equivalence point. Beyond this point conductance increases more rapidly with the addition of NaOH due to the highly conducting OH^(-) ions, the graph near the equivalence point is curved due to the hydrolysis of the salt NaAc . The actual equivalence point can, as usual, be obtained by the extrapolation method. In all these graphs it has been assumed that the volume change due addition of solution from burrette is negnigible, hence volume change of the solution in beaker the conductance of which is measured is almost constant throughout the measurement. Q. The nature of curve obtained for the titration between weak acid versus strong base as described in the above passage will be:
View SolutionStrong acid versus strong base: The principle of conductometric titrations is based on the fact that during the titration, one of the ions is replaced by the other and invariable these two ions differ in the ionic conductivity with the result that thhe conductivity of the solution varies during the course of the titration. take, for example, the titration between a strong acid, say HCl, and a string base, say NaOH before NaOH is added, the conductance of HCl solution has a high value due to the presence of highly mobile hydrogen ions. As NaOH is added, H^(+) ions are replaced by relatively slower moving Na^(+) ions. consequently the conductance of the solution decreases and this continues right upto the equivalence point where the solution contains only NaCl. Beyond the equivalence point, if more of NaOH is added, then the solution contains a excess of the fast moving OH^(-) ions with the result that its conductance is increased ad it condinues to increase as more and more of NaOH is added. If we plot the conductance value versus the amount of NaOH added, we get a curve of the type shown in Fig. The descending portion AB represents the conductances before the equivalence point (solution contains a mixture of acid HCl and the salt NaCl) and the ascending portion CD represents the conductances after the equivalence point (solution contains the salt NaCl and the excess of NaOH). The point E which represent the minium conductance is due to the solution containing only NaCl with no free acid or alkali and thus represents the equivalence point. this point can, however, be obtained by the extrapolation of the lines AB and DC, and therefore, one is not very particular in locating this point expermentally as it is in the case of ordinary acid-base titrations involving the acid-base indicators. Weak acid versus strong base: Let us take specific example of acetic acid being titrated against NaOH . Before the addition of alkali, the solution shows poor conductance due to feeble ionization of acetic acid. Initially the addition of alkali causes not only the replacement of H^(+) by Na^(+) but also suppresses the dissociation of acetic acid due to the common ion Ac^(-) and thus the conductance of the solution decreases in the beginning. but very soon the conductance start increasing as addition of NaOH neutralizes the undissociated HAc to Na^(+)Ac^(-) thus causing the replacement of non-conducting HAc with Strong-conducting electrolyte Na^(+)Ac^(-) . the increase in conductance continuous right up to the equivalence point. Beyond this point conductance increases more rapidly with the addition of NaOH due to the highly conducting OH^(-) ions, the graph near the equivalence point is curved due to the hydrolysis of the salt NaAc . The actual equivalence point can, as usual, be obtained by the extrapolation method. In all these graphs it has been assumed that the volume change due addition of solution from burrette is negnigible, hence volume change of the solution in beaker the conductance of which is measured is almost constant throughout the measurement. Q. The most appropriate titration curve obtained when a mixture of a strong acid (say HCl) and a weak acid (say CH_(3)COOH ) is titrated with a strong base (say NaOH) will be
View SolutionStrong acid versus strong base: The principle of conductometric titrations is based on the fact that during the titration, one of the ions is replaced by the other and invariable these two ions differ in the ionic conductivity with the result that thhe conductivity of the solution varies during the course of the titration. take, for example, the titration between a strong acid, say HCl, and a string base, say NaOH before NaOH is added, the conductance of HCl solution has a high value due to the presence of highly mobile hydrogen ions. As NaOH is added, H^(+) ions are replaced by relatively slower moving Na^(+) ions. consequently the conductance of the solution decreases and this continues right upto the equivalence point where the solution contains only NaCl. Beyond the equivalence point, if more of NaOH is added, then the solution contains a excess of the fast moving OH^(-) ions with the result that its conductance is increased ad it condinues to increase as more and more of NaOH is added. If we plot the conductance value versus the amount of NaOH added, we get a curve of the type shown in Fig. The descending portion AB represents the conductances before the equivalence point (solution contains a mixture of acid HCl and the salt NaCl) and the ascending portion CD represents the conductances after the equivalence point (solution contains the salt NaCl and the excess of NaOH). The point E which represent the minium conductance is due to the solution containing only NaCl with no free acid or alkali and thus represents the equivalence point. this point can, however, be obtained by the extrapolation of the lines AB and DC, and therefore, one is not very particular in locating this point expermentally as it is in the case of ordinary acid-base titrations involving the acid-base indicators. Weak acid versus strong base: Let us take specific example of acetic acid being titrated against NaOH . Before the addition of alkali, the solution shows poor conductance due to feeble ionization of acetic acid. Initially the addition of alkali causes not only the replacement of H^(+) by Na^(+) but also suppresses the dissociation of acetic acid due to the common ion Ac^(-) and thus the conductance of the solution decreases in the beginning. but very soon the conductance start increasing as addition of NaOH neutralizes the undissociated HAc to Na^(+)Ac^(-) thus causing the replacement of non-conducting HAc with Strong-conducting electrolyte Na^(+)Ac^(-) . the increase in conductance continuous right up to the equivalence point. Beyond this point conductance increases more rapidly with the addition of NaOH due to the highly conducting OH^(-) ions, the graph near the equivalence point is curved due to the hydrolysis of the salt NaAc . The actual equivalence point can, as usual, be obtained by the extrapolation method. In all these graphs it has been assumed that the volume change due addition of solution from burrette is negnigible, hence volume change of the solution in beaker the conductance of which is measured is almost constant throughout the measurement. Q. If a 100 mL solution of 0.1 M HBr is titrated using a very concentrated solution of NaOH , then the conductivity (specific conductance) of this solution at the equivalence point will be (assume volume change is negligible due to addition of NaoH) report your answer after multipling it with 10 in Sm^(-1) [Given lamda_((Na^(+)))^(@)=8xx10^(-3)Sm^(2)mol^(-1),lamda_((Br^(-)))^(@)=4xx10^(-3)Sm^(2)mol^(-1)]
View SolutionWhy are strong acids generally used as standard solutions in acid-base titrations ?
View SolutionThe most appropriate titration curve obtained when a mixture of a strong acid (say HCl) and a weak acid (say CH3COOH) is titrated with a strong base (say NaOH) will be

View Solution
