Titration are one of the methods we can use to discover the precise concentration of solutions. A typical titration involves adding a solution from a burette to another solution in a flask. The end point of the titration is found by watching a colour change taking place.However, a problem arises when a suitable indicator cannot be found, or when the colour change involved are unclear. In these cases, redox potential may sometimes come to the rescue.
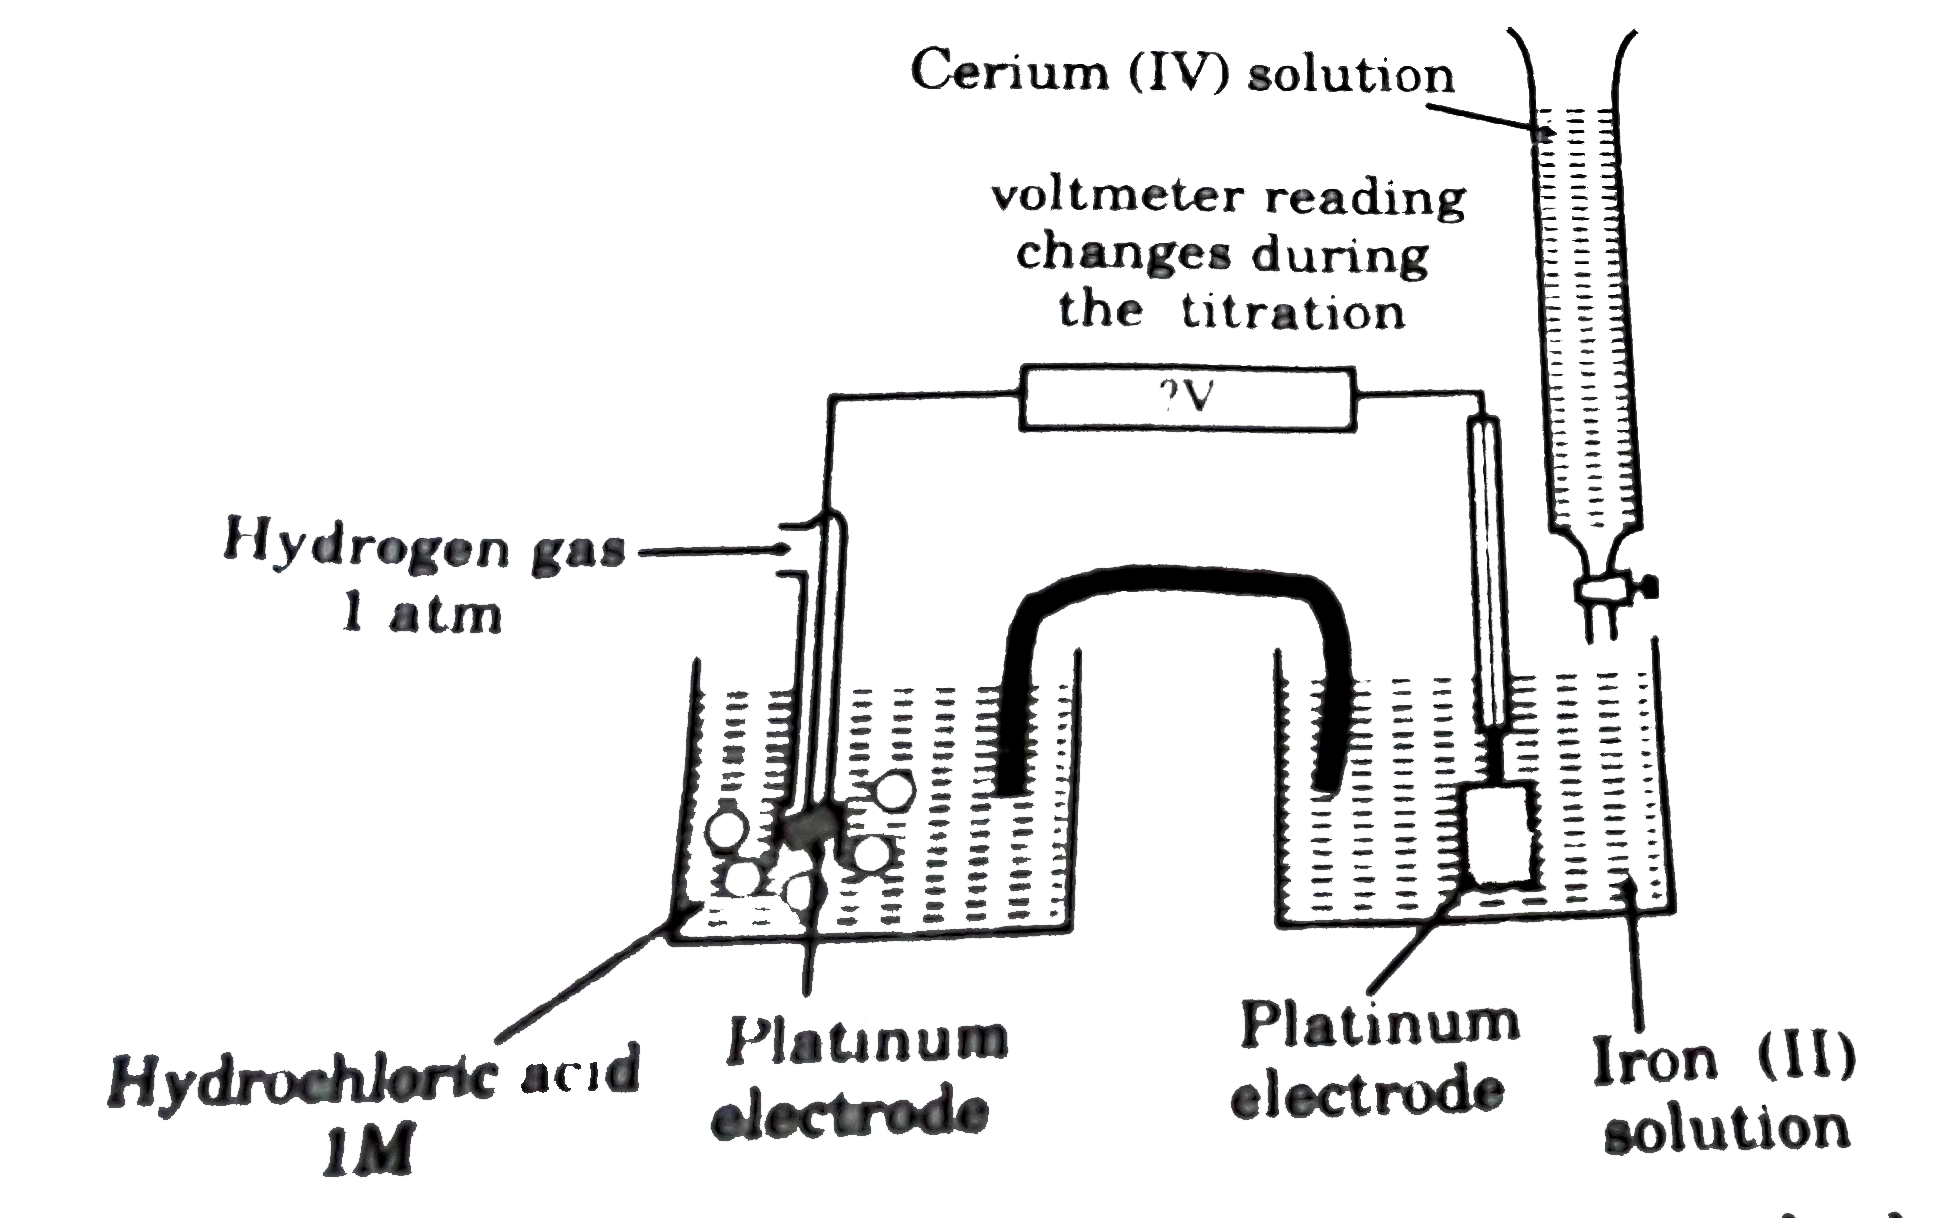
A perticularly well known example (Fig.) is a method of discovering then concentration of iron (II) ions in a solution by titrating them with a solution of cerium (IV). The redox potential that are of interest here are These tell us that cerium (IV) ions are the oxidising agents. They should react according to the equation
Now imagine that we know the concentration of the cerium (IV) ions solution in the burette. We want to measure the concentration of the cerium (IV) solution from the burette, some of the iron (II) ions are will be oxidised. As a consequence the beaker would now contain large number of unreacted iron (II) ions , but also some iron (III) ions as well. All of the cerium (III). The solution in the beaker now represents an iron half cell although not at standard conditions.Thus , the emf of the cell will be near, but not equal to
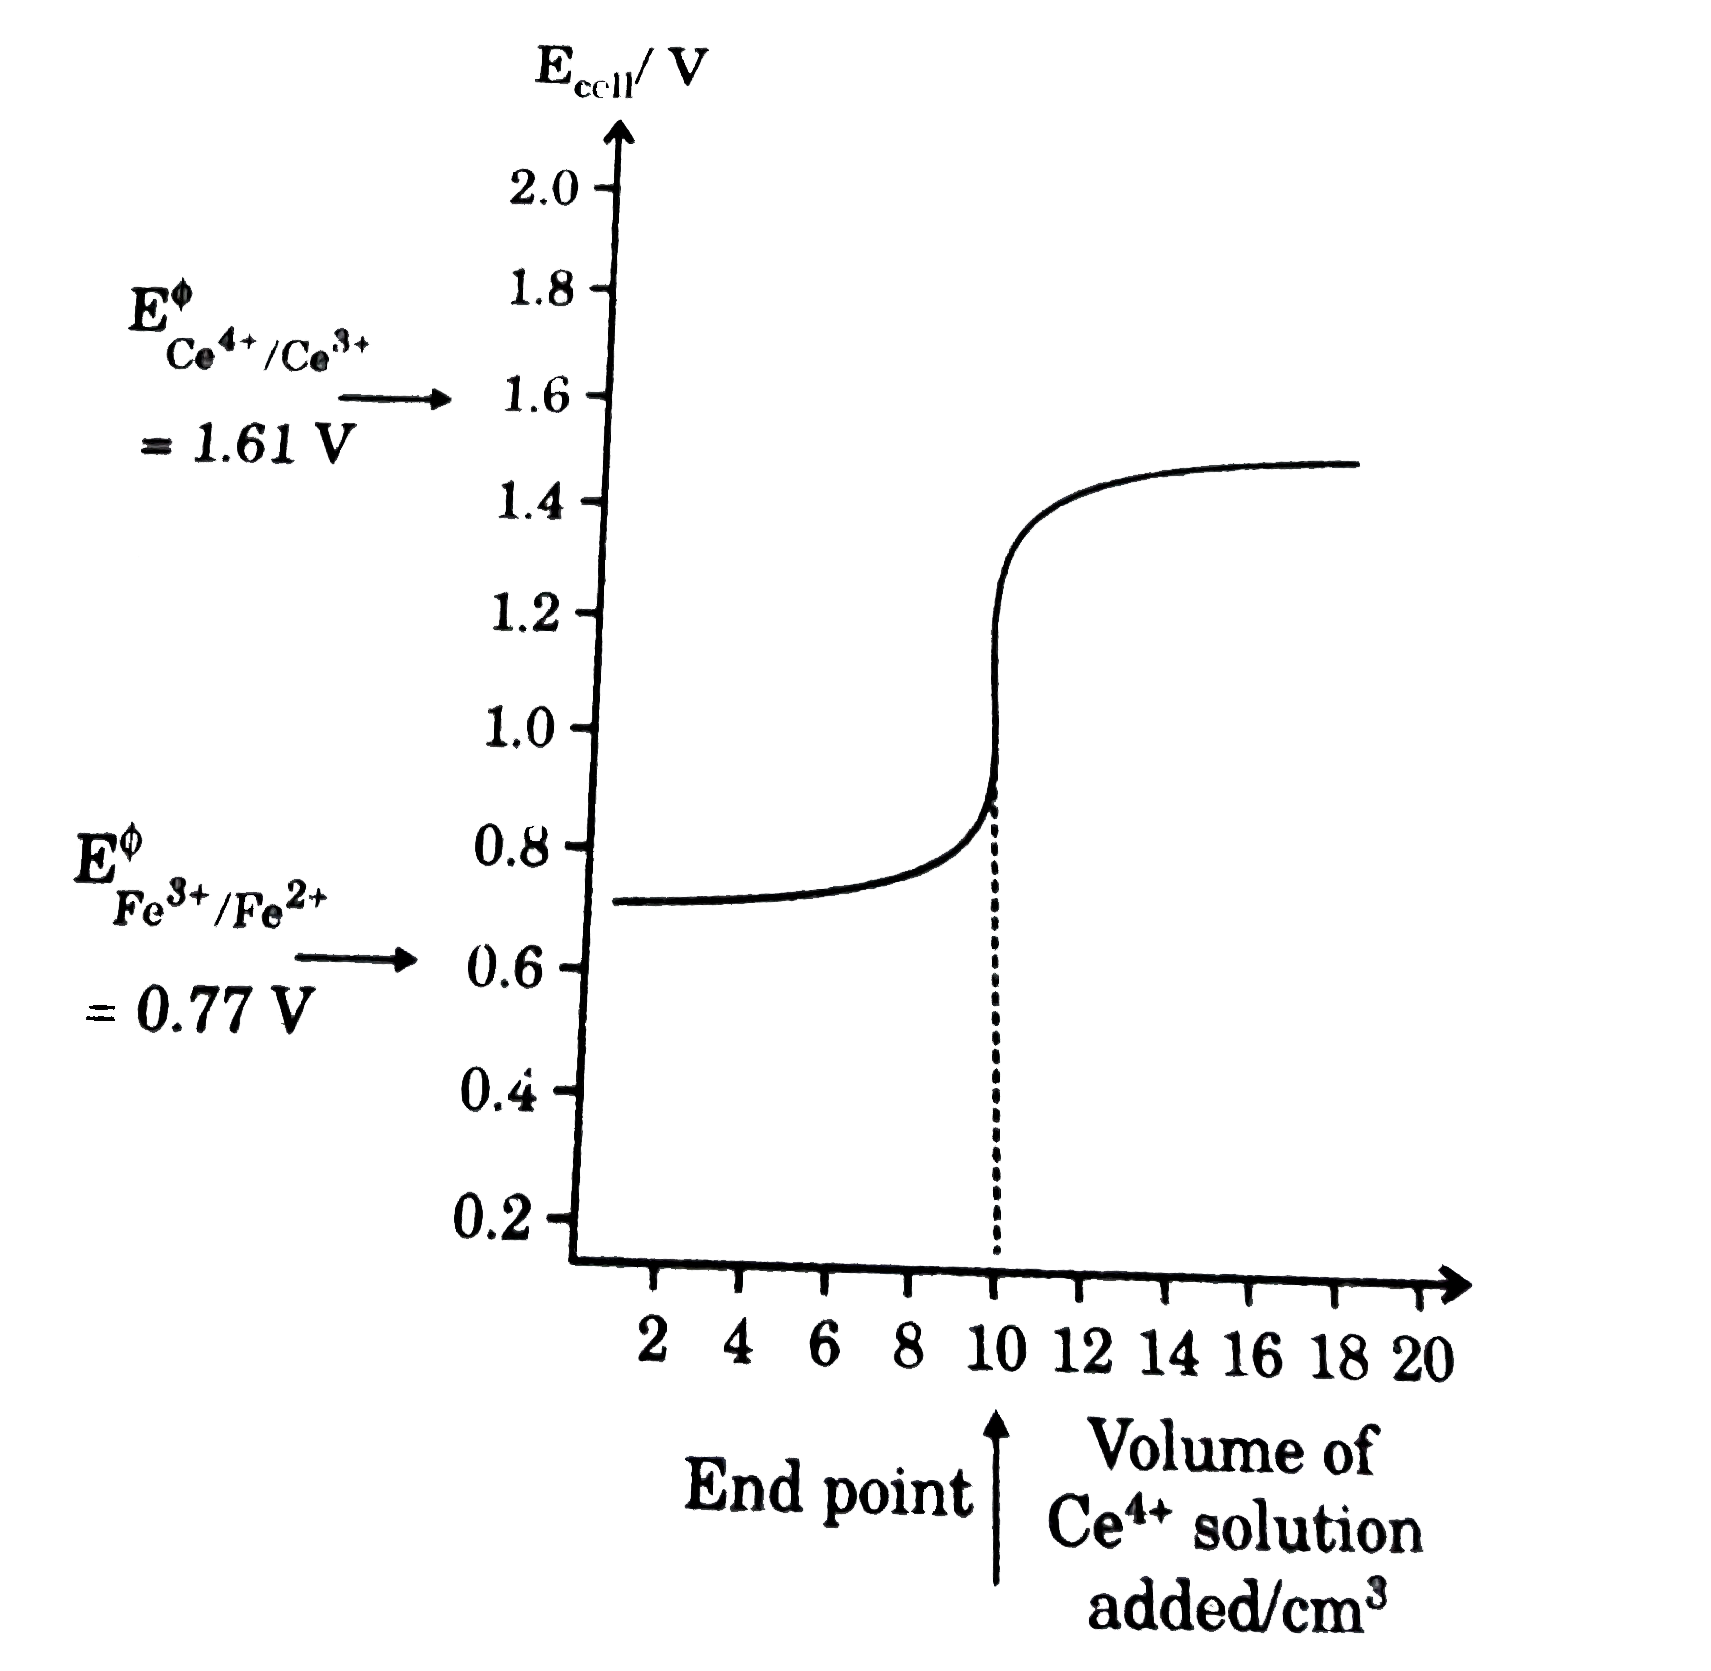
If we continue to add cerium (IV) solution , the number of iron (II) ions is gradually reduced and eventually only a very few are left (Table).At this stage the next few drops of cerium (IV) solution convert all the remaining irom (II) ions into iron (III), and some of the cerium (IV) ions are left unreacted. Once this happens we no longer have an iron half-cell. Instead we have a solution in which there is a large number of cerium (III) ions and a smaller number of cerium (IV) ions. The solution in the beaker now behaves as a cerium half-cell (although not a standard one.)
Just before all the iron (II) ions are converted into iron (III) we have a cell with an EMF of around After all the iron (II) ions are oxidised we have a cell with an emf of about This rapid rise in emf occurs with the addition of just one drop of cerium (IV) solution. You should be able to understand why a graph of cell emf against volume of cerium (IV) solution of the iron (II) solution calculated in the usual way.
Imagine you were given a solution of potassium dichromate (VI) in a beaker and a solution of iron (II) sulphate in a burette. You do not know the concentration of dichromate (VI) ions , but the concentration of the iron (II) solution is known. Your task it to carry out a redox titration using the two solutions in order to determine the concentration of dichromate (VI) ions. Sketch a graph showing how the emf changes in the course of the above titration.
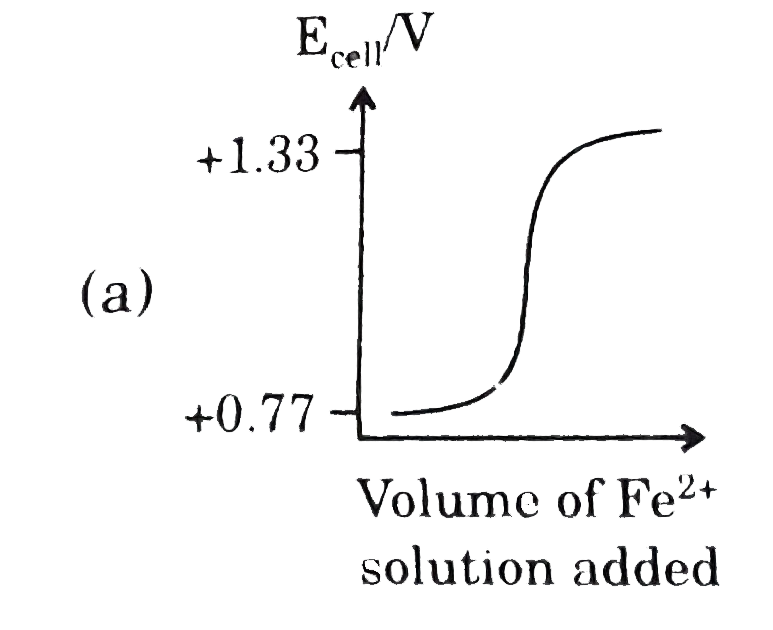
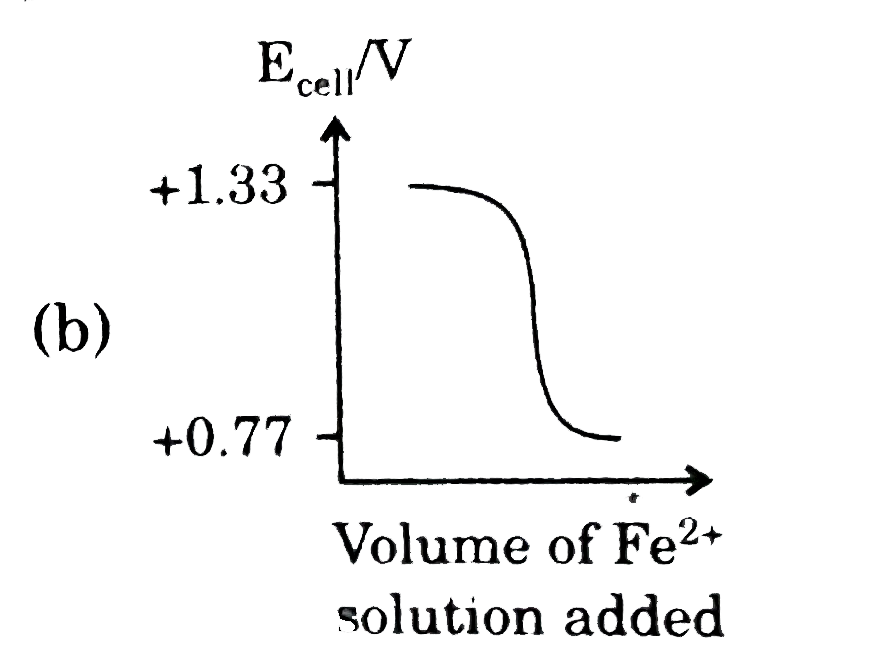
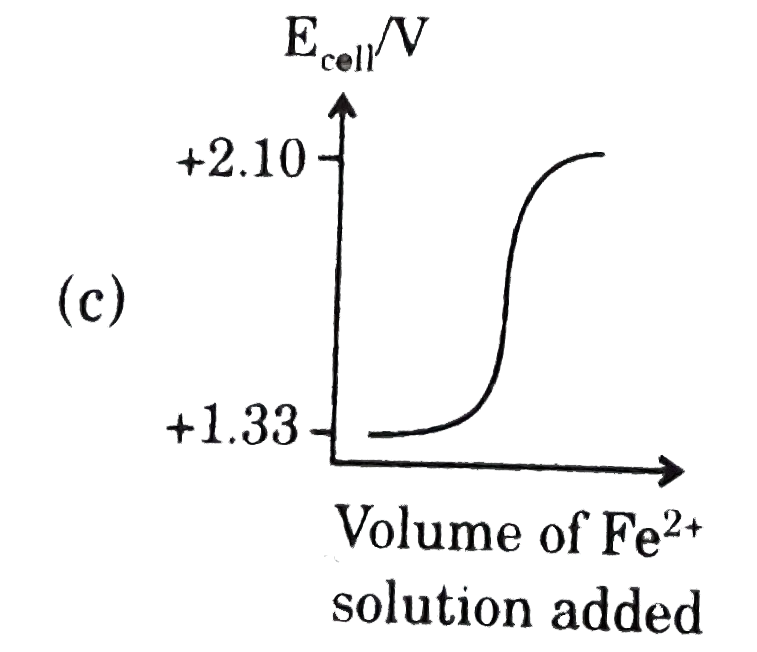
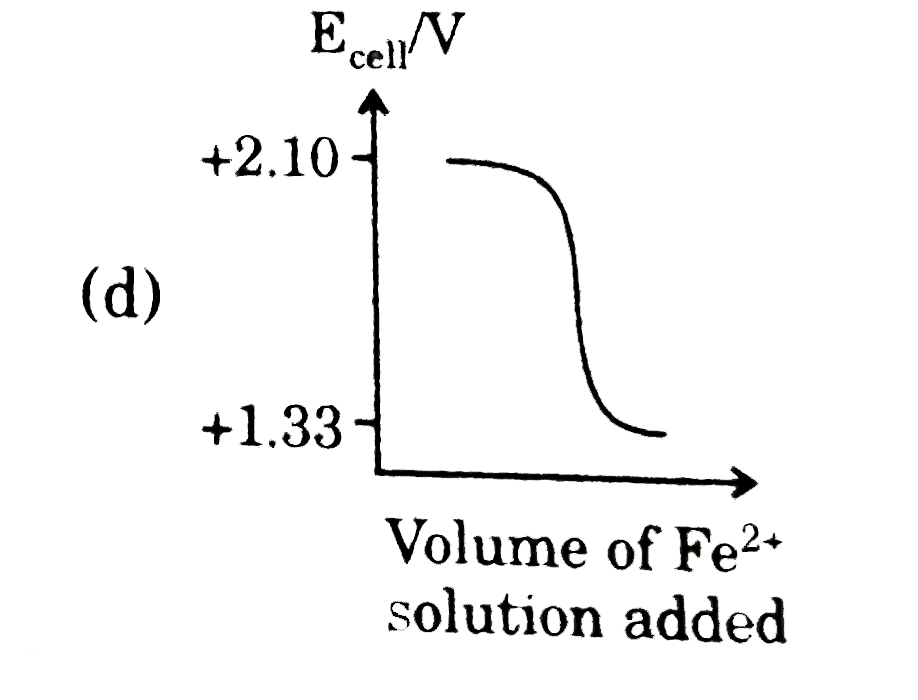
The correct Answer is:B
Topper's Solved these Questions
- GRAPHICAL INTERPRETATIONBOOK - GRB PUBLICATIONCHAPTER - GRAPHICAL INTERPRETATIONEXERCISE - Comprehension 2
1 Videos
- GRAPHICAL INTERPRETATIONBOOK - GRB PUBLICATIONCHAPTER - GRAPHICAL INTERPRETATIONEXERCISE - Comprehension 3
1 Videos
- GRAPHICAL INTERPRETATIONBOOK - GRB PUBLICATIONCHAPTER - GRAPHICAL INTERPRETATIONEXERCISE - Comprehension 1
1 Videos
- F-BLOCK ELEMENTSBOOK - GRB PUBLICATIONCHAPTER - F-BLOCK ELEMENTSEXERCISE - Subjective type
7 Videos
- HYDROCARBON (ALIPHATIC)BOOK - GRB PUBLICATIONCHAPTER - HYDROCARBON (ALIPHATIC)EXERCISE - Previous years jee questions
28 Videos
Similar Questions
One mole of an ideal gas undergoes a process (10L, 4atm) to (4L, 10 atm ). The process may be represented by straight line in P-V diagram
The correct statement for the process :
View SolutionIn order to perdict variation of Gibbs free energy with progress of reaction at constant temperature and 1 bar pressure, it is important to know realtive stability of the components involved in chemical reaction at standard useful work then the change in Gibbs free energy should be calculated
Which of the following options correctly represects the graph between Gibbs free energy (G0 and state of reaction (SOR) at 1 bar and 300 K for the reaction But -1 ene (A) ⇔ but -2 ene (B)
View SolutionEvery reaction whether started by taking only reactants or by taking only products or any other combination always has a tendency to move towards equilibrium. Hence, equilibrium state can be considered as the one with most stable composition. In case of isomers, based on stability data position of equilibrium can als be decided.
Which of the following options correctly represent ΔG∘f of cis but-2-ene, trans but-2-ene and but-1-ene in kJ/mole?
View SolutionThe first f-block organometallic compound [ThH(OR)(C5Me5)2] was prepared in late 1970s. Find the oxidation state of central metal atom/cation.
View SolutionWhich of the following will decolourise alkaline KMnO4?
View SolutionWhich fo the following is a correct statement ? ltbtgt (i) Titration is a process in which the solutions of two reagents are allowed to react .
(ii) Titration is carried out by adding the standard solution fo one reagant taken in a burette to the known volume (10 ro 20cm3 , mesured by a pipette) of the solution of the other reagent taken in a flask called then titration flask.
(iii) The solution taken the burette is called the titrant while that taken in the titration flask is called the analyte.
(iv) An acid-base indicator is an organic due which changes color wiht the pH of the solution at the equivalence point .
View SolutionWhich solution can serve as both reactant and indicator when it is used in redox titrations ?
View SolutionWhen a solution of NH_(3)(K_(b)=1.8xx10^(-5)) is titrated with a strong acid the indicator used should change colour near a pH of :
View SolutionTitration are one of the methods we can use to discover the precise concentration of solutions. A typical titration involves adding a solution from a burette to another solution in a flask. The end point of the titration is found by watching a colour change taking place.However, a problem arises when a suitable indicator cannot be found, or when the colour change involved are unclear. In these cases, redox potential may sometimes come to the rescue.
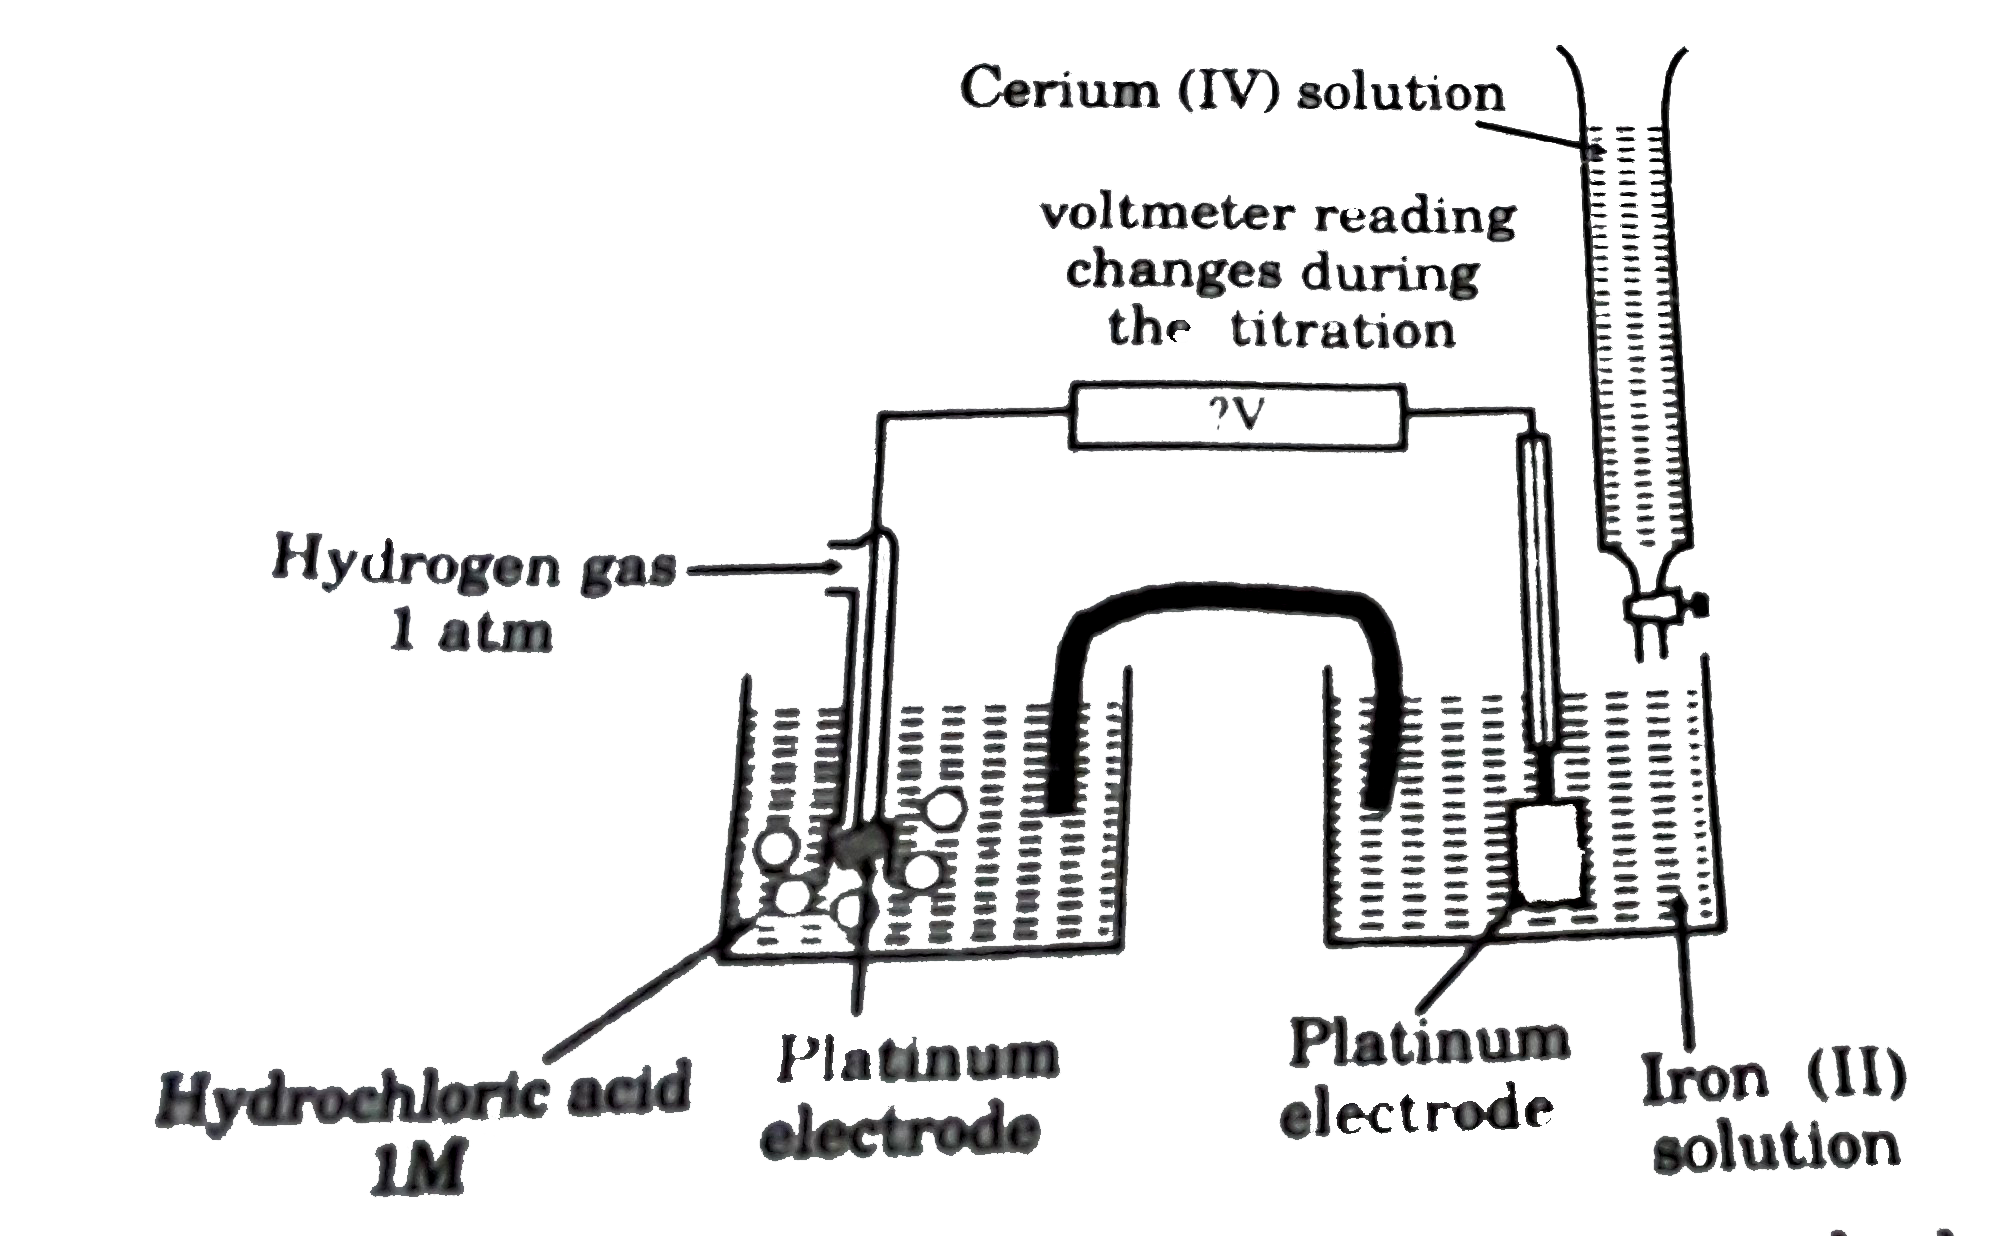
A perticularly well known example (Fig.) is a method of discovering then concentration of iron (II) ions in a solution by titrating them with a solution of cerium (IV). The redox potential that are of interest here areE∘Fe3+∣Fe2+=0.77VandE∘Ce4+∣Ce3+=1.61V. These tell us that cerium (IV) ions are the oxidising agents. They should react according to the equation
Fe2+(aq)+Ce4+(aq)→Fe3+(aq)+Ce3+(aq).
Now imagine that we know the concentration of the cerium (IV) ions solution in the burette. We want to measure the concentration of the cerium (IV) solution from the burette, some of the iron (II) ions are will be oxidised. As a consequence the beaker would now contain large number of unreacted iron (II) ions , but also some iron (III) ions as well. All of the cerium (III). The solution in the beaker now represents an iron (III)/iron(II) half cell although not at standard conditions.Thus , the emf of the cell will be near, but not equal to E∘Fe3+∣Fe2+.
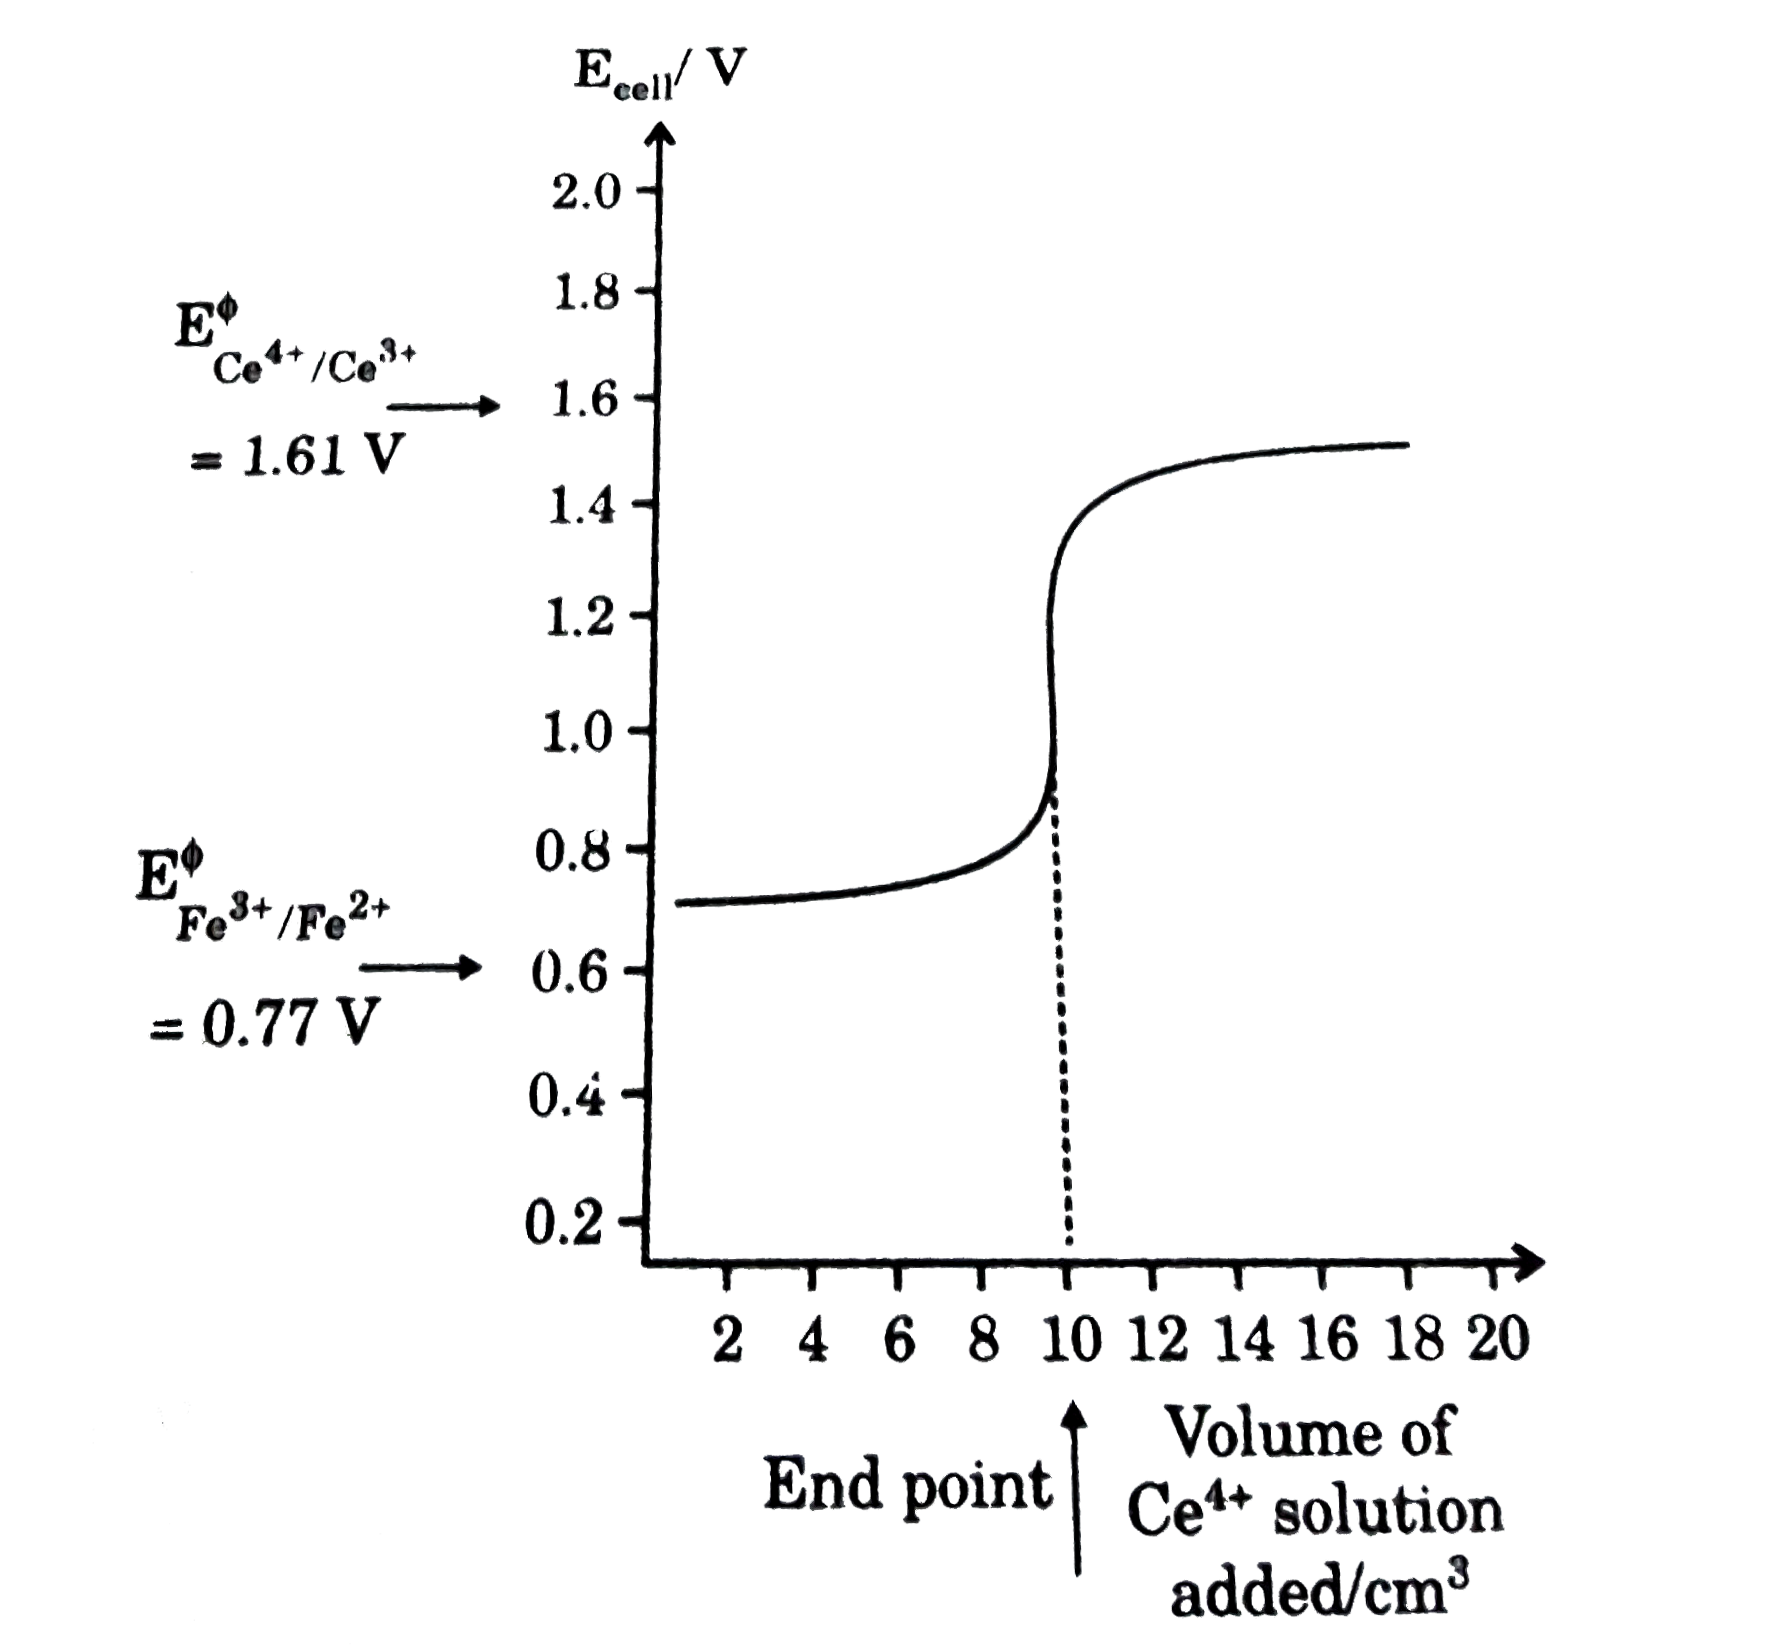
If we continue to add cerium (IV) solution , the number of iron (II) ions is gradually reduced and eventually only a very few are left (Table).At this stage the next few drops of cerium (IV) solution convert all the remaining irom (II) ions into iron (III), and some of the cerium (IV) ions are left unreacted. Once this happens we no longer have an iron (III)/iron(II) half-cell. Instead we have a solution in which there is a large number of cerium (III) ions and a smaller number of cerium (IV) ions. The solution in the beaker now behaves as a cerium (IV)/cerium(III)half-cell (although not a standard one.)
Just before all the iron (II) ions are converted into iron (III) we have a cell with an EMF of around +0.77V. After all the iron (II) ions are oxidised we have a cell with an emf of about +1.61V. This rapid rise in emf occurs with the addition of just one drop of cerium (IV) solution. You should be able to understand why a graph of cell emf against volume of cerium (IV) solution of the iron (II) solution calculated in the usual way.
When an ion is converted into a complex ion, the redox potential change. you can see this in the combination of standard emf of the iron (III)/iron(II) system (+0.36V). The cyanide ion is said to stabilize the oxidation state of the iron. If you were to make up a cell
Pt(s)∣∣ ∣∣Fe(CN)3−61mol dm−1(aq),Fe(CN)4−6∣∣ ∣∣∣∣ ∣∣Fe3+(aq)1mol dm−3,Fe2+(aq)∣∣ ∣∣Pt(s)
what would be the emf and what would be the cell reaction?
View SolutionTitration are one of the methods we can use to discover the precise concentration of solutions. A typical titration involves adding a solution from a burette to another solution in a flask. The end point of the titration is found by watching a colour change taking place.However, a problem arises when a suitable indicator cannot be found, or when the colour change involved are unclear. In these cases, redox potential may sometimes come to the rescue. A perticularly well known example (Fig.) is a method of discovering then concentration of iron (II) ions in a solution by titrating them with a solution of cerium (IV). The redox potential that are of interest here are E_(Fe^(3+)|Fe^(2+))^(@)=0.77 V "and"E_(Ce^(4+|Ce^(3+)))^(@)=1.61V. These tell us that cerium (IV) ions are the oxidising agents. They should react according to the equation Fe^(2+) (aq) + Ce^(4+) (aq) to Fe^(3+) (aq) + Ce^(3+) (aq) . Now imagine that we know the concentration of the cerium (IV) ions solution in the burette. We want to measure the concentration of the cerium (IV) solution from the burette, some of the iron (II) ions are will be oxidised. As a consequence the beaker would now contain large number of unreacted iron (II) ions , but also some iron (III) ions as well. All of the cerium (III). The solution in the beaker now represents an iron (III)//iron(II) half cell although not at standard conditions.Thus , the emf of the cell will be near, but not equal to E_(Fe^(3+|Fe^(2+.)))^(@) If we continue to add cerium (IV) solution , the number of iron (II) ions is gradually reduced and eventually only a very few are left (Table).At this stage the next few drops of cerium (IV) solution convert all the remaining irom (II) ions into iron (III), and some of the cerium (IV) ions are left unreacted. Once this happens we no longer have an iron (III)//"iron"(II) half-cell. Instead we have a solution in which there is a large number of cerium (III) ions and a smaller number of cerium (IV) ions. The solution in the beaker now behaves as a cerium (IV)//"cerium"(III) half-cell (although not a standard one.) Just before all the iron (II) ions are converted into iron (III) we have a cell with an EMF of around +0.77V. After all the iron (II) ions are oxidised we have a cell with an emf of about +1.61 V. This rapid rise in emf occurs with the addition of just one drop of cerium (IV) solution. You should be able to understand why a graph of cell emf against volume of cerium (IV) solution of the iron (II) solution calculated in the usual way. The cell shown below was set up Pt|underset(1"mol dm"^(-3))(Fe^(3+)(aq),Fe^(2+)(aq)),||underset(1"mol dm"^(-3)) (Br^(-)(aq)|Br_(2)(l)),|Pt(s) what would be the cell emf? If potassium cyanide solution were added to the left hand half cell (with due care!) what would you expect to happen to the emf of the cell ? E_(Br_(2)//Br^(-))^(@)= 1.07 V and use data of previous question, if required.
View SolutionWhen phenolphthalein is used as the indicator in a titration of an HCl solution with a solution of NaOH , the indicator undergoes a colour change from colourless to poink at the end point of the tiration. This colour change occurs abruptly because
View SolutionWhy in the redox titration of KMnO4 vs oxalic acid, we heat oxalic acid solution before starting the titration?
View SolutionWhen KMnO4 solution is titrated with a solution containing Fe2+ ion, the indicator used in this titration is
View SolutionWhich of the following colour changes shown during redox titrations is not correct ?
View SolutionA 100ml solution of 0.1 N HCl was titrated with 0.2N NaOH solution. The titration was discontinued after adding 30ml of NaOH solution. The remaining titration was completed by adding 0.25N KOH solution. The volume of KOH required for completing the titration is
View Solution
