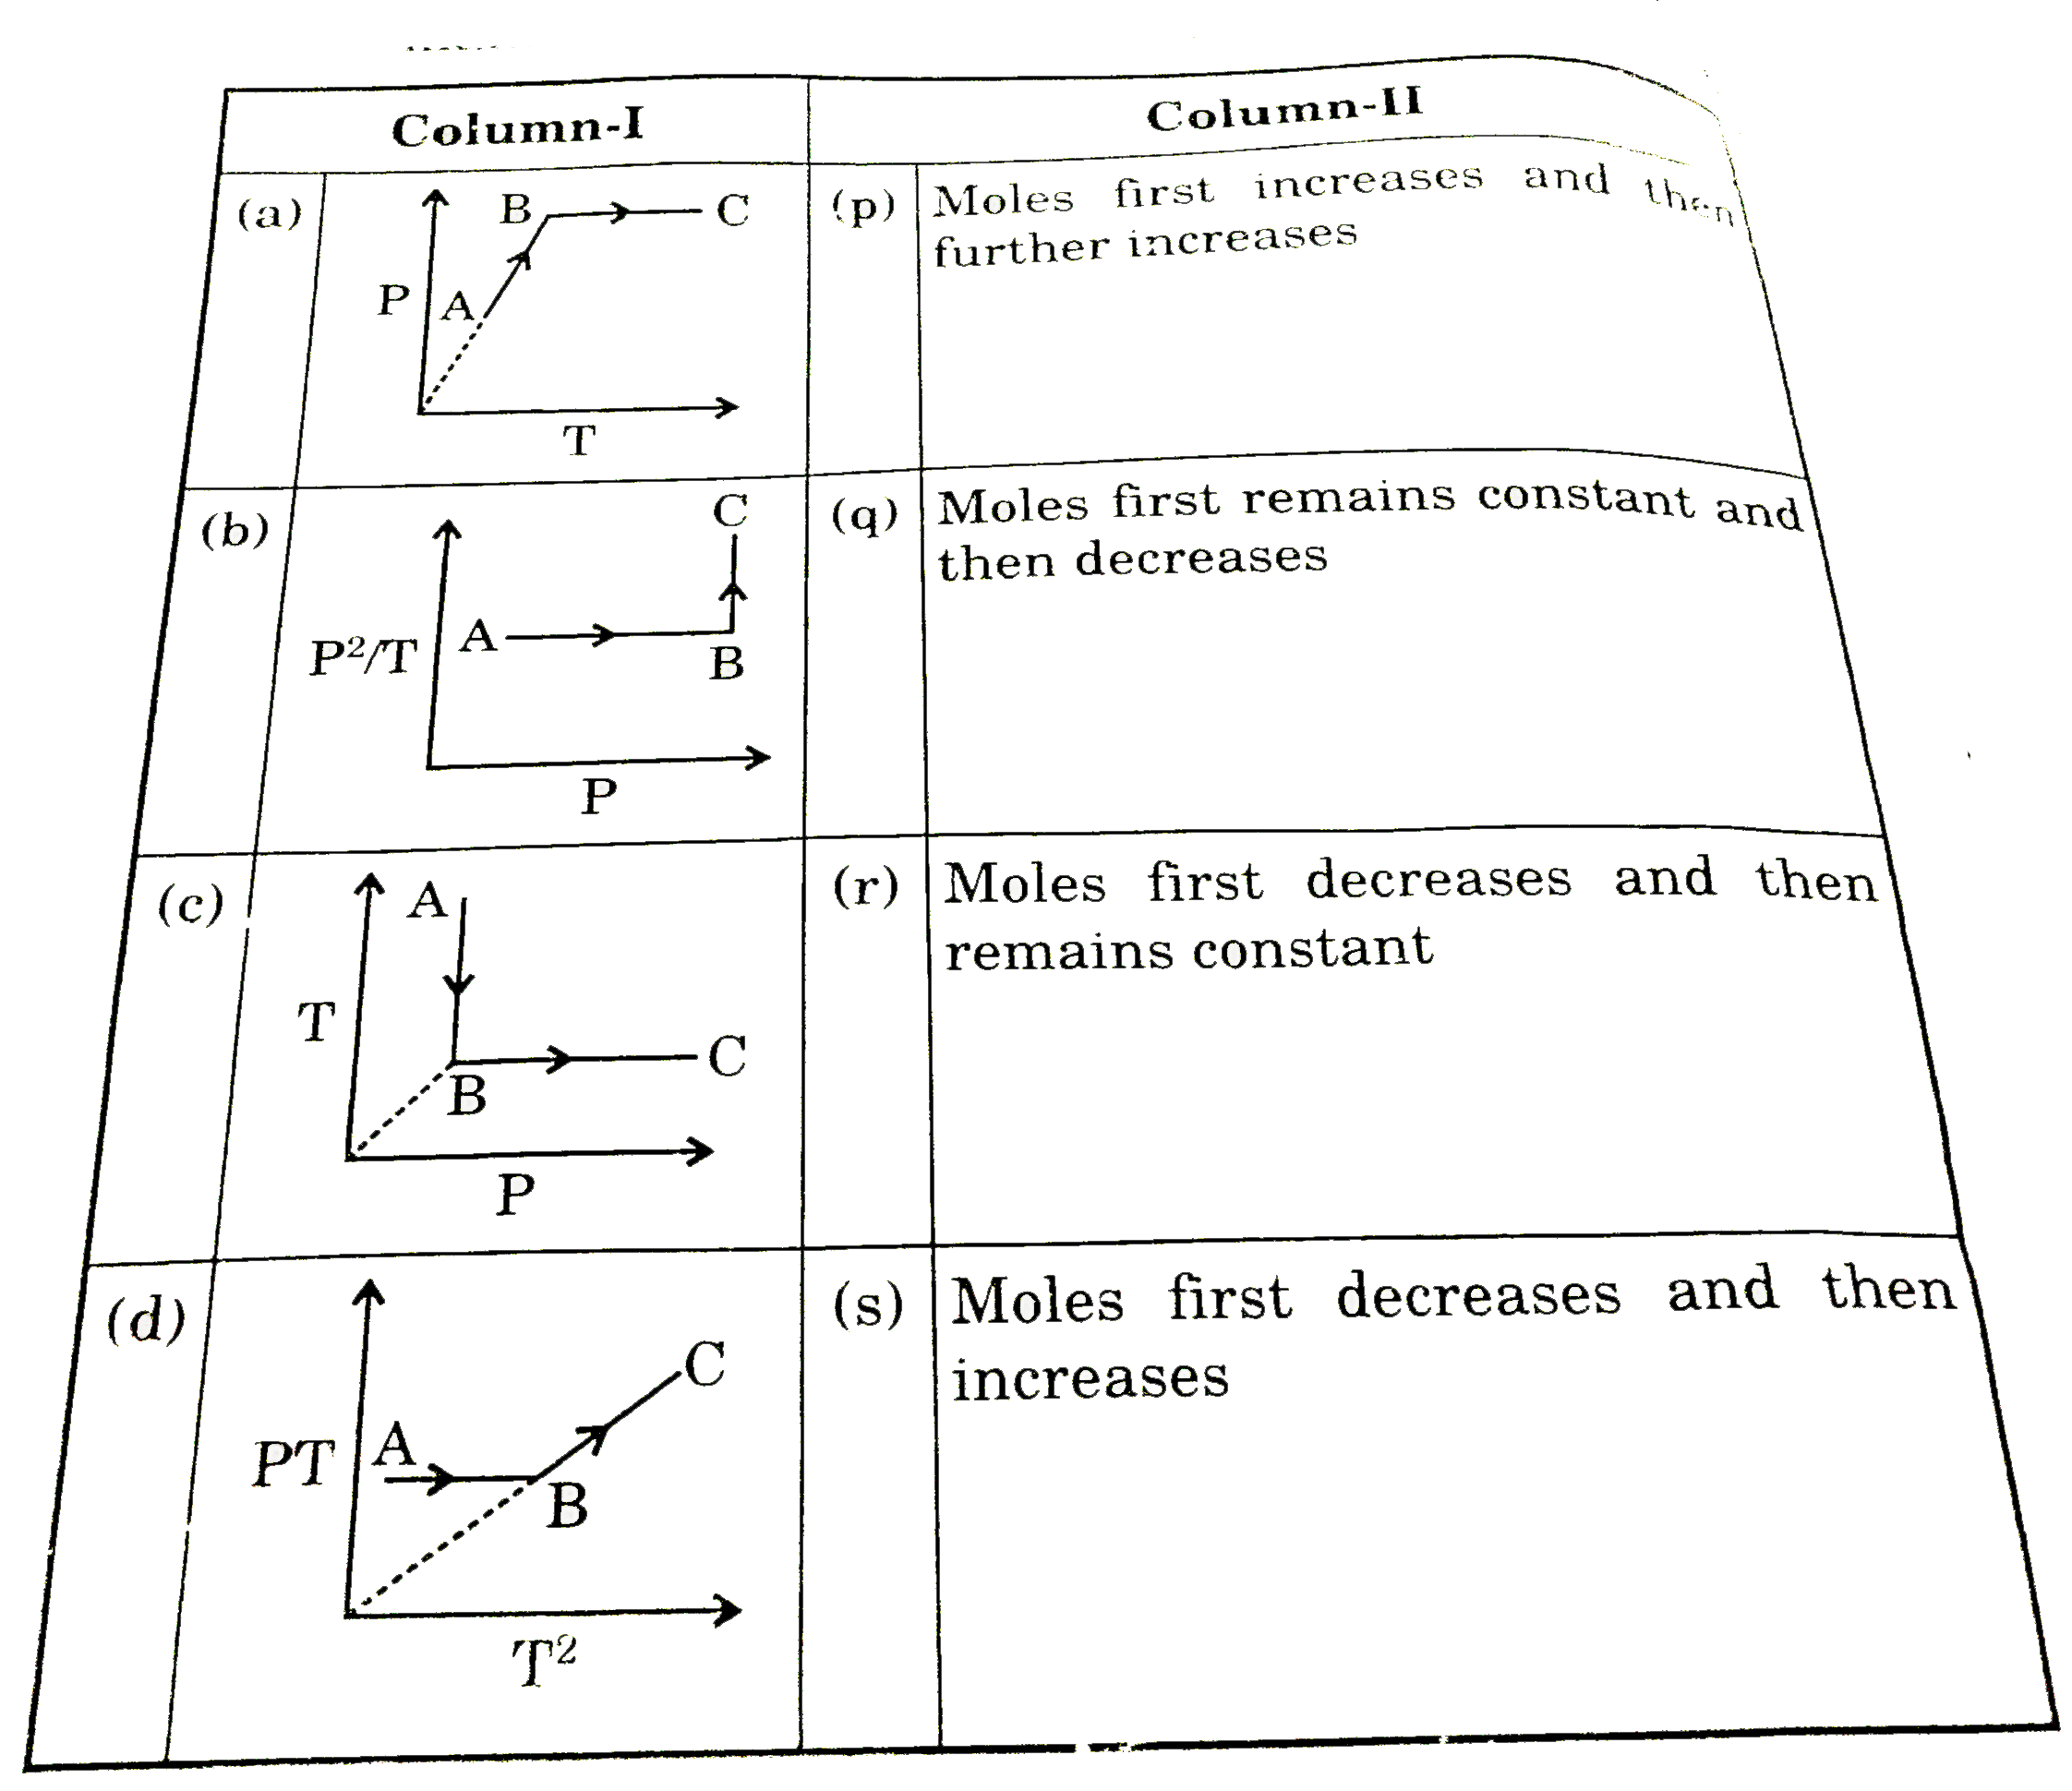
The following graphs are plotted for an ideal gas taken from state A to state B and then to state C, maintaining volume constant.

The correct Answer is:a-q; b-s; c-p; d-r
Step by step video, text & image solution for The following graphs are plotted for an ideal gas taken from state A to state B and then to state C, maintaining volume constant. by Chemistry experts to help you in doubts & scoring excellent marks in Class 12 exams.
Updated on:21/07/2023Topper's Solved these Questions
- GRAPHICAL INTERPRETATIONBOOK - GRB PUBLICATIONCHAPTER - GRAPHICAL INTERPRETATIONEXERCISE - Subjective Type
23 Videos
- GRAPHICAL INTERPRETATIONBOOK - GRB PUBLICATIONCHAPTER - GRAPHICAL INTERPRETATIONEXERCISE - Comprehension 29
1 Videos
- F-BLOCK ELEMENTSBOOK - GRB PUBLICATIONCHAPTER - F-BLOCK ELEMENTSEXERCISE - Subjective type
7 Videos
- HYDROCARBON (ALIPHATIC)BOOK - GRB PUBLICATIONCHAPTER - HYDROCARBON (ALIPHATIC)EXERCISE - Previous years jee questions
28 Videos
Similar Questions
Four moles of an ideal gas is initially in a state A having pressure 2×10⁵N/m2 and temperature 200 K . Keeping pressure constant the gas is taken to state B at temperature of 400K. The gas is then taken to a state C in such a way that its temperature increases and volume decreases. Also from B to C, the magnitude of dTdV increases. The volume of gas at state C is eaual to its volume at state A. Now gas is taken is initial state A keeping volume constant. A total of 1000 J heat is rejected from the sample in the cyclic process. Take R=8.3J/K/mol.
Which graph between temperture T and volume V for the cyclic process is correct.
View SolutionFour moles of an ideal gas is initially in a state A having pressure 2×10⁵N/m2 and temperature 200 K . Keeping pressure constant the gas is taken to state B at temperature of 400K. The gas is then taken to a state C in such a way that its temperature increases and volume decreases. Also from B to C, the magnitude of dTdV increases. The volume of gas at state C is eaual to its volume at state A. Now gas is taken is initial state A keeping volume constant. A total of 1000 J heat is rejected from the sample in the cyclic process. Take R=8.3J/K/mol.
The work done by the gas along path B to C is
View Solution
Knowledge Check
Equation of state of an ideal gas is
ApV=RT/nBpV=nRTCpn=VRTDpT=nRVFour moles of an ideal gas is initially in state A having pressure 2×10⁵N/m2 and temperature 200K . Keeping the pressure constant the gas is taken to state B at temperature of 400K. The gas is then taken to a state C in such a way that its temperature increases and volume decreases. Also from B to C , the magnitude of dT/dV increases. The volume of gas at state C is eqaul to its volume at statem A. Now gas is taken to initial state A keeping volume constant. A total 1000J of heat is withdrawn from the sample of the cyclic process . Take R=8.3J/K/mol. The volume of gas at state C is
A0.0332m3B0.22m3C0.332m3D3.32m3Four moles of an ideal gas is initially in state A having pressure 2×10⁵N/m2 and temperature 200K . Keeping the pressure constant the gas is taken to state B at temperature of 400K. The gas is then taken to a state C in such a way that its temperature increases and volume decreases. Also from B to C , the magnitude of dT/dV increases. The volume of gas at state C is eqaul to its volume at statem A. Now gas is taken to initial state A keeping volume constant. A total 1000J of heat is withdrawn from the sample of the cyclic process . Take R=8.3J/K/mol.
The work done in path B to C isA1000JB−1000JC−7640JD5640J
Four moles of an ideal gas is initially in state A having pressure 2×10⁵N/m2 and temperature 200K . Keeping the pressure constant the gas is taken to state B at temperature of 400K. The gas is then taken to a state C in such a way that its temperature increases and volume decreases. Also from B to C , the magnitude of dT/dV increases. The volume of gas at state C is eqaul to its volume at statem A. Now gas is taken to initial state A keeping volume constant. A total 1000J of heat is withdrawn from the sample of the cyclic process . Take R=8.3J/K/mol.
Which graph between temperature T and volume V for the cyclic process is correct.
View SolutionAn ideal gas taken from state A(P,V) to the state B(P/2,2V) along a straight path in PV diagram. Select the correct option(s).
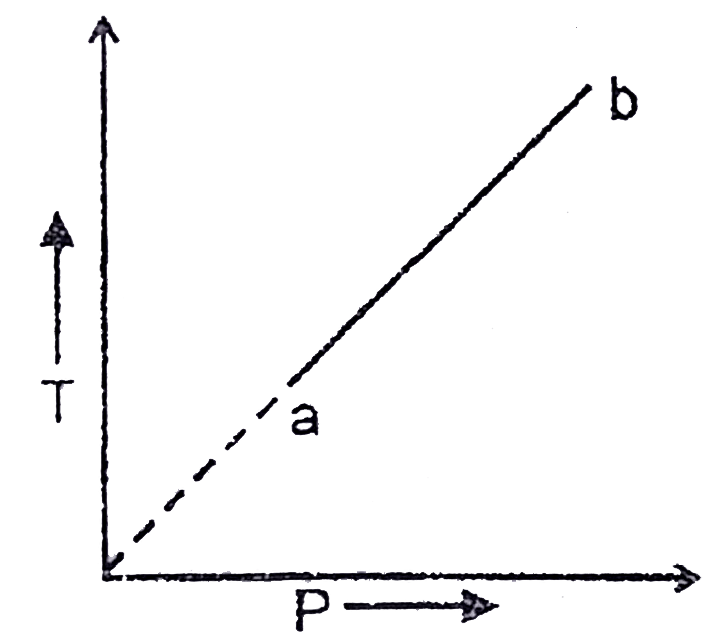
View SolutionAn ideal gas change from state a to state b as shown in Fig. what is the work done by the gas in the process?

View SolutionWhen a sample of ideal gas is changed from an initial state to a final state, various curves can be plotted for the process like P-V curve, V-T curve,P-T curve etc.
For example, P-V curve for a fixed amount of an ideal gas at constant temperature is a rectangular hyperbola, V-T curve for a fixed amount of an ideal gas at constant volume is again a straight line. However, the shapes may vary if the constant parameters are also changed.
Now, answer the following questions :
Which of the following graphs is not possible for a fixed amount of ideal gas upon moving from initial state A to final state B :
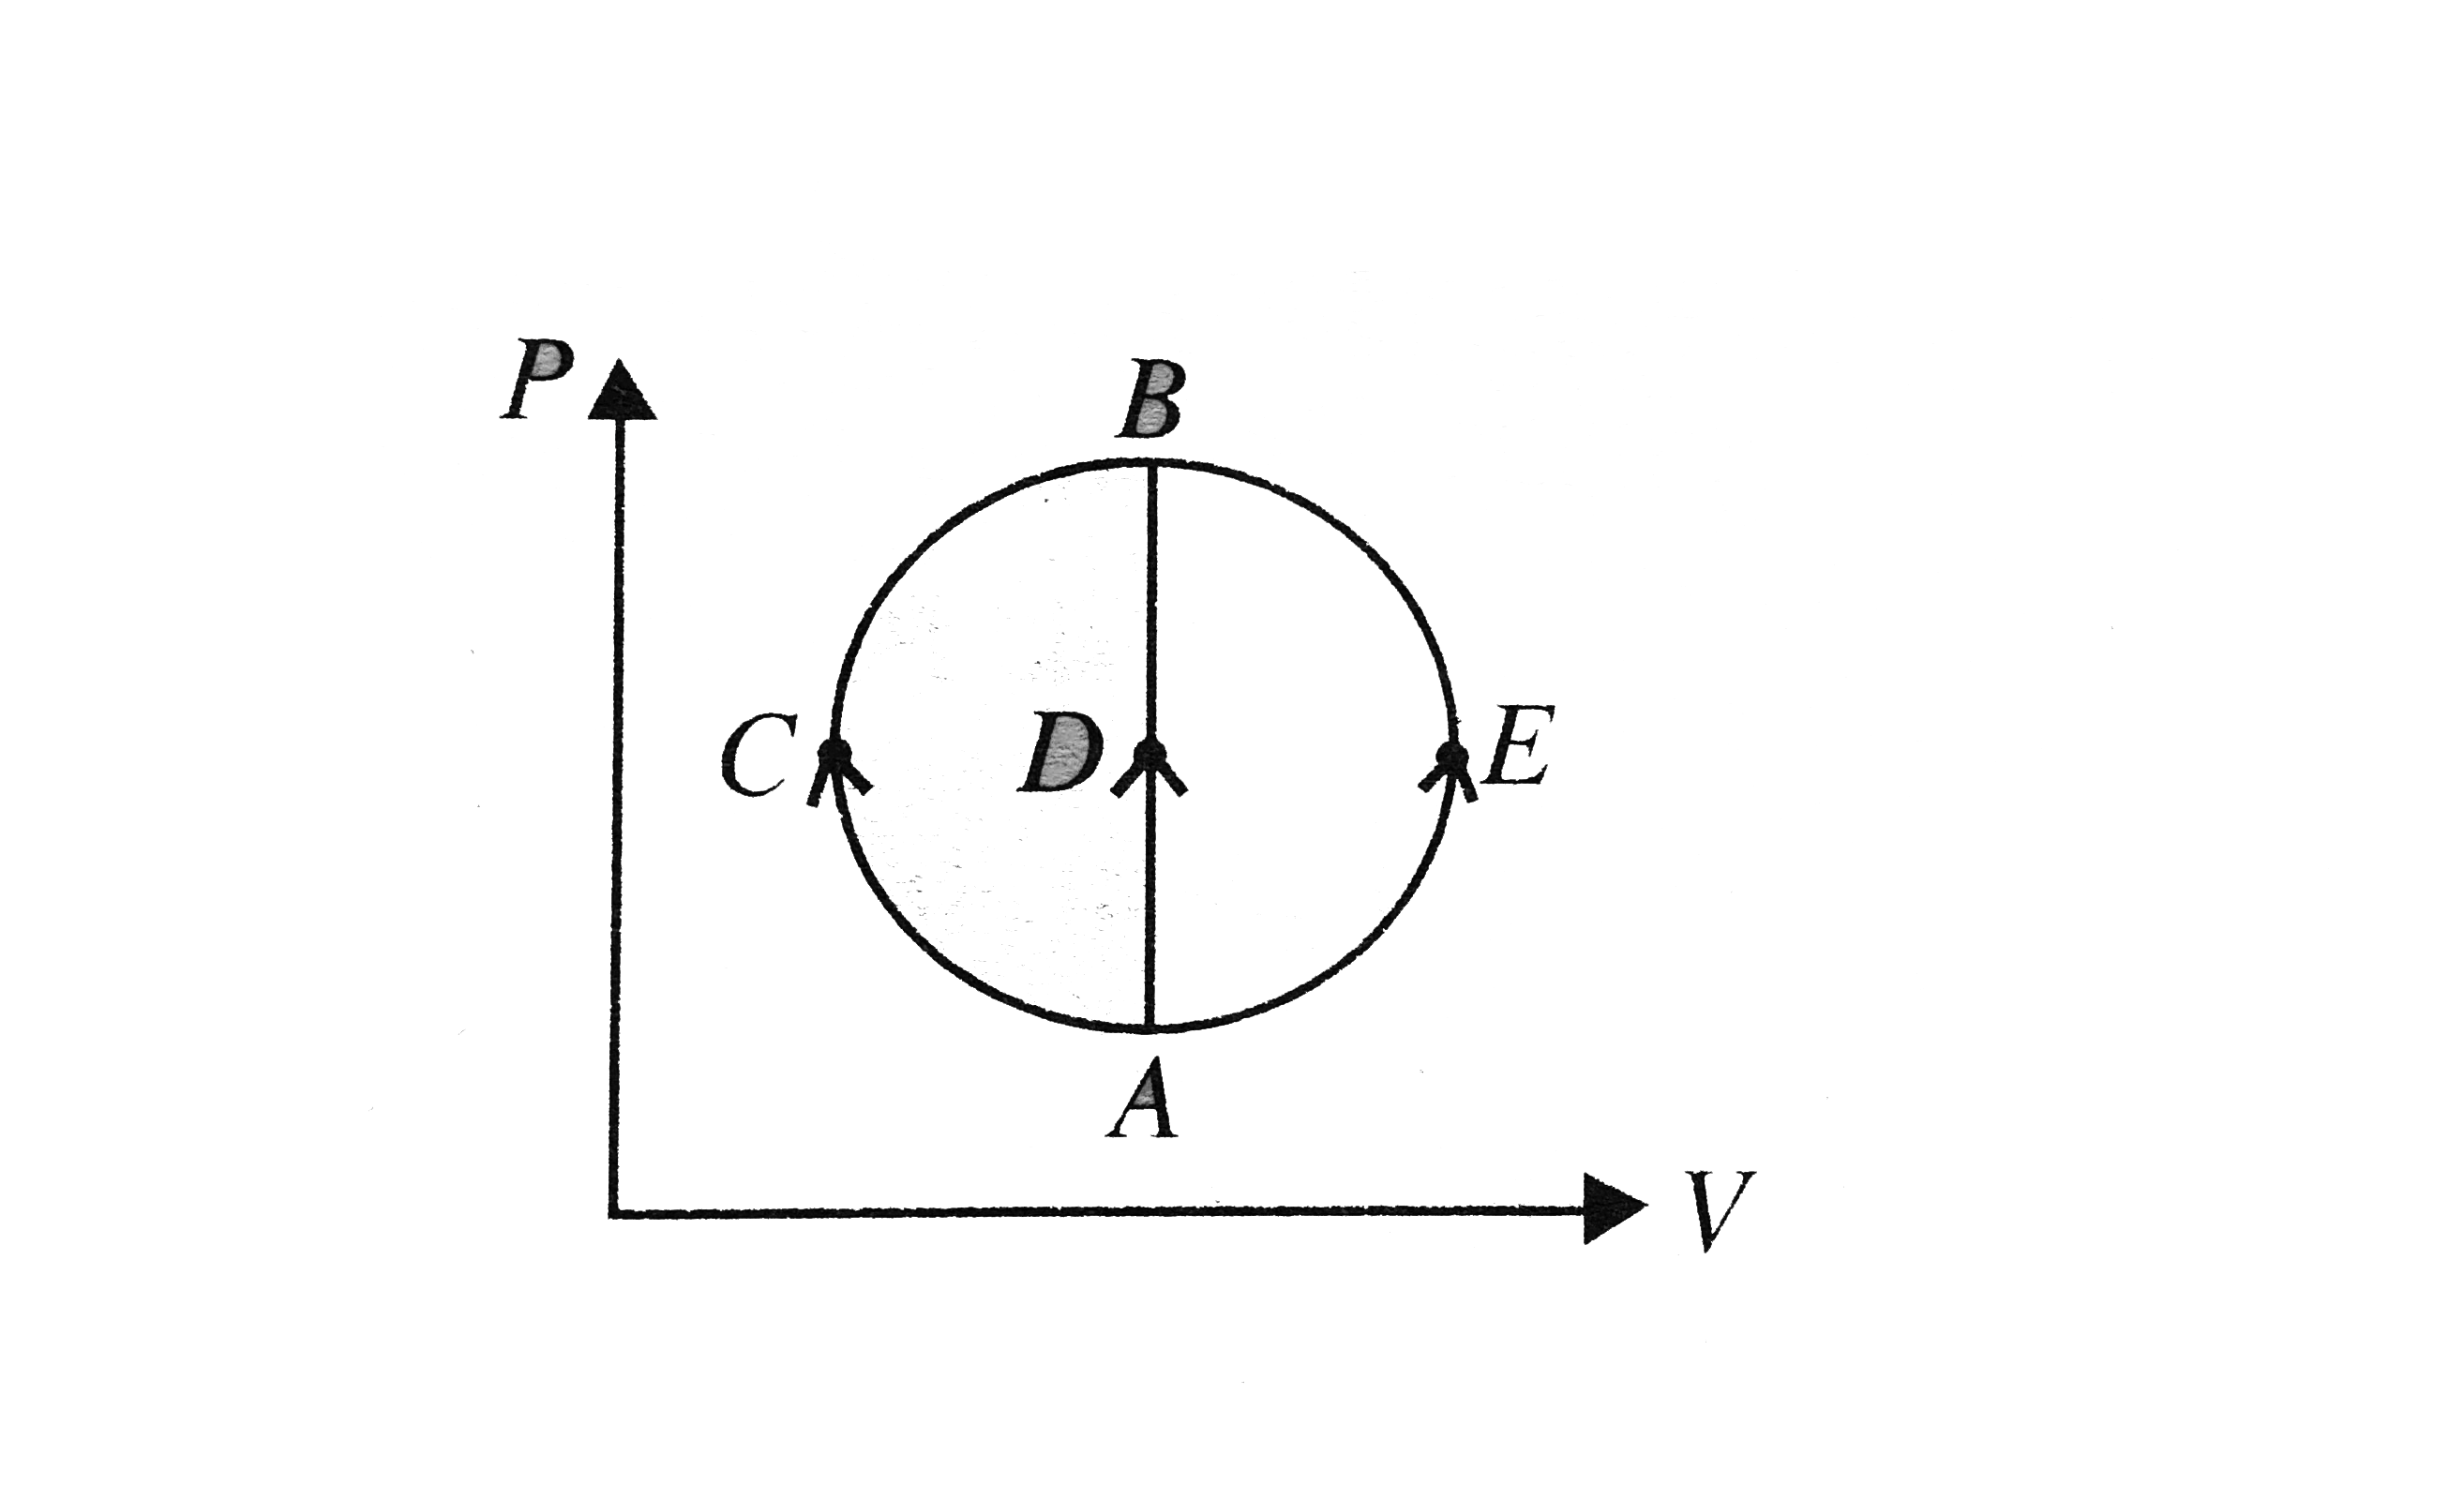
View SolutionOne mole of an ideal gas is taken from state A to state B by three different processes (a) ACB, (b) ADB and (c ) AEB as shown in the P−V diagram. The heat absorbed by the gas is

View Solution
