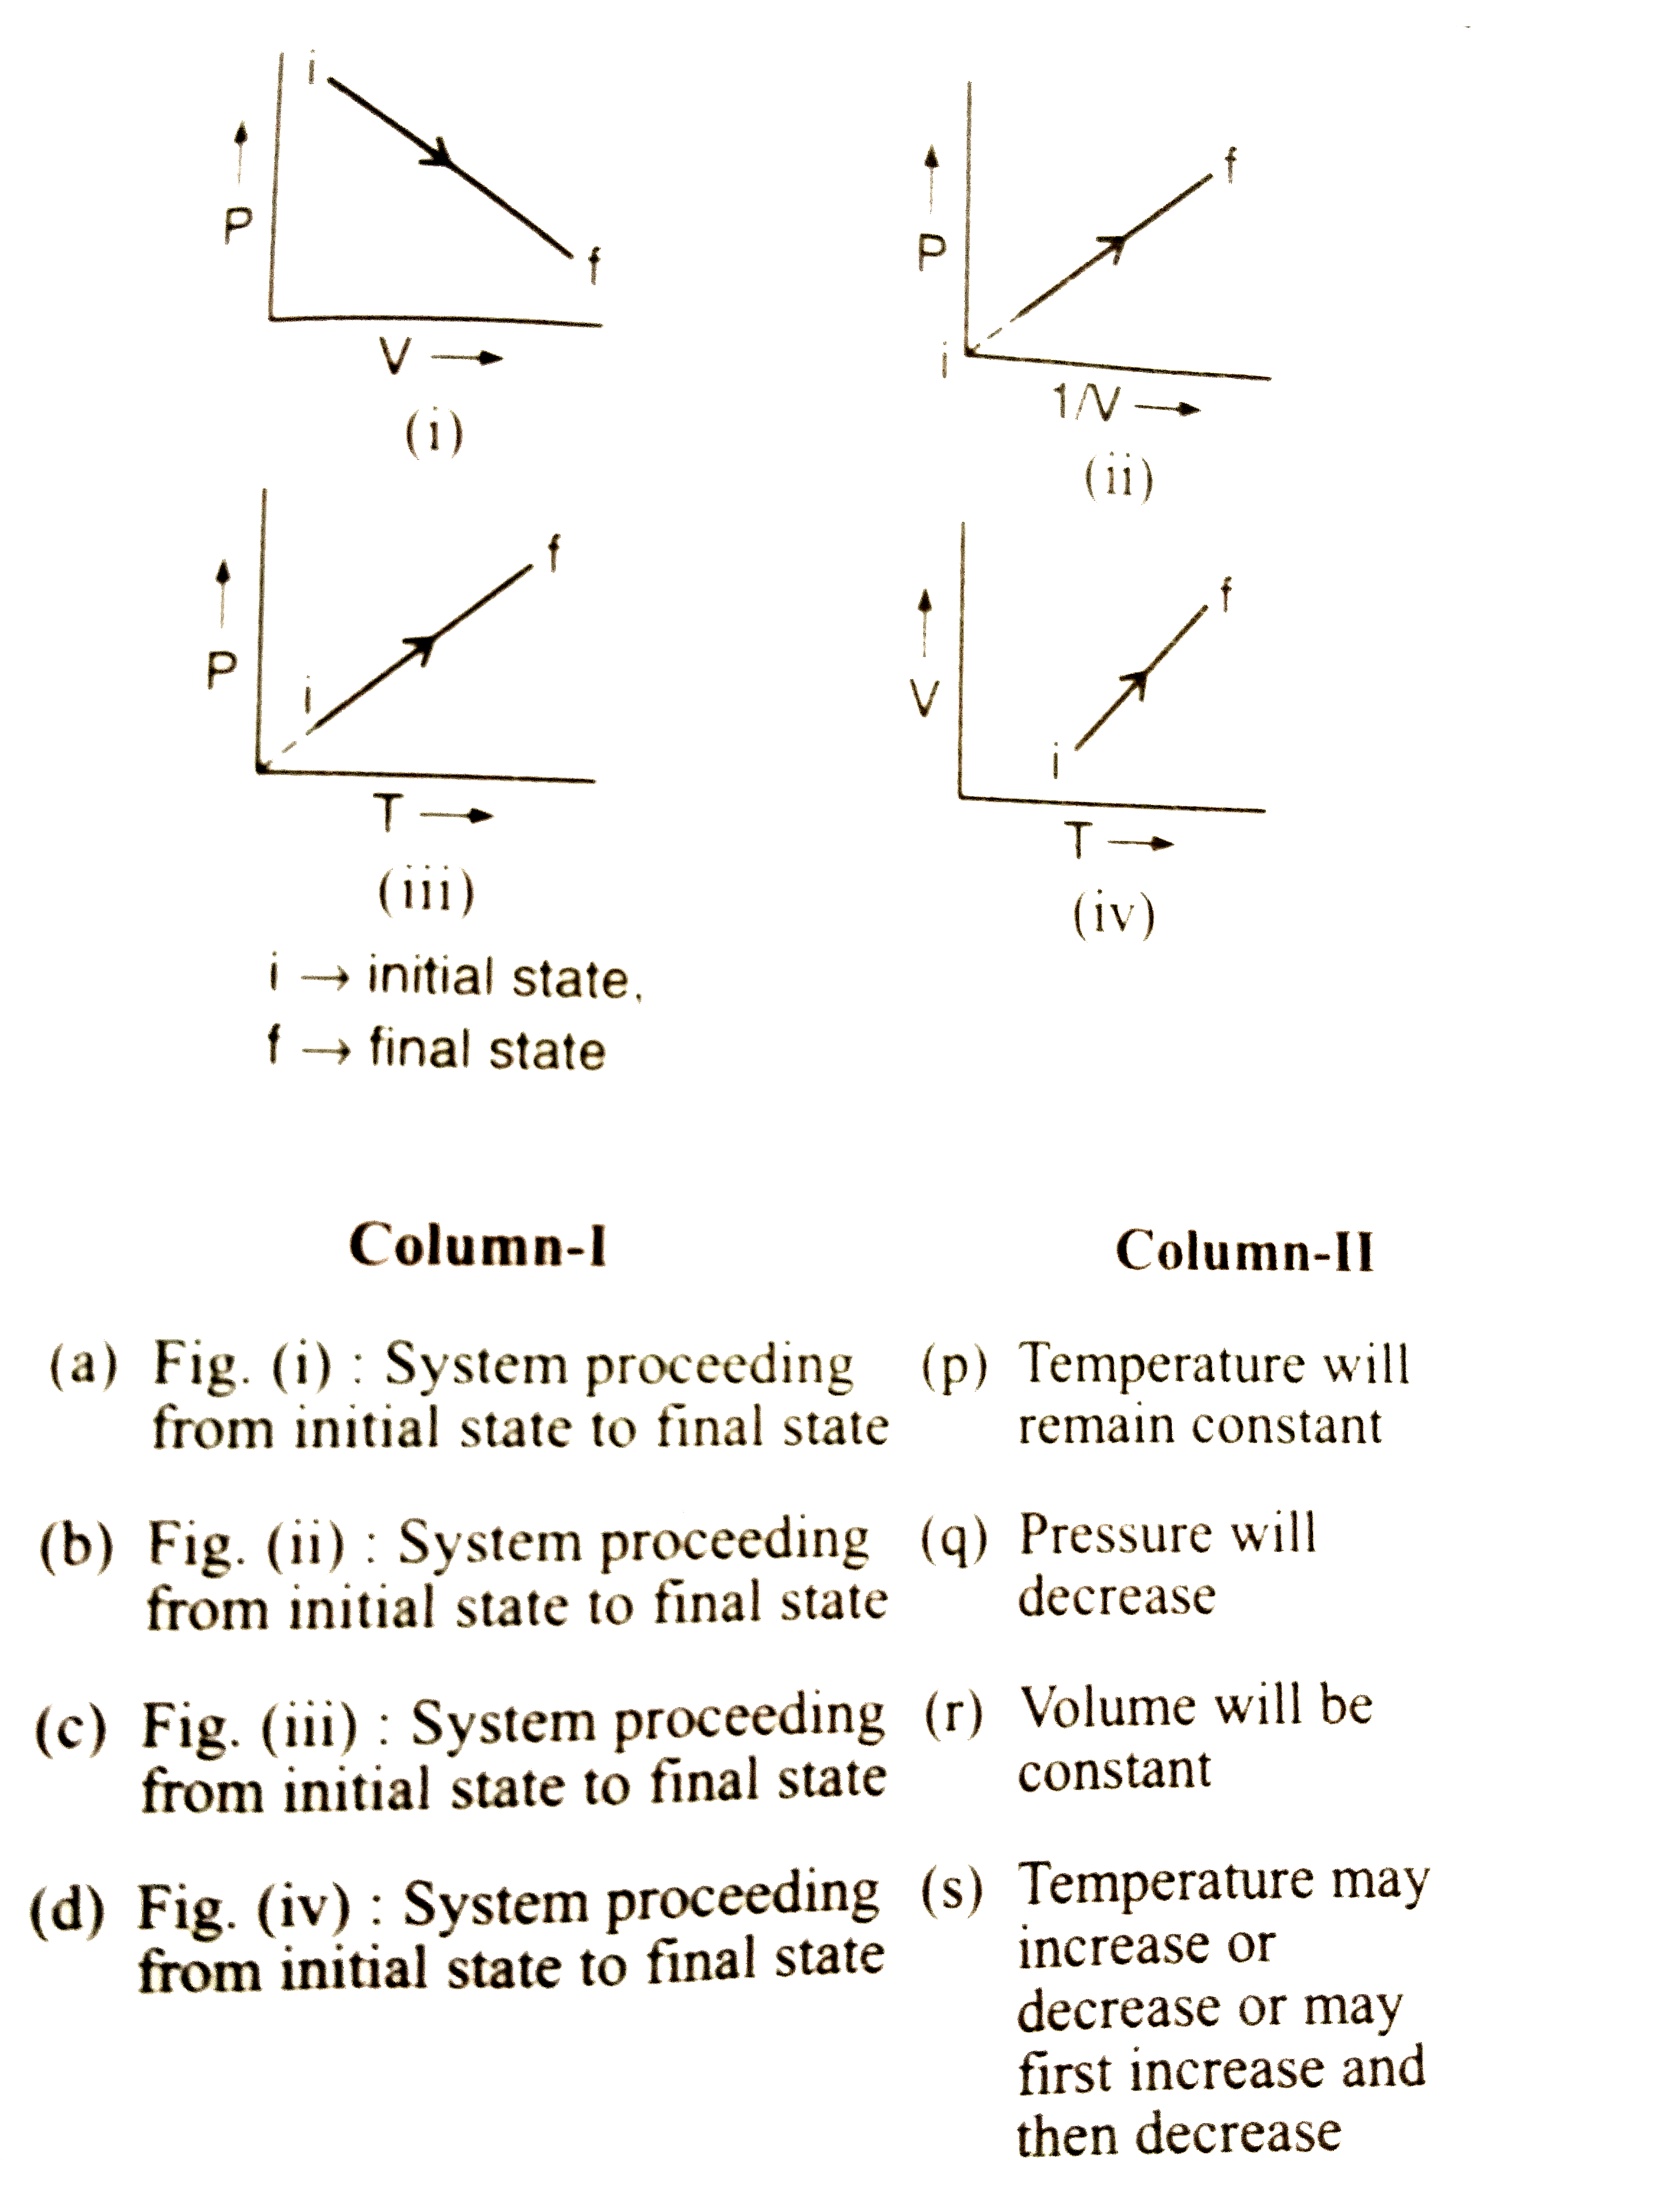
The figures given below depict different processes for a given amount of an ideal gas.

The correct Answer is:a-q,r,t; b-s; c-q,r; d-p,s,t
Topper's Solved these Questions
- GRAPHICAL INTERPRETATIONBOOK - GRB PUBLICATIONCHAPTER - GRAPHICAL INTERPRETATIONEXERCISE - Subjective Type
23 Videos
- GRAPHICAL INTERPRETATIONBOOK - GRB PUBLICATIONCHAPTER - GRAPHICAL INTERPRETATIONEXERCISE - Comprehension 29
1 Videos
- F-BLOCK ELEMENTSBOOK - GRB PUBLICATIONCHAPTER - F-BLOCK ELEMENTSEXERCISE - Subjective type
7 Videos
- HYDROCARBON (ALIPHATIC)BOOK - GRB PUBLICATIONCHAPTER - HYDROCARBON (ALIPHATIC)EXERCISE - Previous years jee questions
28 Videos
Similar Questions
The diagrams below depict the different process for a give amount of an ideal gas. Match the column -I with Column-II
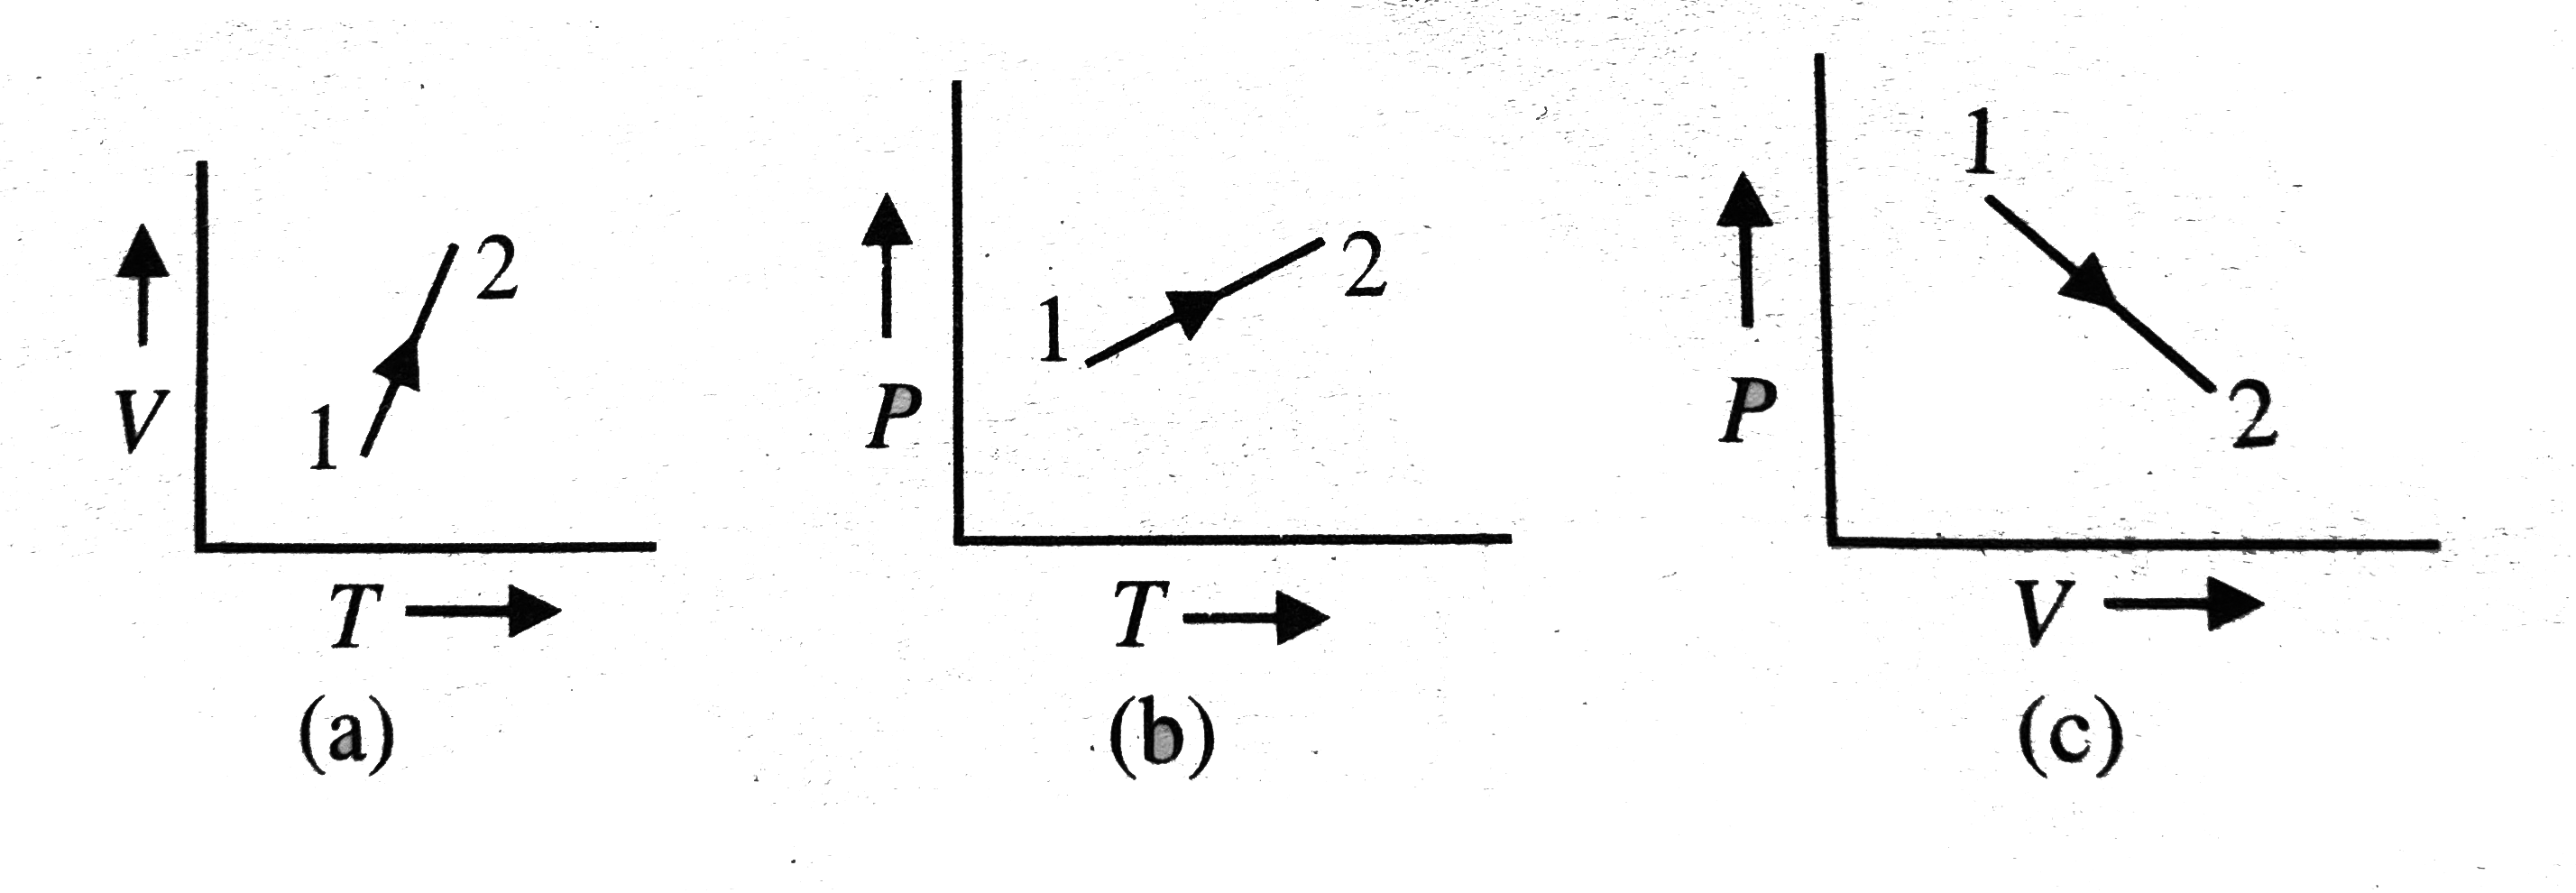
View SolutionThe three diagrams below depict three different processes for a given mass of an ideal gas. What information can be drawn regarding the change of (a) pressure, (b) volume and (c ) temperature of the gas from the plots as shown in Fig., respectively.
View Solution
Knowledge Check
Which of the figures given below show the adiabatic process ?
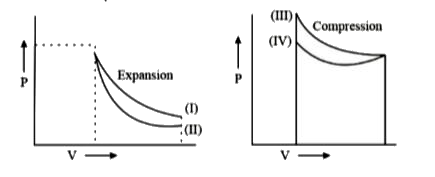 AI,IIIBI,IIICII, IVDI,IV
Which of the following curve is correct for a given amount of an ideal gas at constant pressure?
A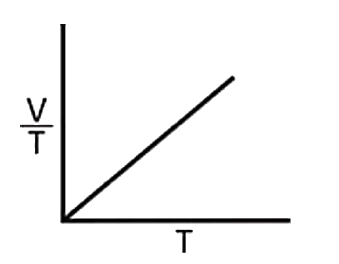 B
B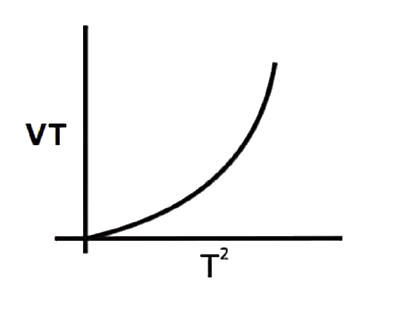 C
C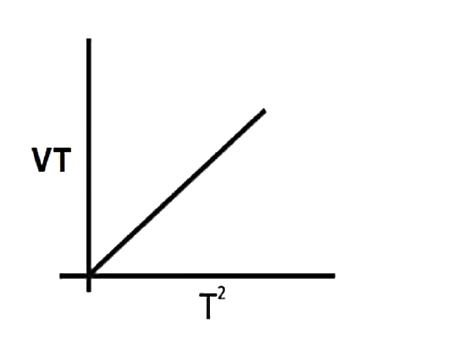 D
D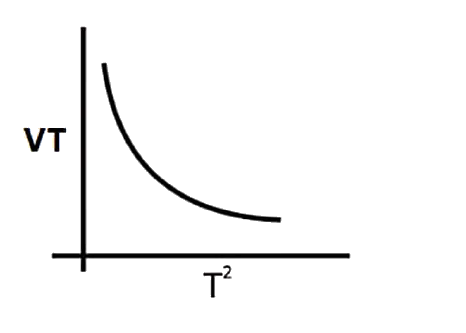
The graph given below shows the P-V plot for a process on an ideal gas. Select the correct statement.
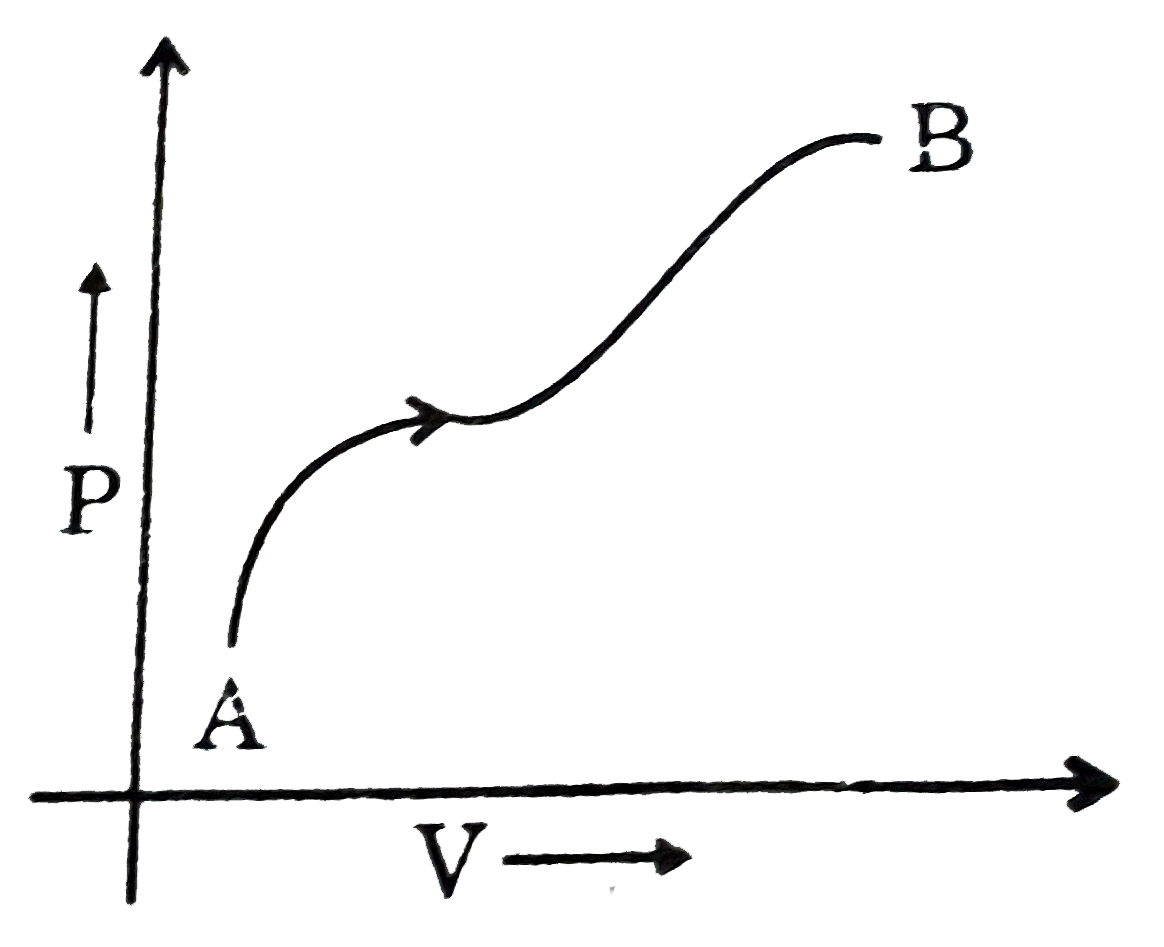 AEnthalpy content of the gas is constantly increasing and the process is carried out slowlyBEnthalpy content of the gas first increases then decreases and the process is quasistaticlyCEnthalpy content of the gas is constant and the process taken infinite amount of time for completionDEnthalpy content first decreases then increases and the process is reversible
The three diagrams below depict three different processes for a given mass of an ideal gas. What information can be drawn regarding the change of (a) pressure, (b) volume and (c ) temperature of the gas from the plots as shown in Fig., respectively.

View SolutionThe figures given below show different processes (relating pressure P and volume V) for a given amount of an ideal gas. W is work done by the gas and ΔQ is heat absorbed by the gas.
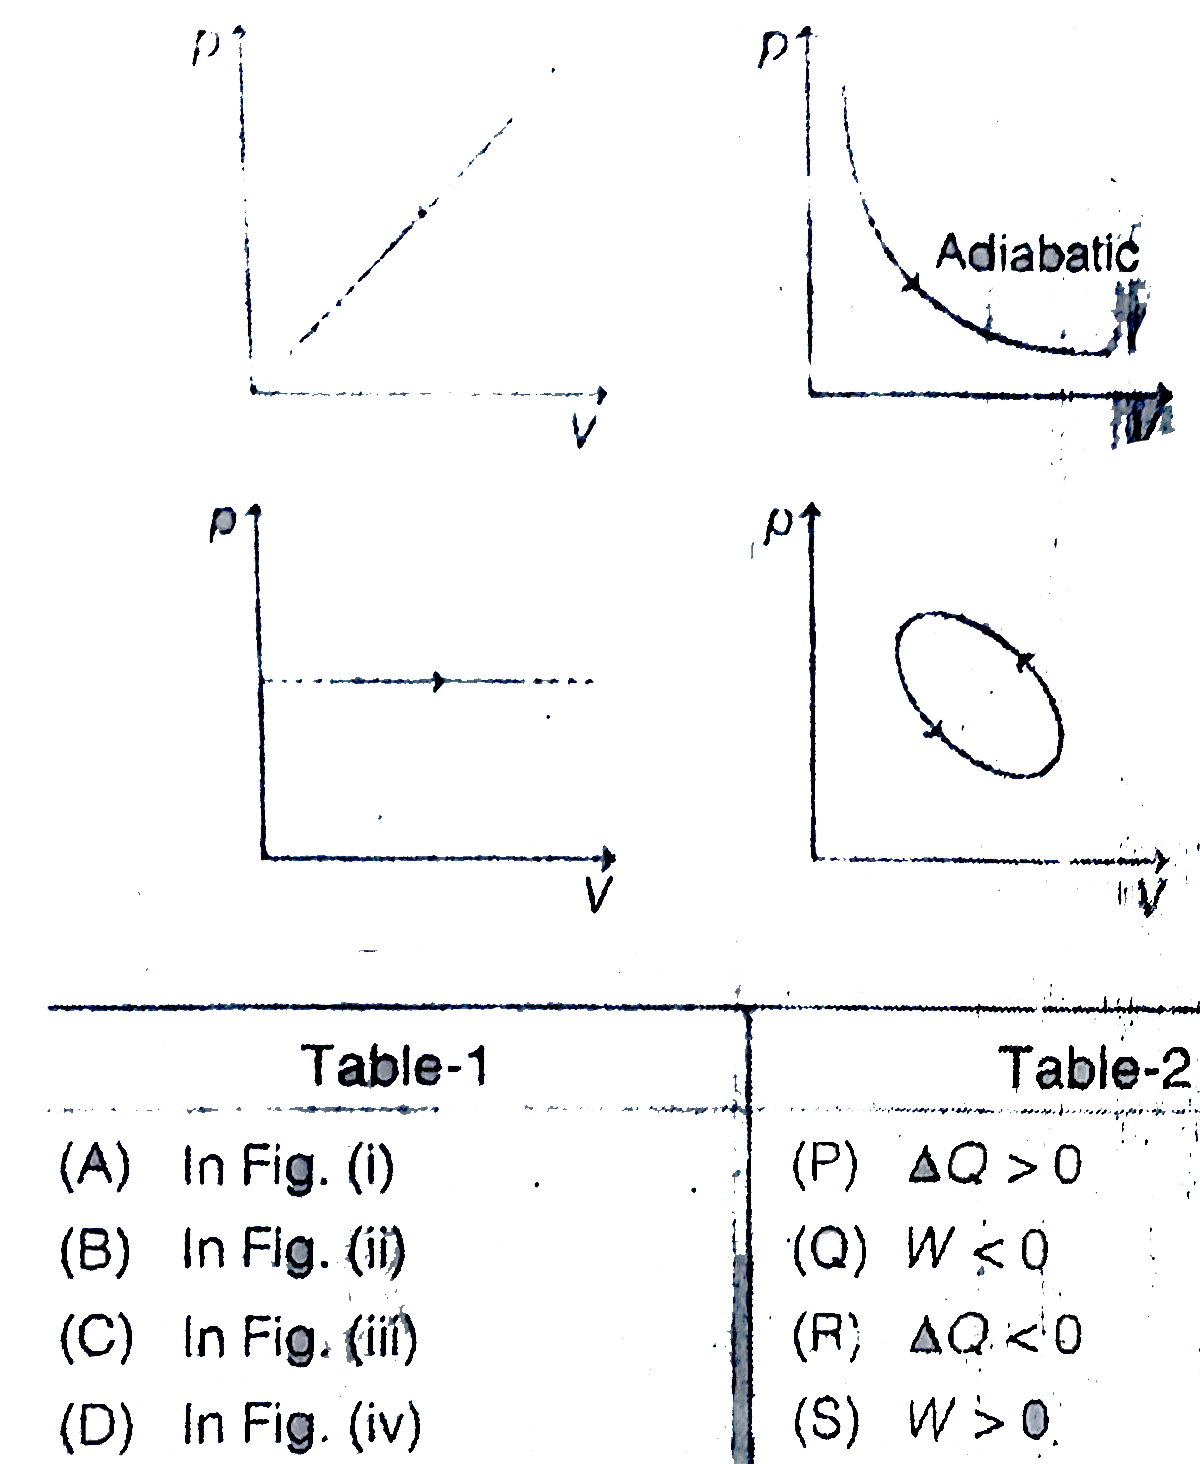
View SolutionThe figures given below show different processes (relating pressure P and volume V) for a given amount of an ideal gas. W is work done by the gas and ΔQ is heat absorbed by the gas.

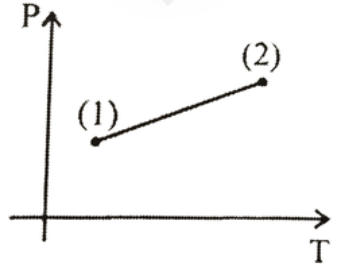
View SolutionFigure shows a process for a given amount of an ideal gas. If volume in state 1 is V1 & in state 2 is V2, then
View SolutionWhich of the following curve is correct for a given amount of an ideal gas at constant pressure?
View Solution
