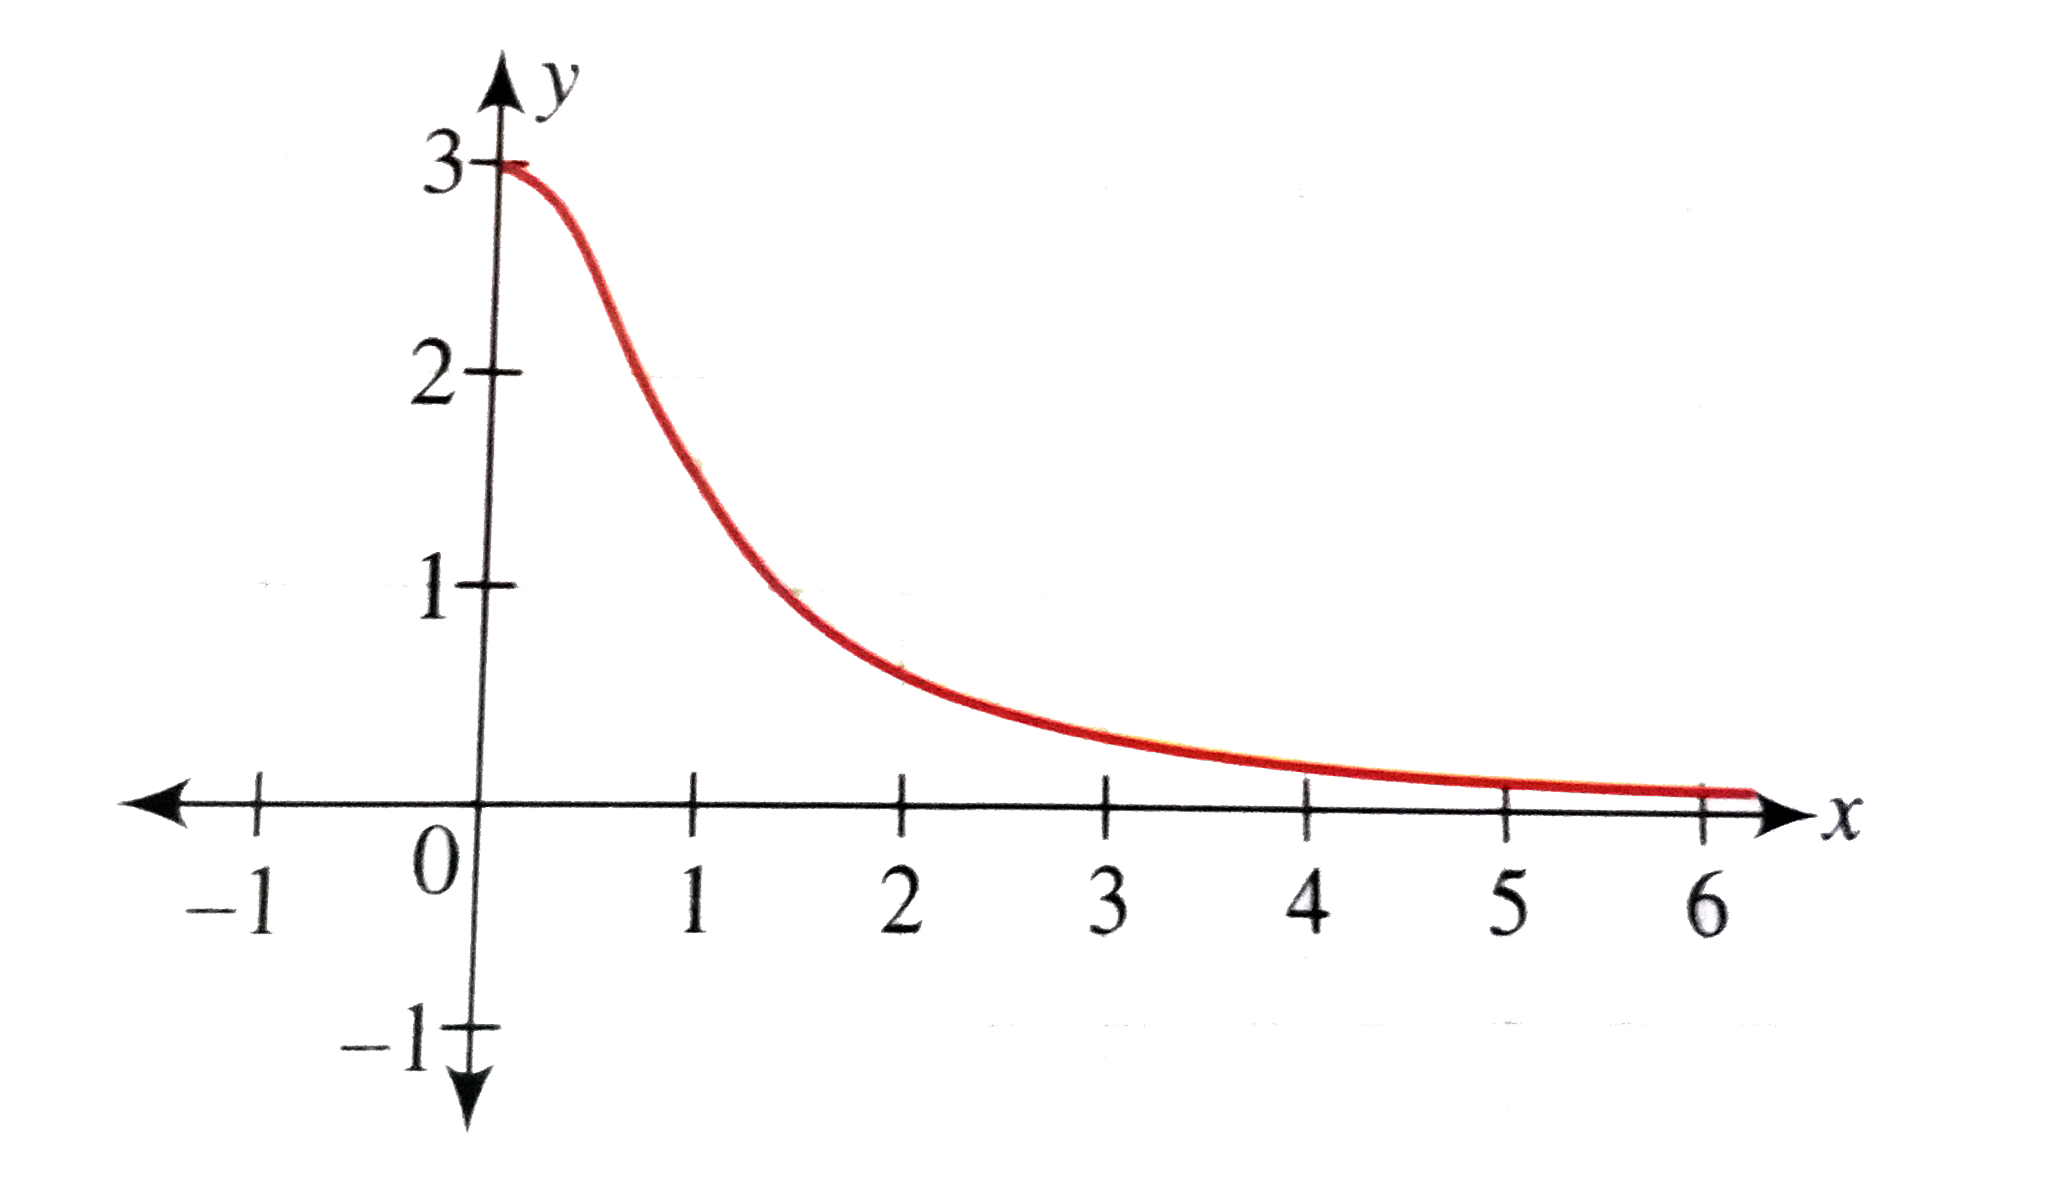
Graph of f(x) is shown in adjacent figure, then in [0,5]
Step by step video & image solution for Graph of f(x) is shown in adjacent figure, then in [0, 5] by Maths experts to help you in doubts & scoring excellent marks in Class 12 exams.
Updated on:21/07/2023Similar Questions
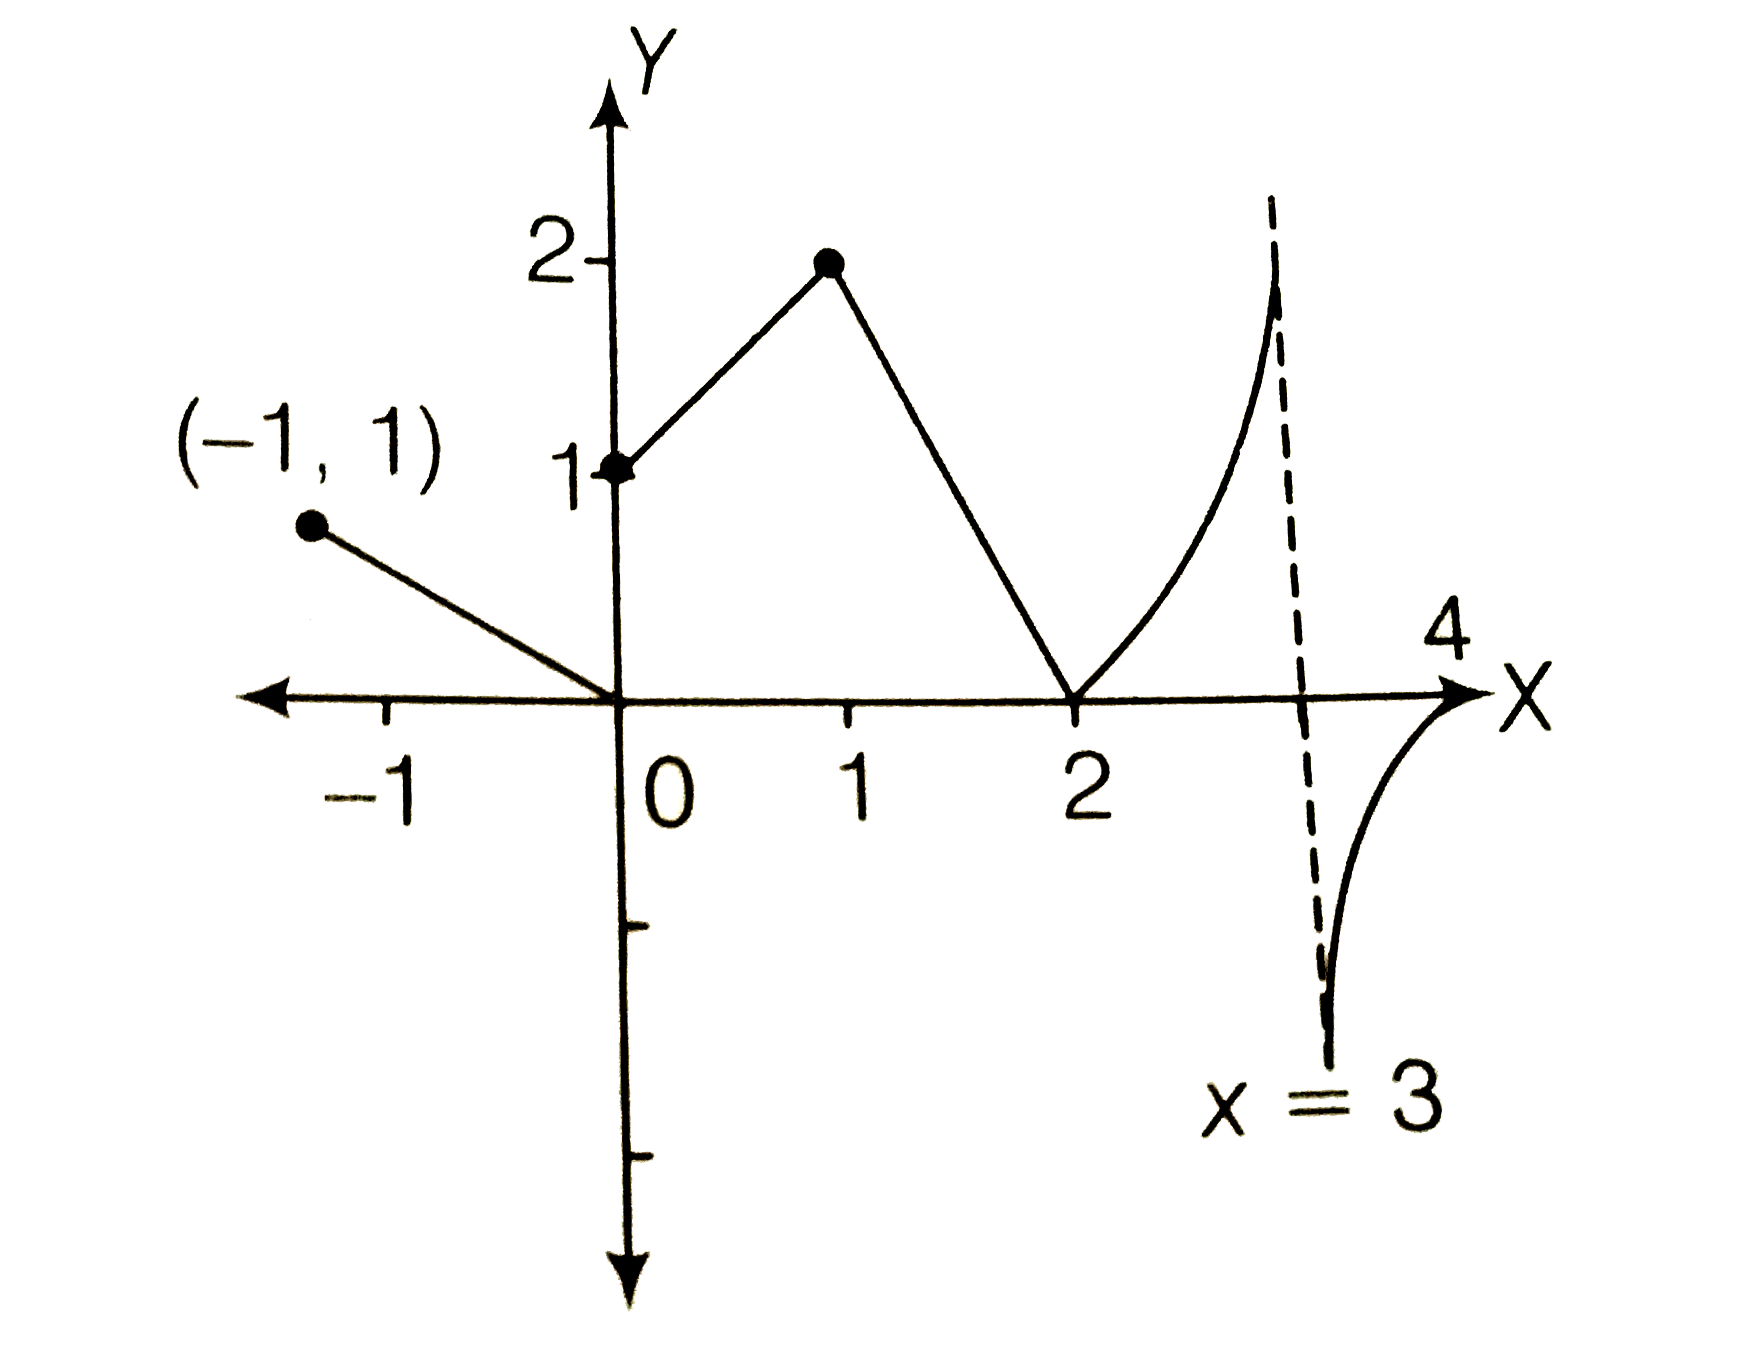
The graph of y=f(x) is as shown in the following figure. Draw the graph of y=[f(x)].
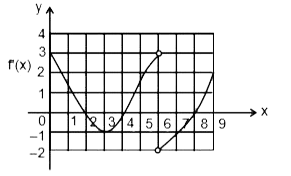
View Solutionएक सतत फलन f के अवकलज f' का ग्राफ चित्र में दर्शाया गया है तथा f(0)=0 है, तो फलन y=f(x) के लिए ज्ञात कीजिए -
एकदिष्टता के अन्तराल
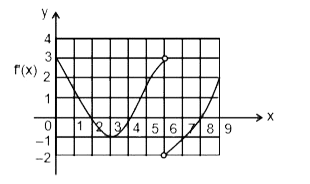
View Solutionएक सतत फलन f के अवकलज f' का ग्राफ चित्र में दर्शाया गया है तथा f(0)=0 है, तो फलन y=f(x) के लिए ज्ञात कीजिए -
नति परिवर्तन बिन्दु
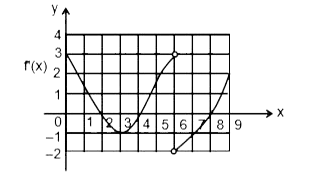
View Solutionएक सतत फलन f के अवकलज f' का ग्राफ चित्र में दर्शाया गया है तथा f(0)=0 है, तो फलन y=f(x) के लिए ज्ञात कीजिए -
क्रान्तिक बिन्दु
View SolutionThe graph of the function y=f(x) is shown in the adjacent figure then correct statement is
View SolutionIf graph of a function f(x) is shown in the adjacent figure, then Limx→0−[4f(x)−6[f(x)]tan(2f(x)−6)] is equal to
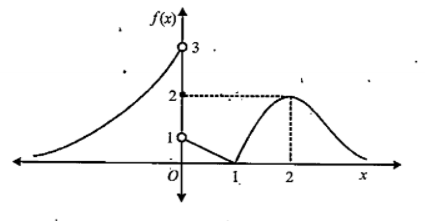
View SolutionIf graph of a function f(x) is shown in the adjacent figure, then Limx→0−[4f(x)−6[f(x)]tan(2f(x)−6)] is equal to

View SolutionThe graph of the function y=f(x) is shown in the adjacent figure then correct statement is

View Solution
