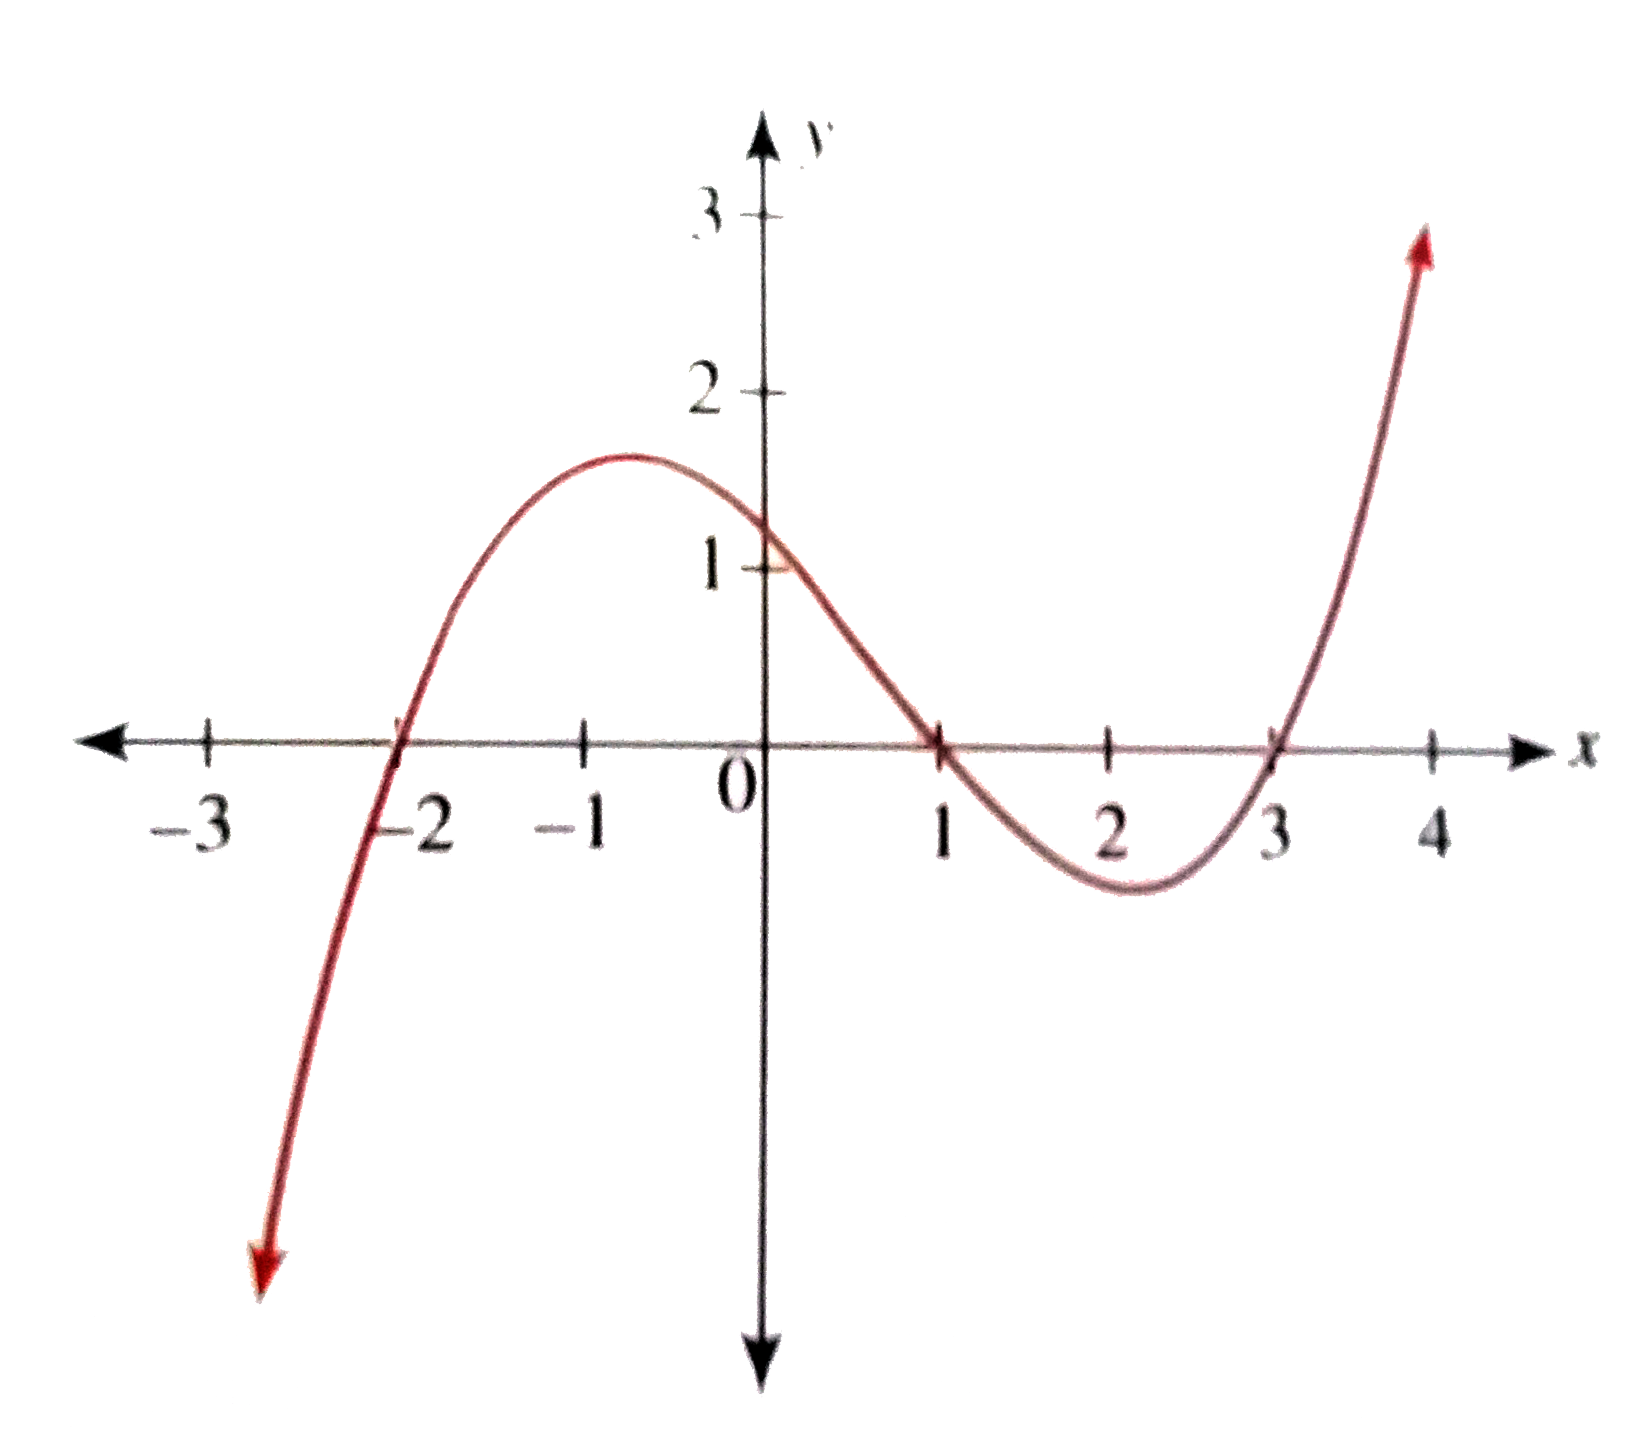
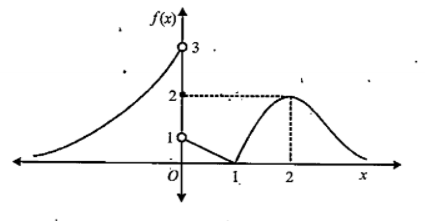
The graph of the function y=f(x) is shown in the adjacent figure then correct statement is
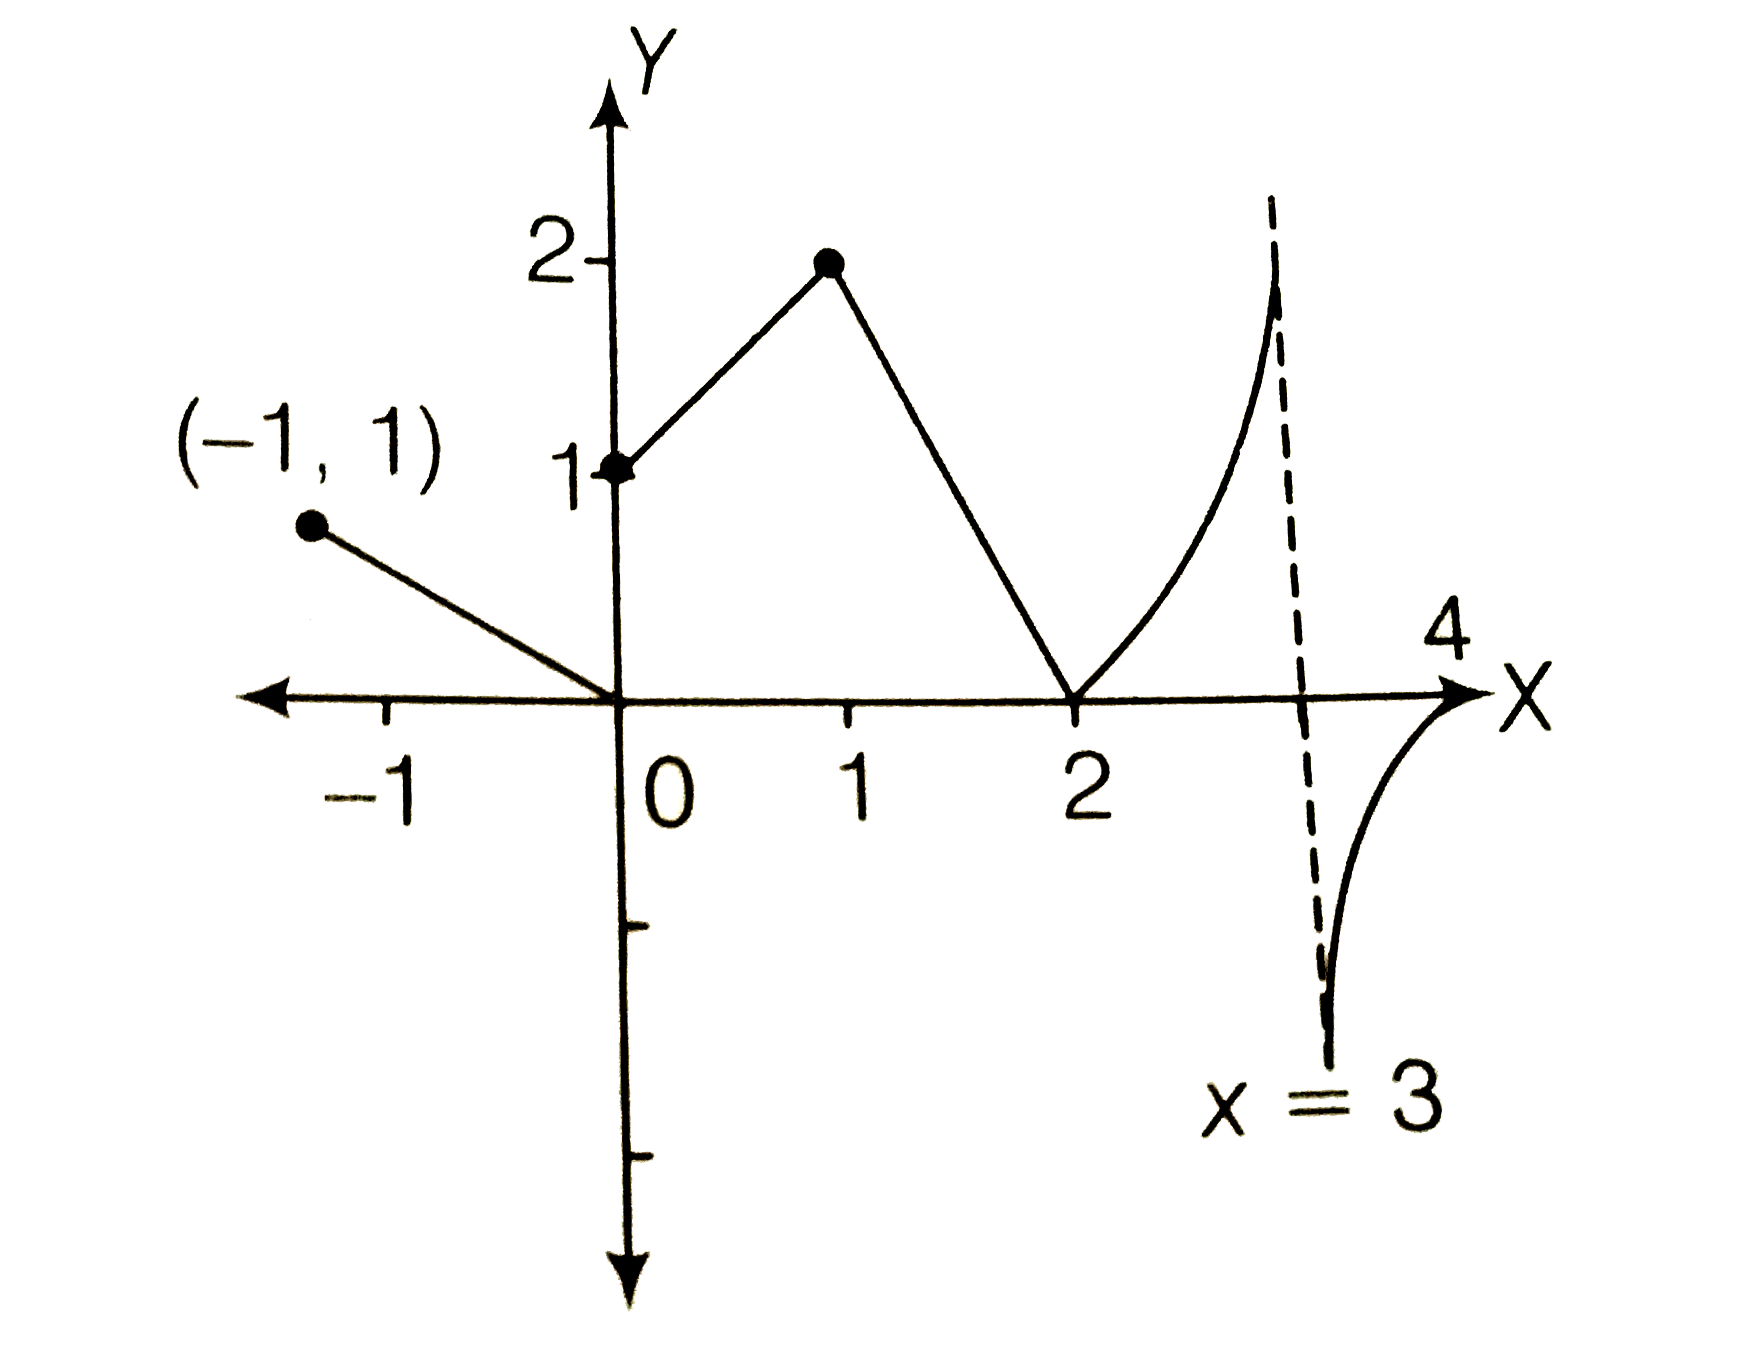
limx→0+f(x)=1
limx→1f(x)=2
limx→3f(x)= does not exist
limx→4f(x)=0
The correct Answer is:A, B, C, D
Step by step video & image solution for The graph of the function y=f(x) is shown in the adjacent figure then correct statement is by Maths experts to help you in doubts & scoring excellent marks in Class 12 exams.
Updated on:21/07/2023Topper's Solved these Questions
- LIMITSBOOK - ARIHANT MATHSCHAPTER - LIMITSEXERCISE - Exercise (Passage Based Questions)
13 Videos
- LIMITSBOOK - ARIHANT MATHSCHAPTER - LIMITSEXERCISE - Exercise (Matching Type Questions)
3 Videos
- LIMITSBOOK - ARIHANT MATHSCHAPTER - LIMITSEXERCISE - Exercise (Single Option Correct Type Questions)
40 Videos
- INVERSE TRIGONOMETRIC FUNCTIONSBOOK - ARIHANT MATHSCHAPTER - INVERSE TRIGONOMETRIC FUNCTIONSEXERCISE - Exercise (Questions Asked In Previous 13 Years Exam)
8 Videos
- LOGARITHM AND THEIR PROPERTIESBOOK - ARIHANT MATHSCHAPTER - LOGARITHM AND THEIR PROPERTIESEXERCISE - Exercise (Questions Asked In Previous 13 Years Exam)
4 Videos
Similar Questions
Knowledge Check
In the circuit shown in the adjacent figure
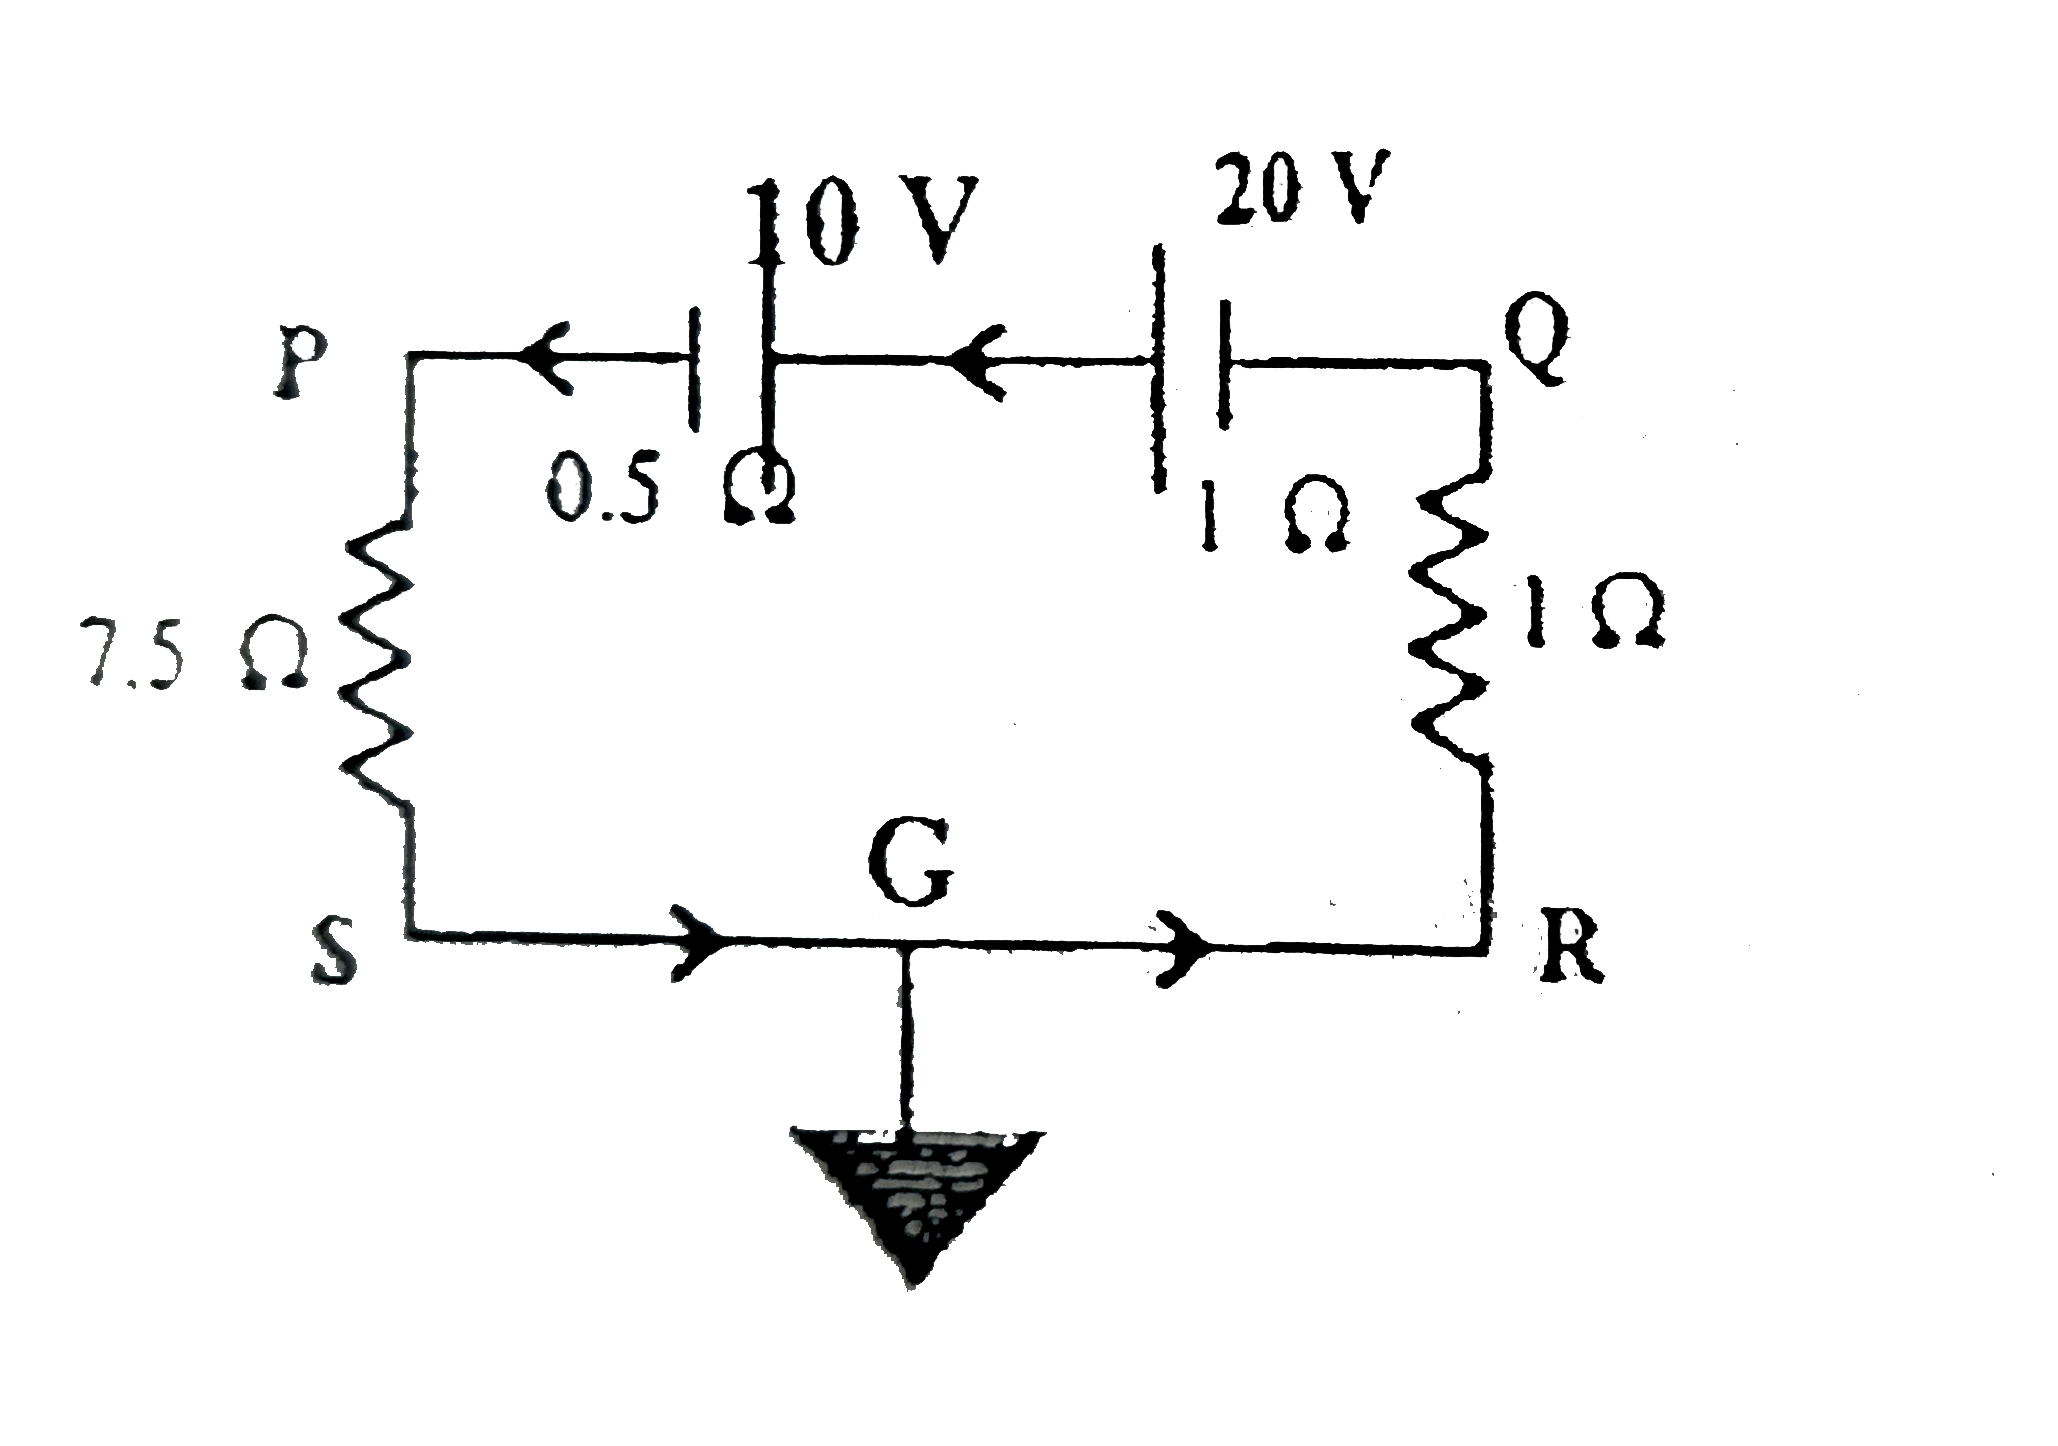 Athe potential at P is −7.5VBthe potential at Q is −1VCthe potential at R is zeroDthe potential at S is zero
The figure illustrates the graph of the function y=f(x) defined in [-3, 2].
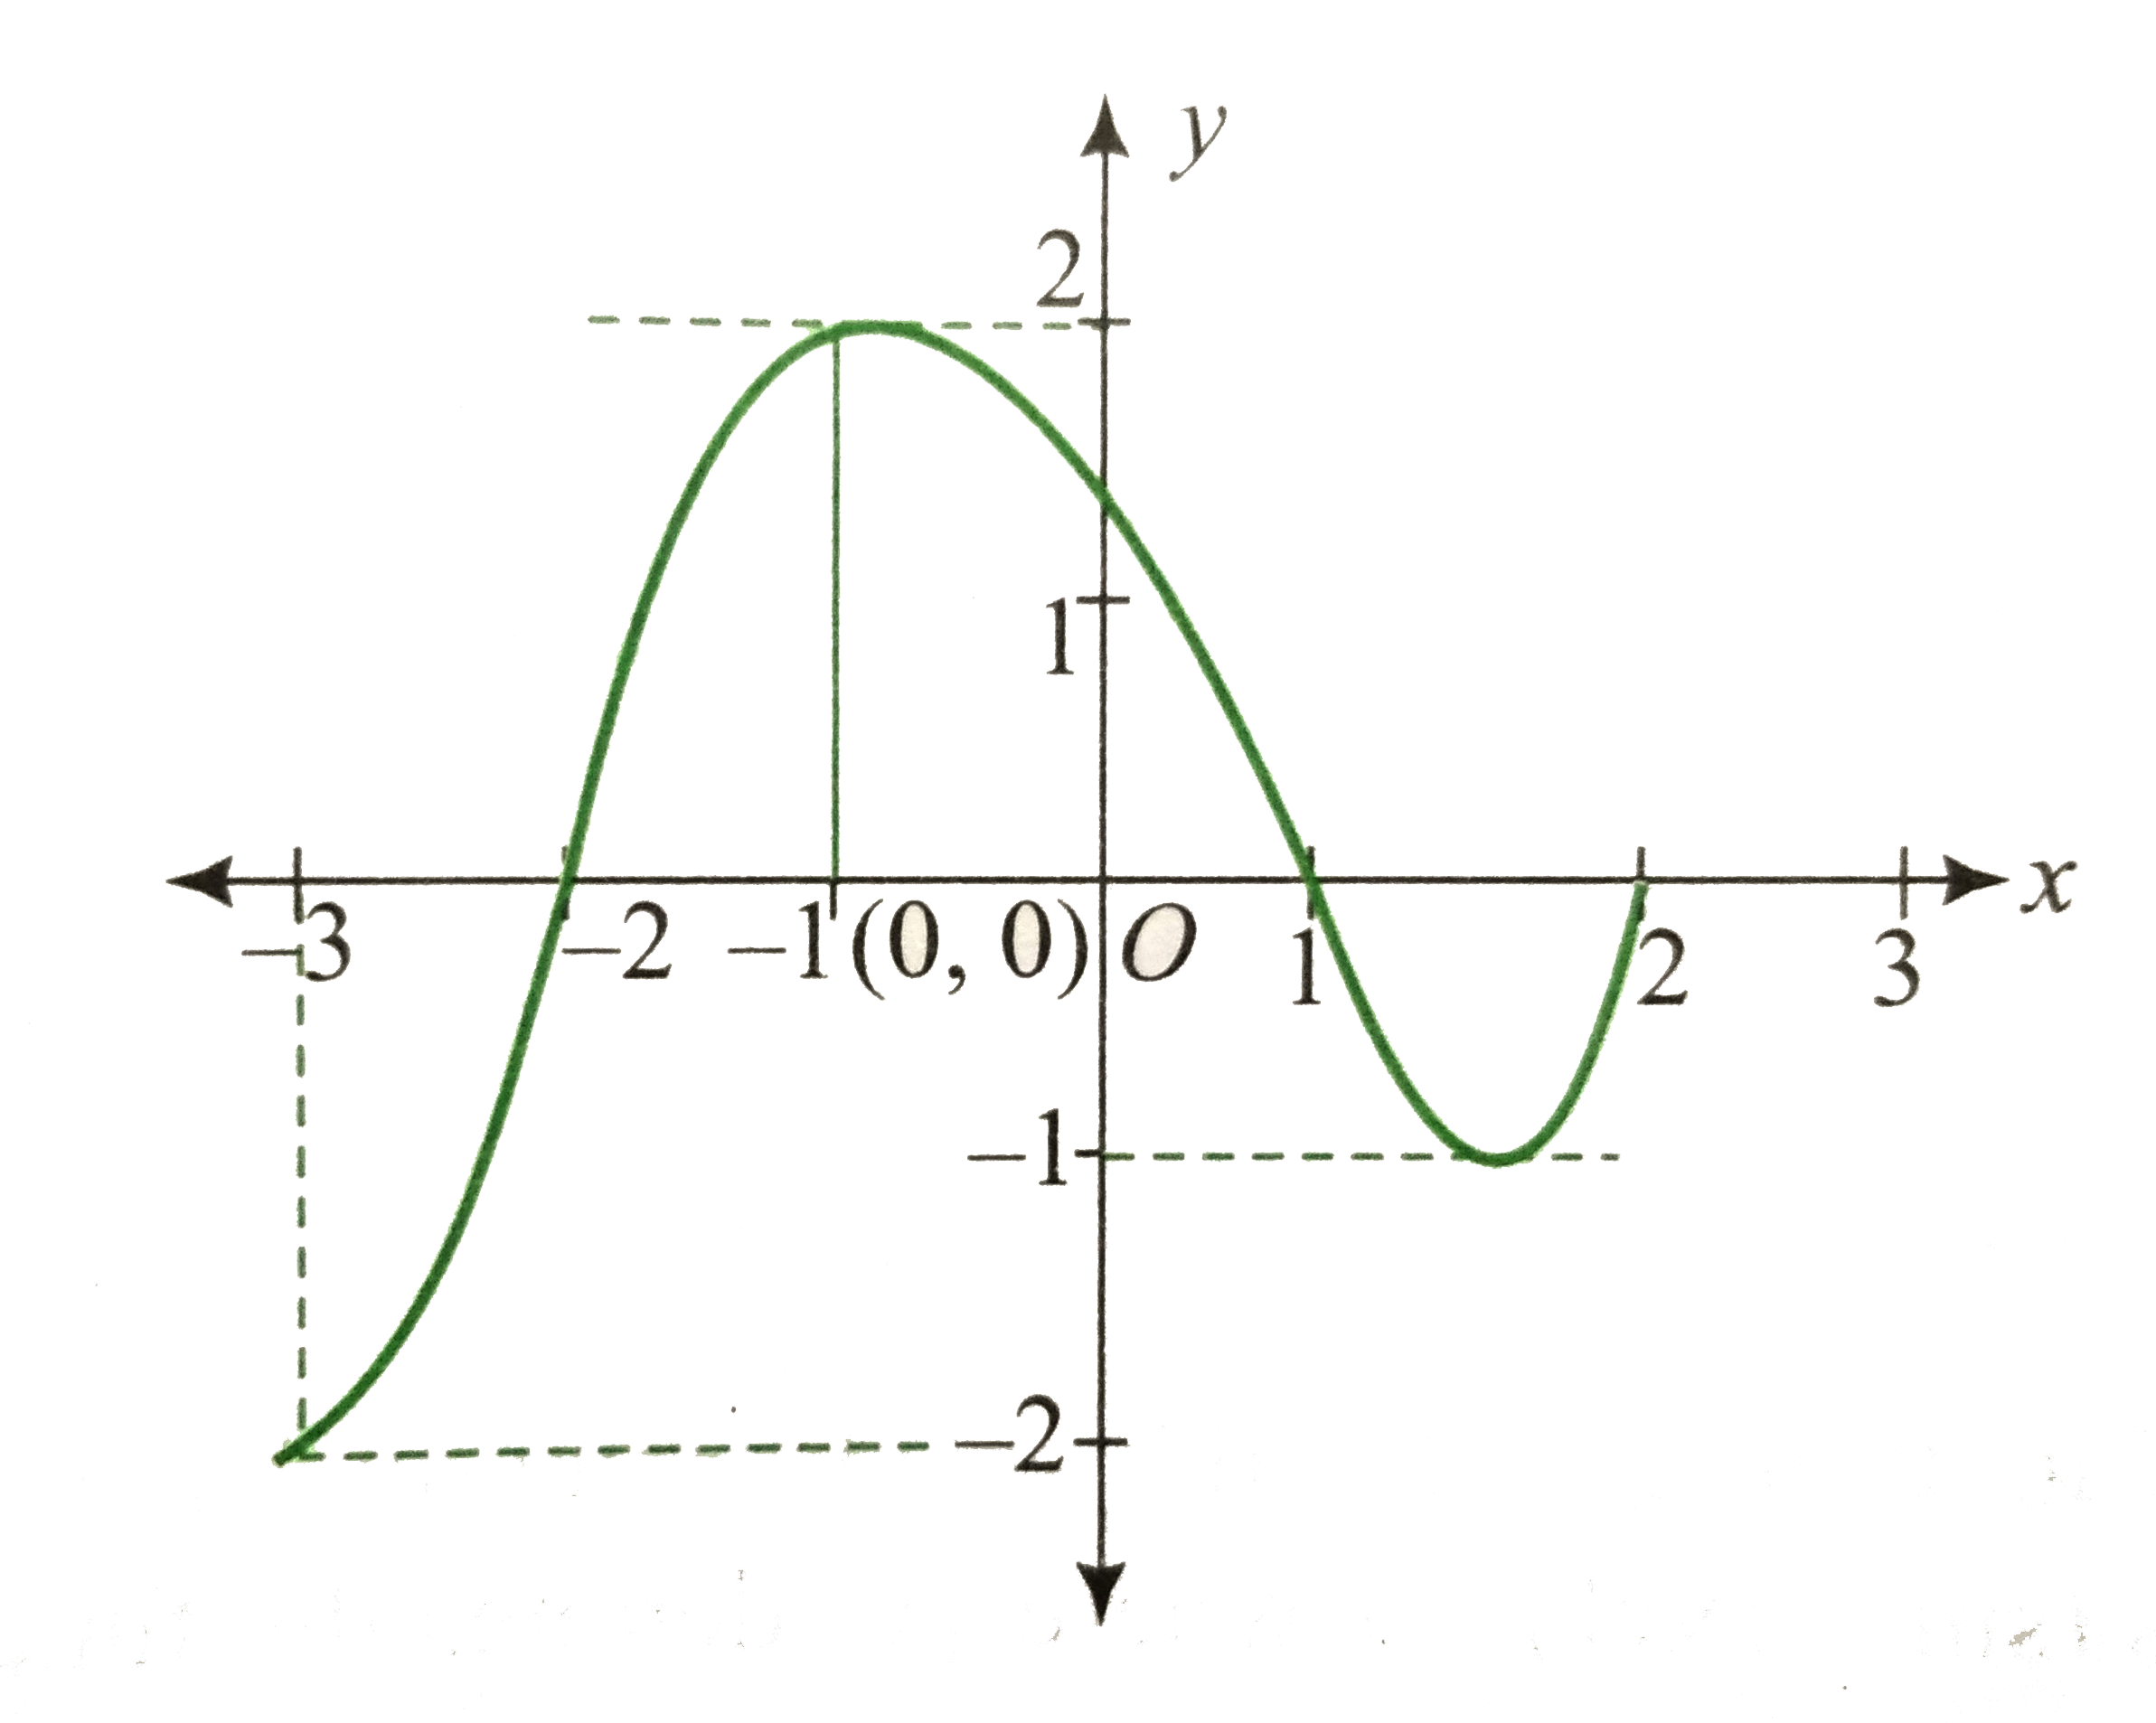
Identify the correct statement(s)?ARange of y=f(−|x|) is [−2,2]BDomain of y=f(|x|) is [−2,2]CDomain of y=f|x|+1) is [−1,1]DRange of y=f(|x|+1) is [−1,0]The graph of the function y=f(x) is symmetrical about the line x=2, then :
Af(x+2)=f(x−2)Bf(2+x)=f(2−x)Cf(x)=f(−x)Dnone of these
Draw the graph of the function f(x)=xx
View SolutionIf graph of a function f(x) is shown in the adjacent figure, then Limx→0−[4f(x)−6[f(x)]tan(2f(x)−6)] is equal to
View SolutionThe graph of a function fx) which is defined in [-1, 4] is shown in the adjacent figure. Identify the correct statement(s). (1) domain of f(|x|)−1)is[−5,5] (2) range of f(|x|+1) is [0,2] (3) range of f(−|x|) is [-1,0] (4) domain of f(|x|)is[−3,3]
View SolutionGraph of a function y=f(x) is shown in the adjacent figure.Four limits l1,l2,l3 and I4, are given as:
View SolutionThe graph of the function y=f(x) is shown.
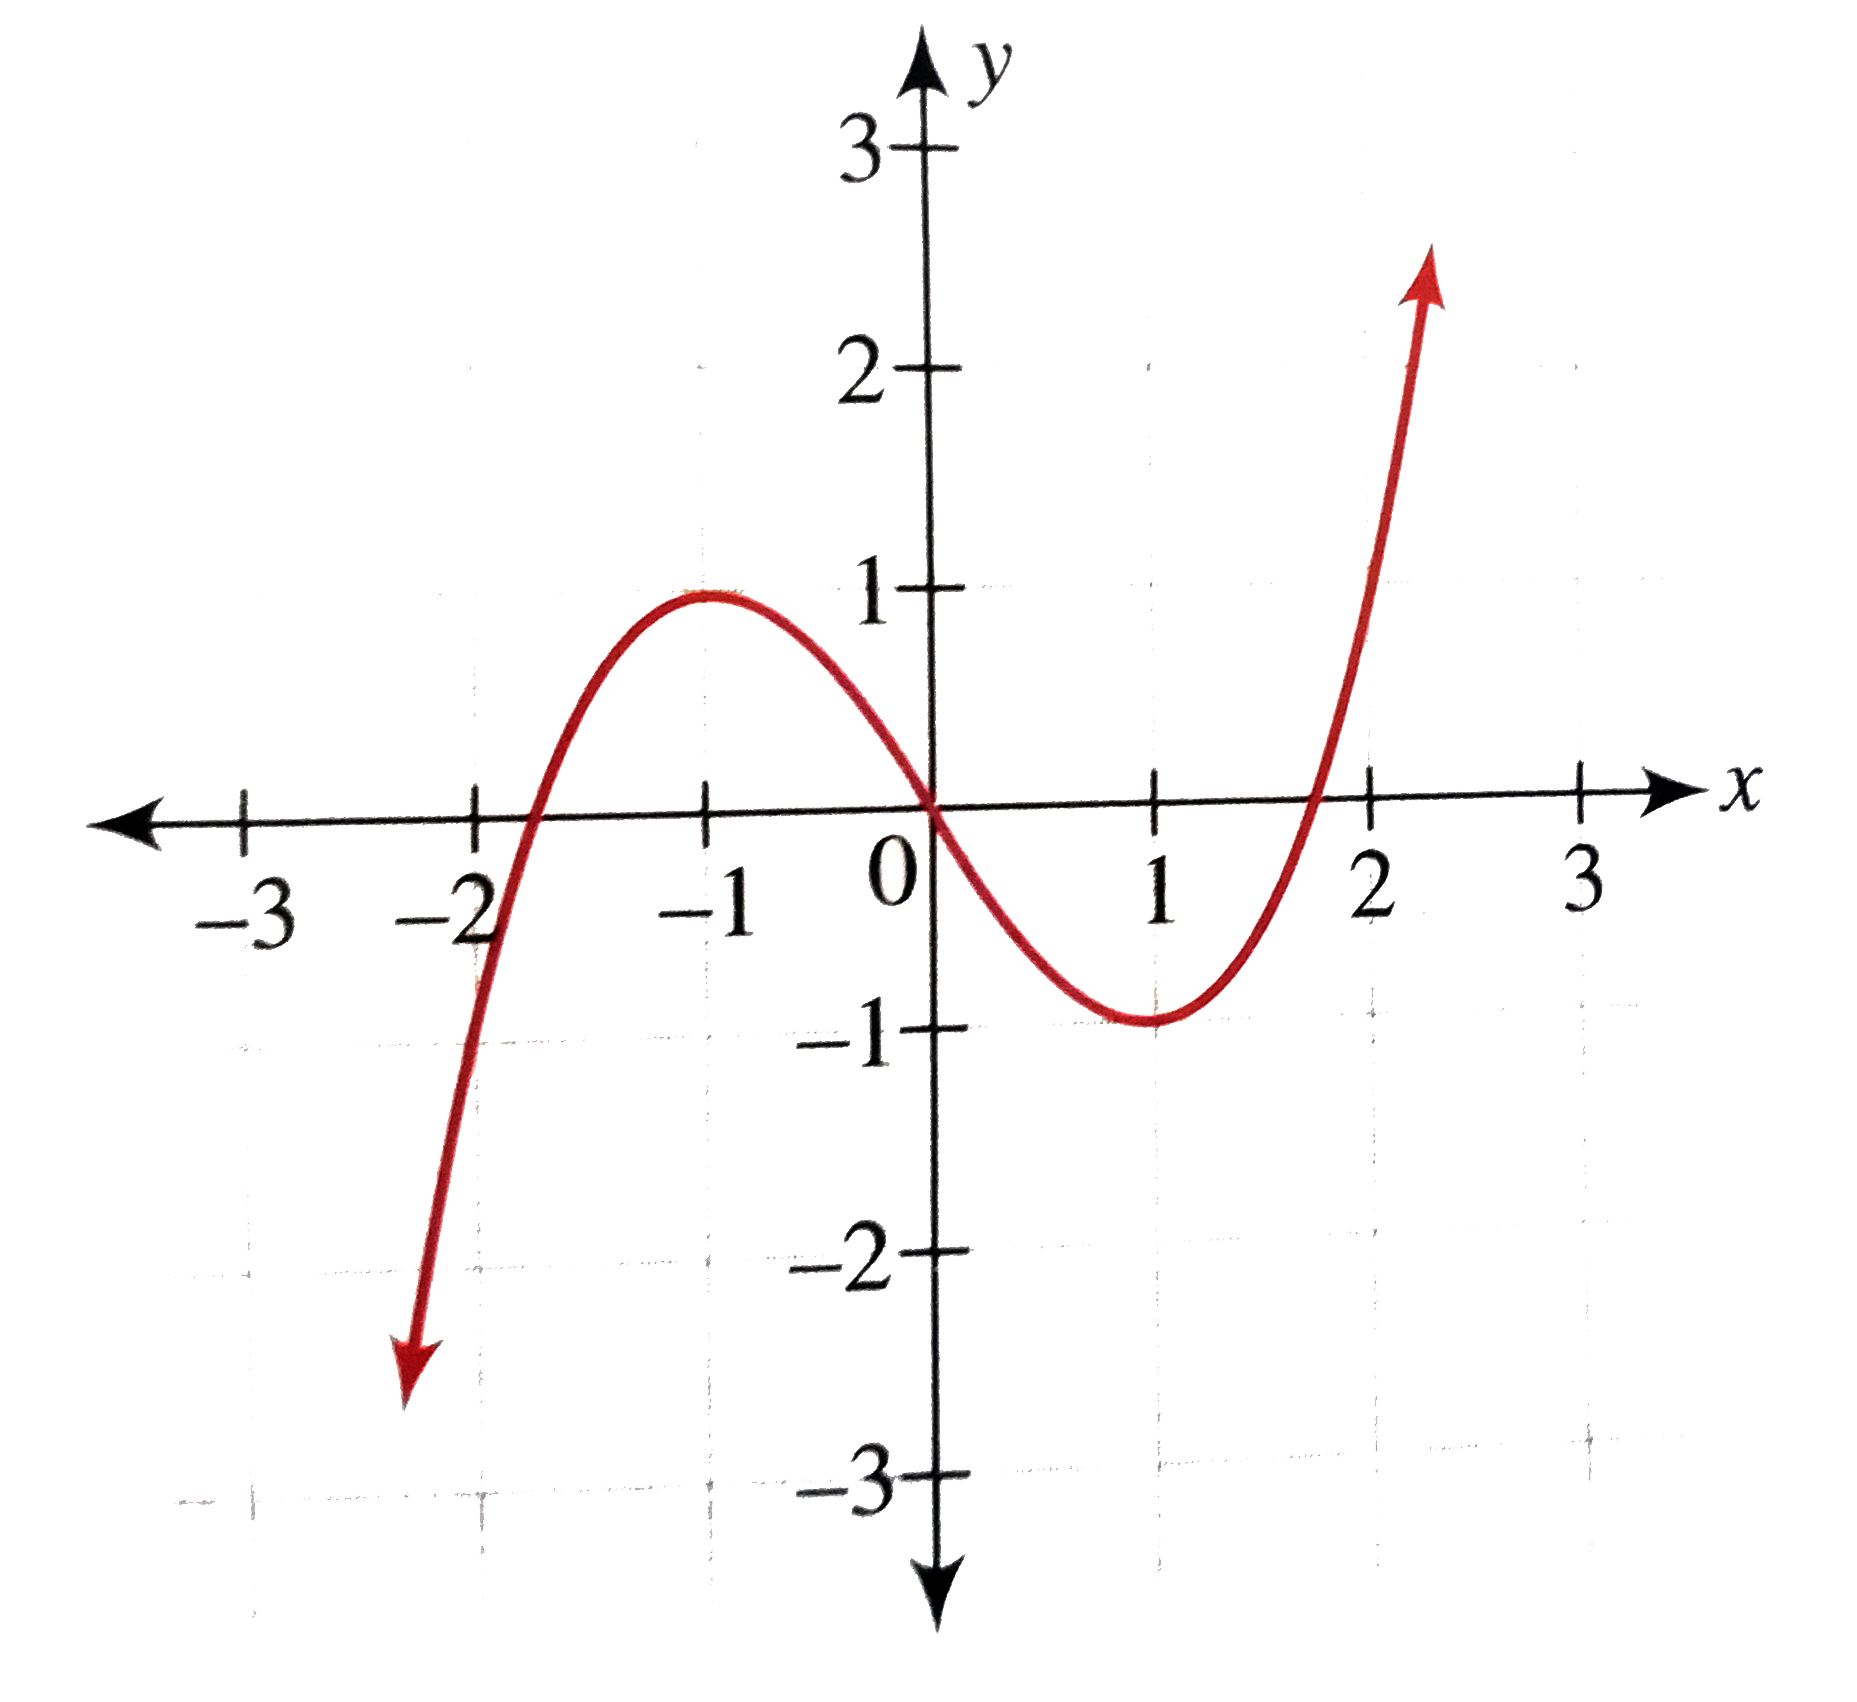
Find the number of solutions to the equation ||f(x)|−1|=12.
View Solution
