∣∣∣2008200920102011∣∣∣
Step by step video & image solution for |[2008,2009],[2010,2011]| by Maths experts to help you in doubts & scoring excellent marks in Class 12 exams.
Updated on:21/07/2023Similar Questions
Knowledge Check
The population of a village in Madurai is increasing year after year. Find out the population (in lakhs) in 2013 from the following information:
Year 2008 2009 2010 2011 2012 2013
Population 4 7 13 22 34 ?A49B46C45D43Expenses (in multiples of ₹10,000/-) on consumption of fuel for the official car at a regional office (RO) of a national organization during 2006-2010 is given below in a tabular form along with the National Average (NA) during the said period. It is given that there are five ROs.
Year20062007200820092010RO2022232425NA1817191823
In which year is the difference in expense on fuel between the given RO and the NA is the maximum?
(a)2008
(b)2009
(c)2007
(d)2010A2008B2009C2007D2010STATEMENT-1: The line 2009x+2010y+2011=0 where 2009a+2011c=0 passes through the point (ab,bc), where abc≠0.
STATEMENT-2: If 2009a+2010+2011c=0, then the straight line ax+by+c=0,abc≠0 passes through (20092011,20102011).AStatement-1 is True, Statemetn-2 is True, Statemetn-2 is a correct explanation for Statement-5BStatement-1 is True, Statemetn-2 is True, Statement-2 is NOT a correct explanation for Statement-5CStatement-1 is True, Statement-2 is FalseDStatement-1 is False, Statement-2 is True
The variance of the data 2001,2003,2006,2007,2009,2010 is
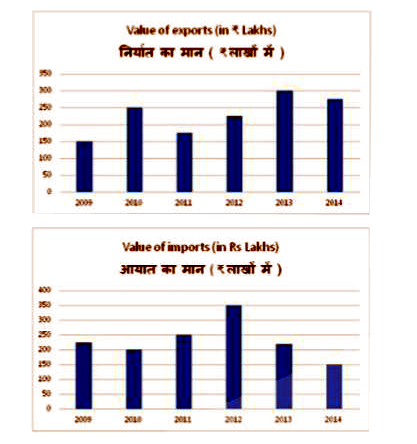
View SolutionFollowing is a data regarding export and import of a company over the years. Answer the question given below.

The value of imports in year 2011 was what percentage (approximate) of the average value of exports in the years 2009, 2010 and 2011?
View SolutionSTATEMENT-1: The line 2009x+2010y+2011=0 where 2009a+2011c=0 passes through the point (ab,bc), where abc≠0.
STATEMENT-2: If 2009a+2010+2011c=0, then the straight line ax+by+c=0,abc≠0 passes through (20092011,20102011).
View SolutionP=20082007−2008,Q=20082+2009. The remainder when P is divided by Q is:
View SolutionP=20082007−2008,Q=20082+2009. The remainder when P is divided by Q is:
View Solution
