The variance of the data 2001,2003,2006,2007,2009,2010 is
Step by step video & image solution for The variance of the data 2001,2003,2006,2007,2009,2010 is by Maths experts to help you in doubts & scoring excellent marks in Class 12 exams.
Similar Questions
Knowledge Check
- Question 1 - Select One
If the variance of the data 2, 4, 5, 6, 17 is v, then what is the variance of the data 4, 8, 10, 12, 34?
AvB4vCv2D2v - Question 2 - Select One
In the following table, pass percentage of three schools from the year 2001 to the year 2006 are given. Which school students' performance is more consistent?
200120022003200420052006School X808979838465School Y929476758063School Z939767637085AXBYCZDX and Y - Question 3 - Select One
What is the mean ofthe given data? 2, 3, 4, 5, 6, 7, 8, 9
AvB4vCv2D2v
Expenses (in multiples of ₹10,000/-) on consumption of fuel for the official car at a regional office (RO) of a national organization during 2006-2010 is given below in a tabular form along with the National Average (NA) during the said period. It is given that there are five ROs.
Year20062007200820092010RO2022232425NA1817191823
In which year is the difference in expense on fuel between the given RO and the NA is the maximum?
(a)2008
(b)2009
(c)2007
(d)2010View SolutionExpenses (in multiples of ₹10,000/-) on consumption of fuel for the official car at a regional office (RO) of a national organization during 2006-2010 is given below in a tabular form along with the National Average (NA) during the said period. It is given that there are five ROs.
Year20062007200820092010RO2022232425NA1817191823
If the RO, given in the table, is not taken into account, then what would be the NA (in multiple of ₹10,000/-) in 2006?View SolutionStudy the bar graph and answer the question that follows.

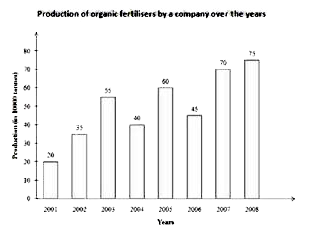
The ratio of the total production of organic fertilizers by the company in the years 2005. 2006 and 2008 to the total production in the years 2001, 2002, 2003 and 2004. is:View SolutionExpenses (in multiples of ₹10,000/-) on consumption of fuel for the official car at a regional office (RO) of a national organization during 2006-2010 is given below in a tabular form along with the National Average (NA) during the said period. It is given that there are five ROs.
Year20062007200820092010RO2022232425NA1817191823
If the data of the RO is represented through a pie chart, Then what would be the central angle (nearest to degree) of the sector corresponding to the year 2008?
(a)68∘
(b)70∘
(c)76∘
(d)73∘View SolutionThe population of a developing country is increasing year by year. Find out the current year population, from the following information:
Year 2004 2005 2006 2007 2008 2009
Pop. in lakhs 30 60 120 210 330 ?View Solution

