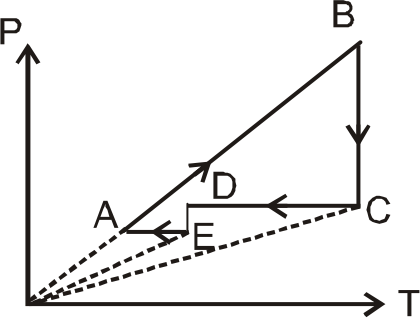
On a pT diagram, a cyclic process is performed as shown. Where is the volume maximum?
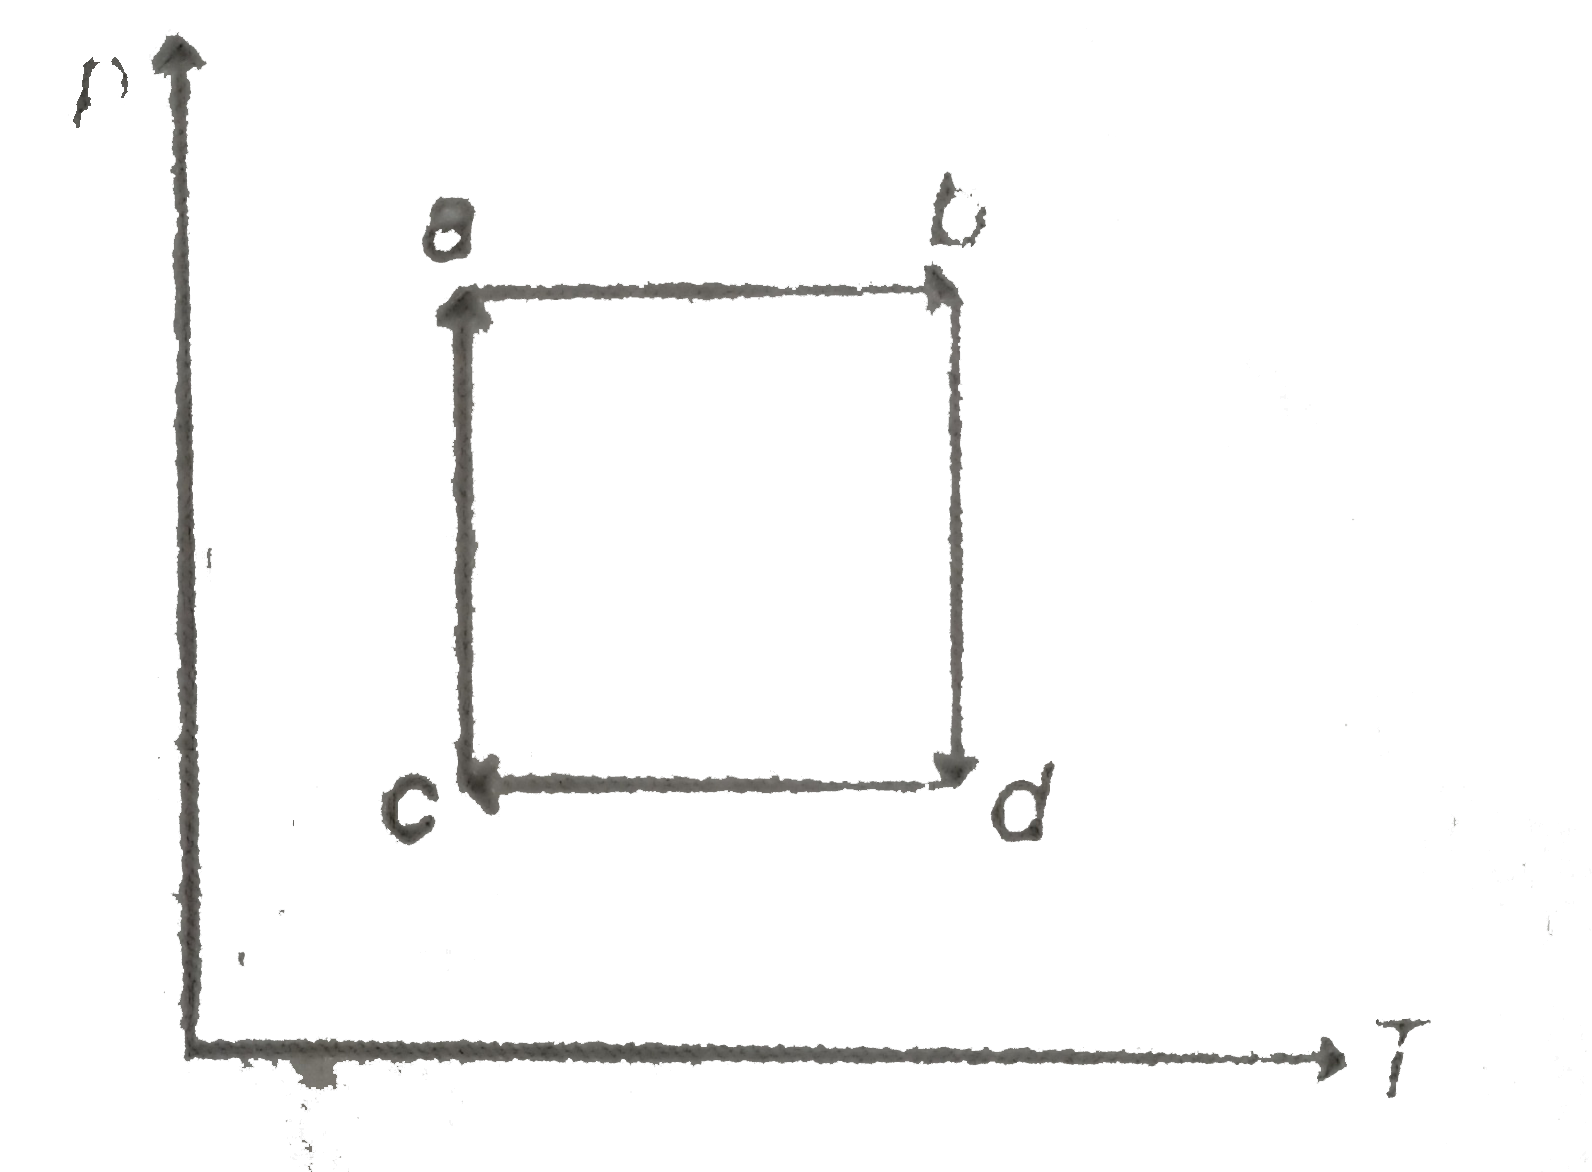
A
a
B
b
C
c
D
d
Video Solution
Text Solution
The correct Answer is:D
|
Answer
Step by step video, text & image solution for On a pT diagram, a cyclic process is performed as shown. Where is the volume maximum? by Physics experts to help you in doubts & scoring excellent marks in Class 11 exams.
Updated on:21/07/2023Topper's Solved these Questions
Similar Questions
Knowledge Check
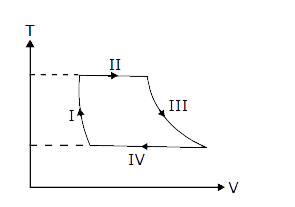
One mole of a monatomic ideal gas undergoes a cyclic process as shown in the figure (where V is the volume and T is the temperature). Which of the statements below is (are) true?
 AProcess I is an isochoric processBIn process II, gas absorbs heatCIn process IV, gas releases heatDProcesses I and III are not isobaric
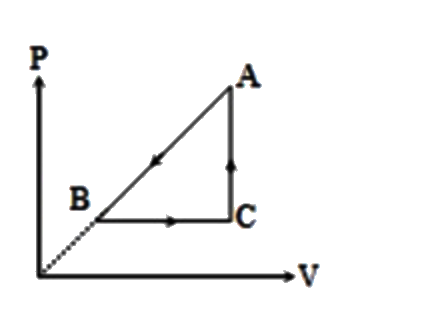
. p-V diagram of a cyclic process ABCA is as shown in figure. Choose the correct statement
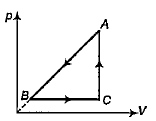 A△QA→B=constantB△UB→C=positiveC△UCAB=negativeDAll of the above
P−V diagram of a cyclic process ABCA is as shown in Fig. Choose the correct alternative
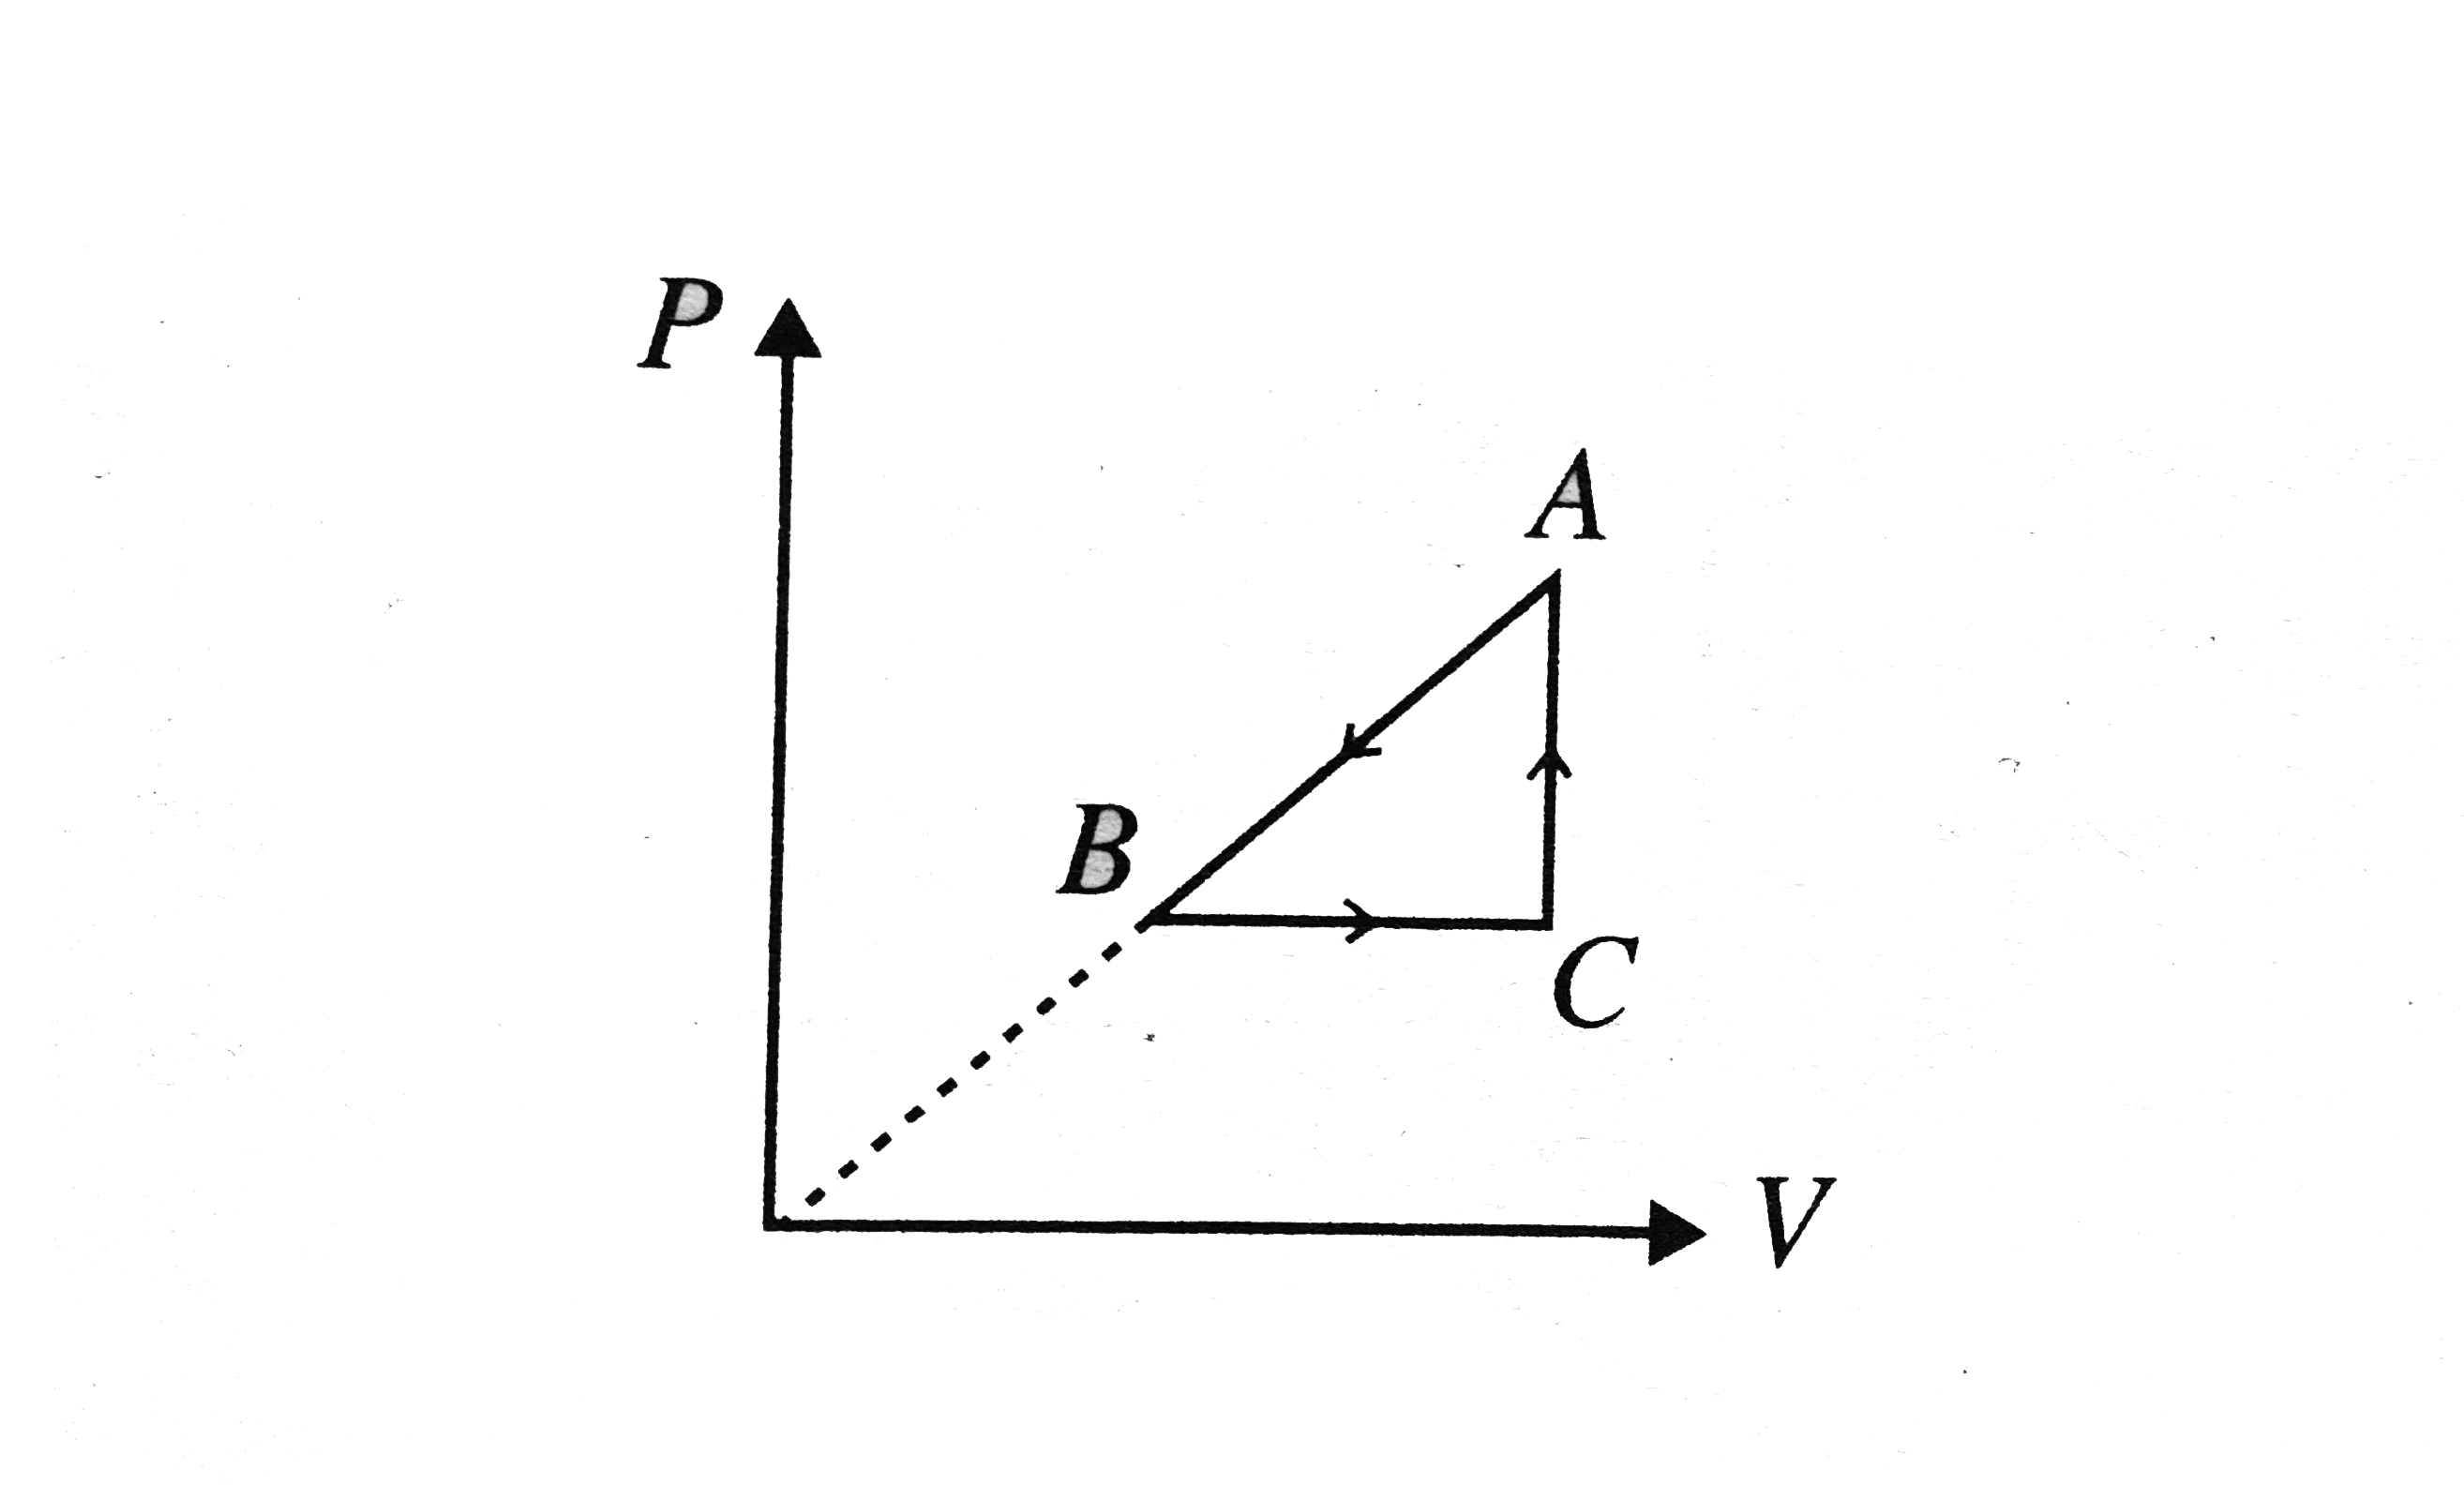 AΔQA→.B is negativeBΔUb→.c is negativeCΔUc→.A is negativeDΔWCAB is negative
for the given cyclic process CAB as shown for a gas , the work done is :
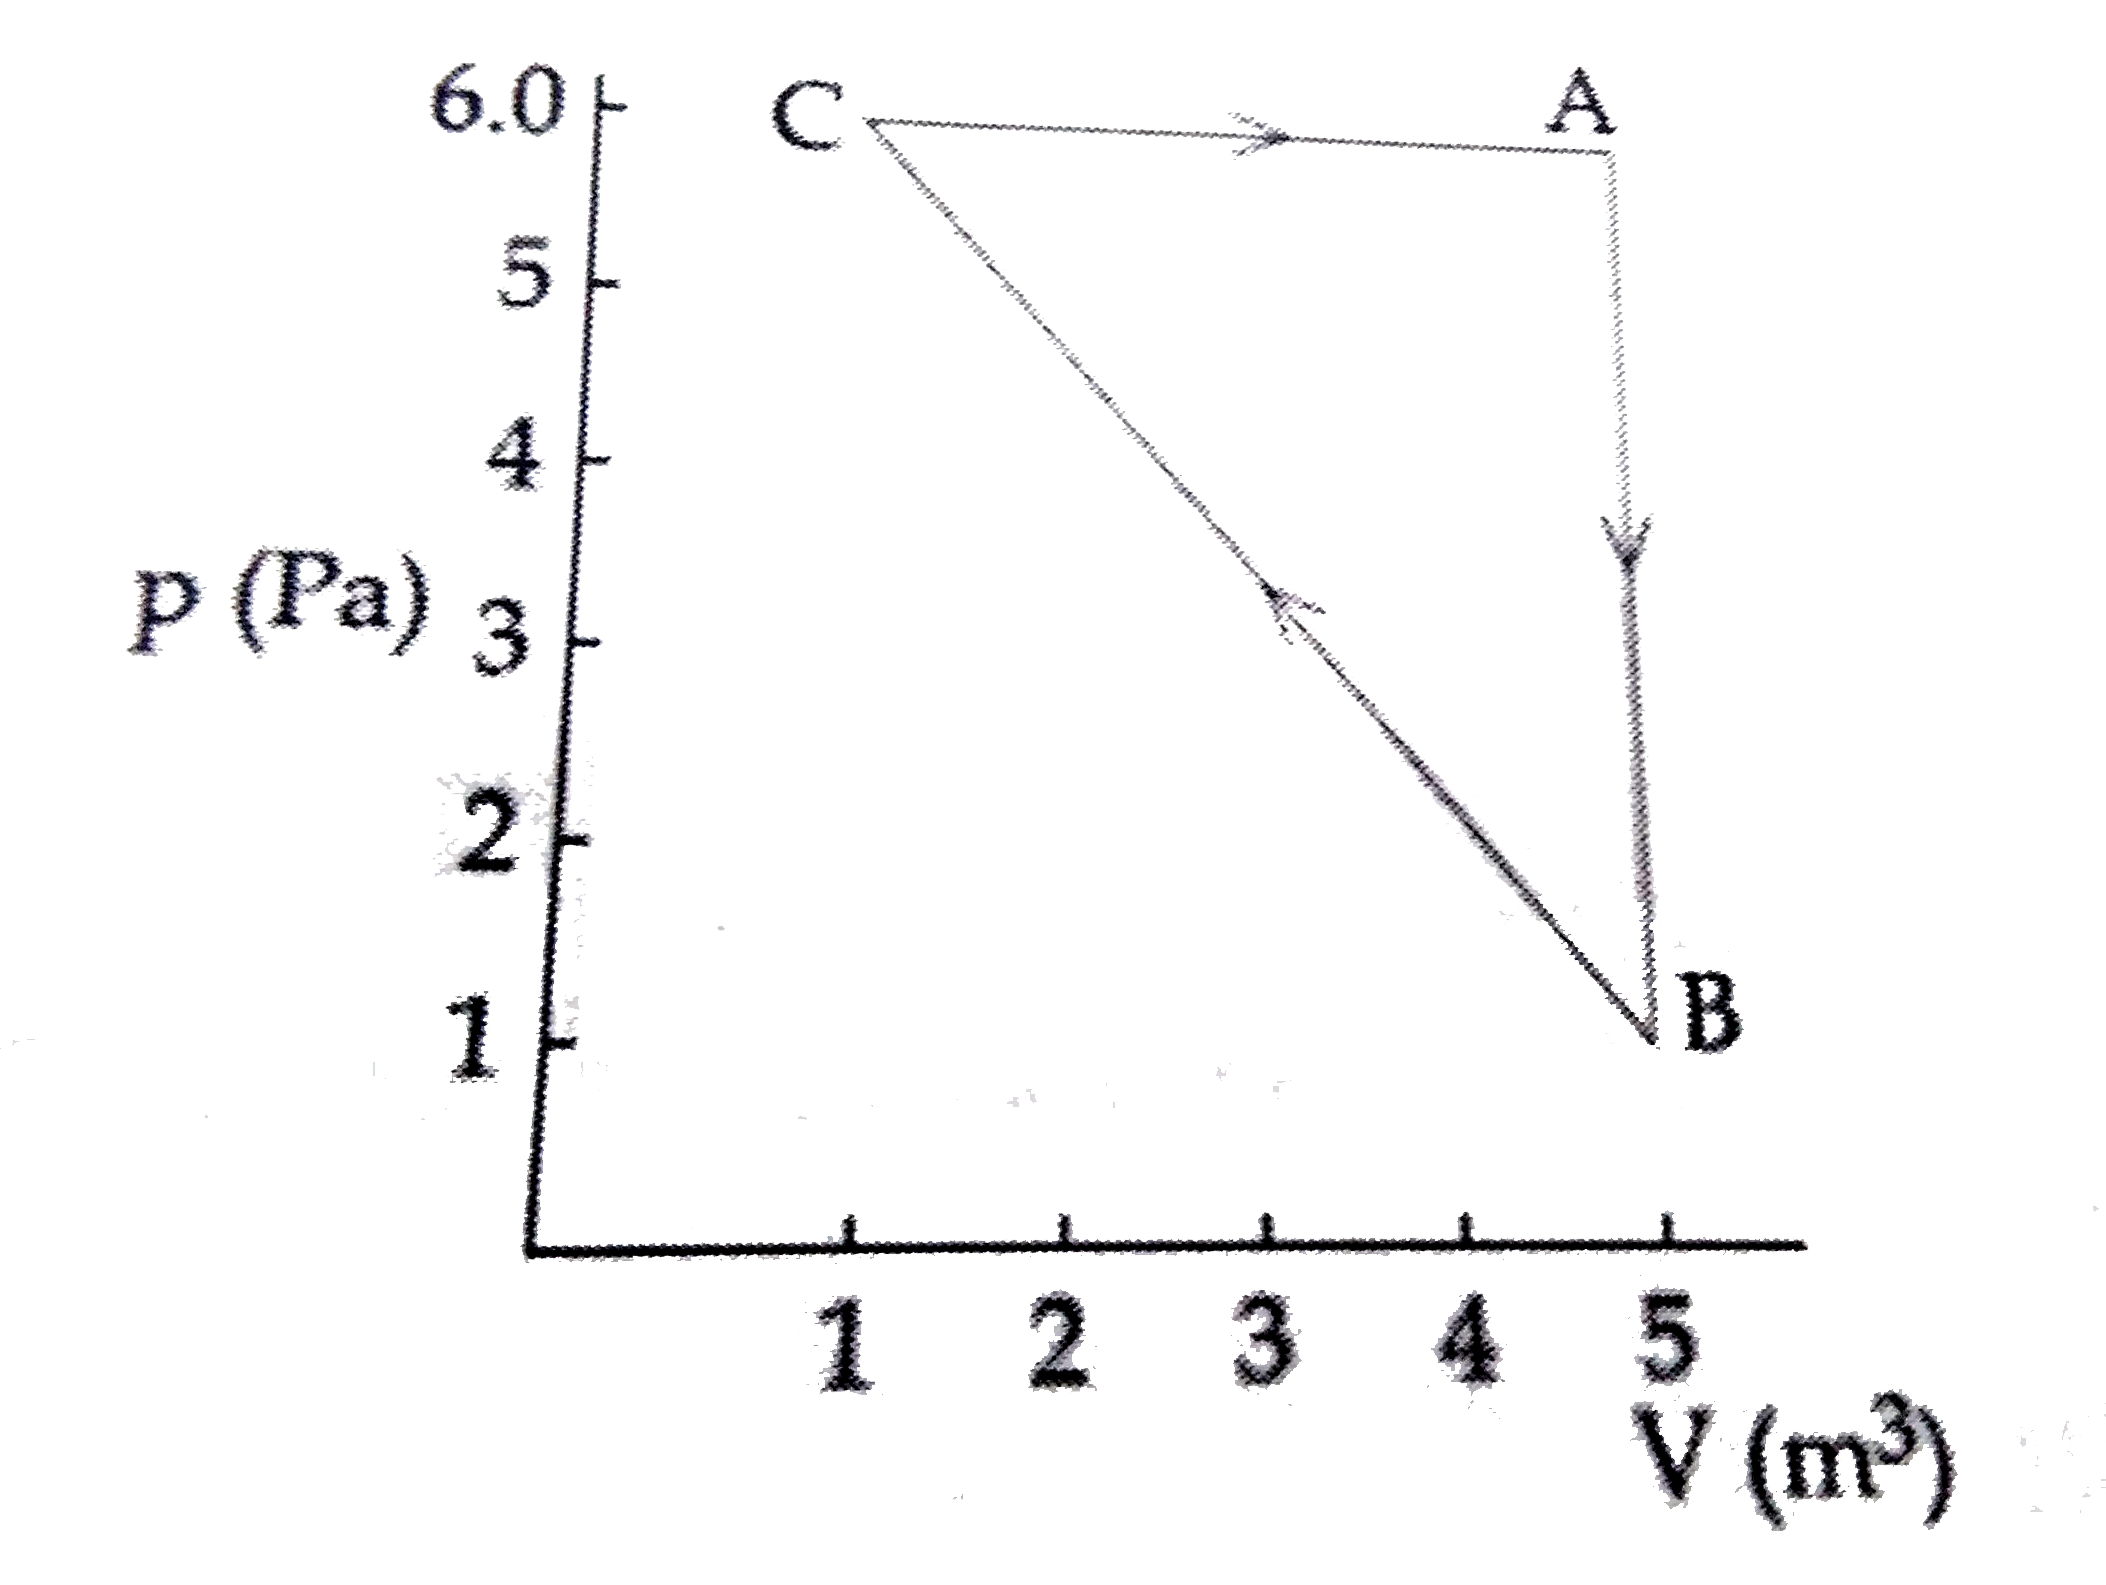
View Solution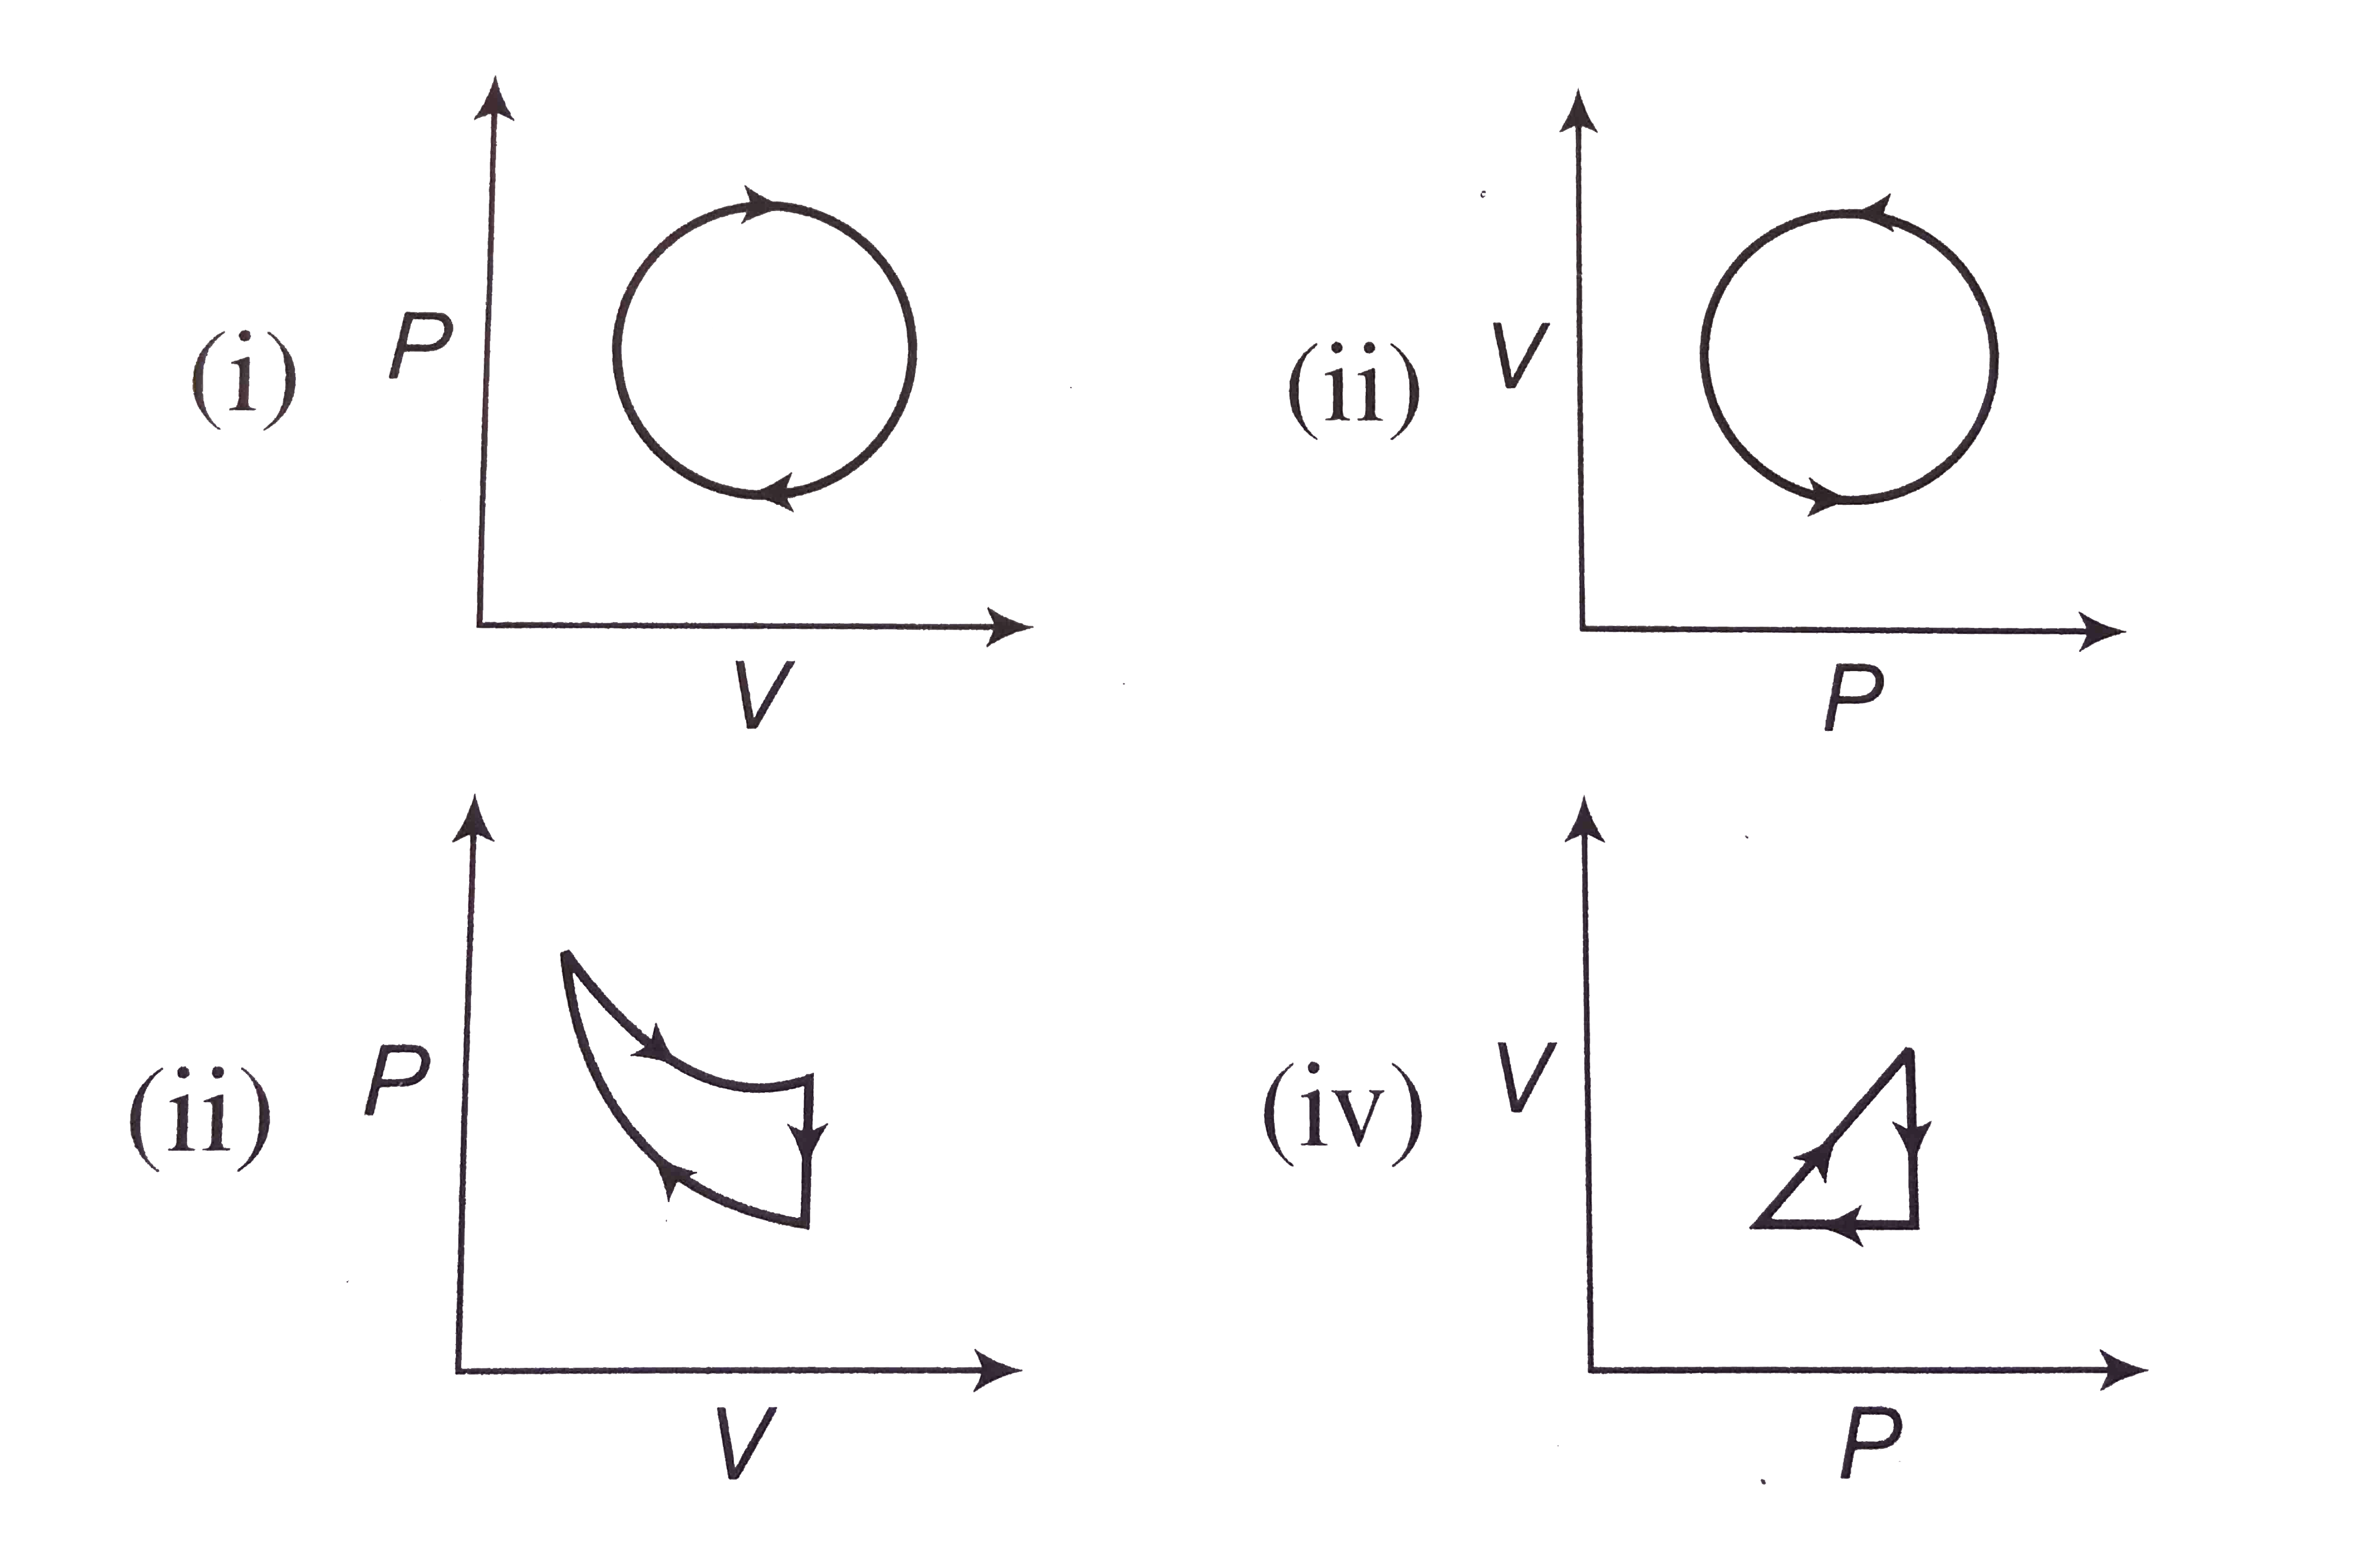
The following are the P−V diagrams for cyclic processes for a gas. In which of these processes is heat absorbed by the gas?
View SolutionA reversible cyclic process is represented as shown. The efficiency of the process is :
View SolutionThe following are the P−V diagram for cyclic process for a gas. In which of these processes, heat is not obsorbed by the gas?
View Solutionp−T curve for a cyclic process is as shown
P−V graph for this process will be:
View Solution

