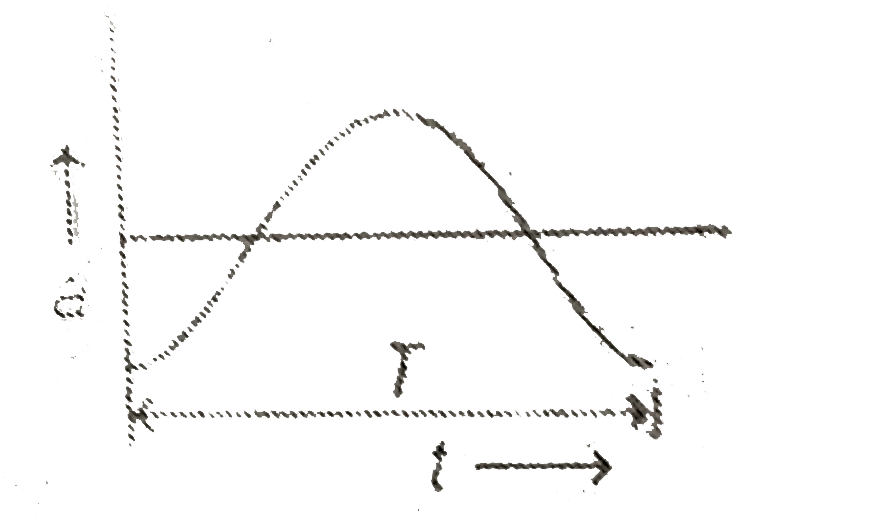
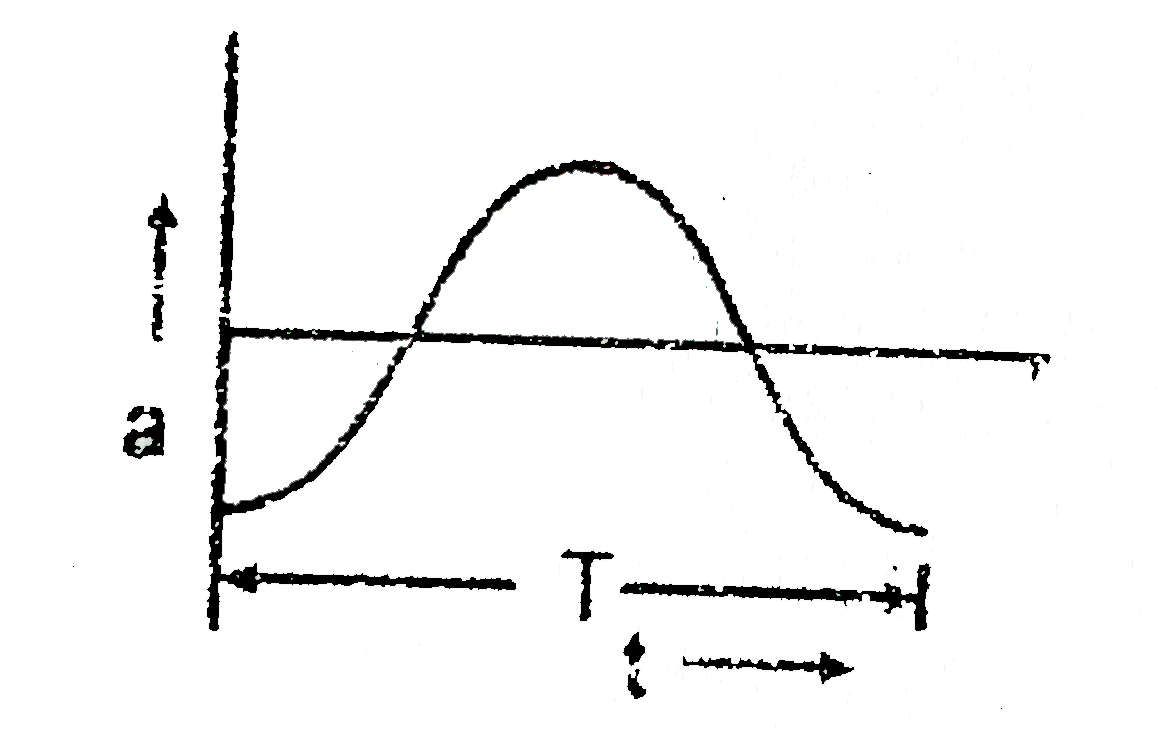
Acceleration versus time graph of a body in SHM is given by a curve shown below. T is the time period. Then corresponding graph between kinetic energy KE and time t is correctly represented by
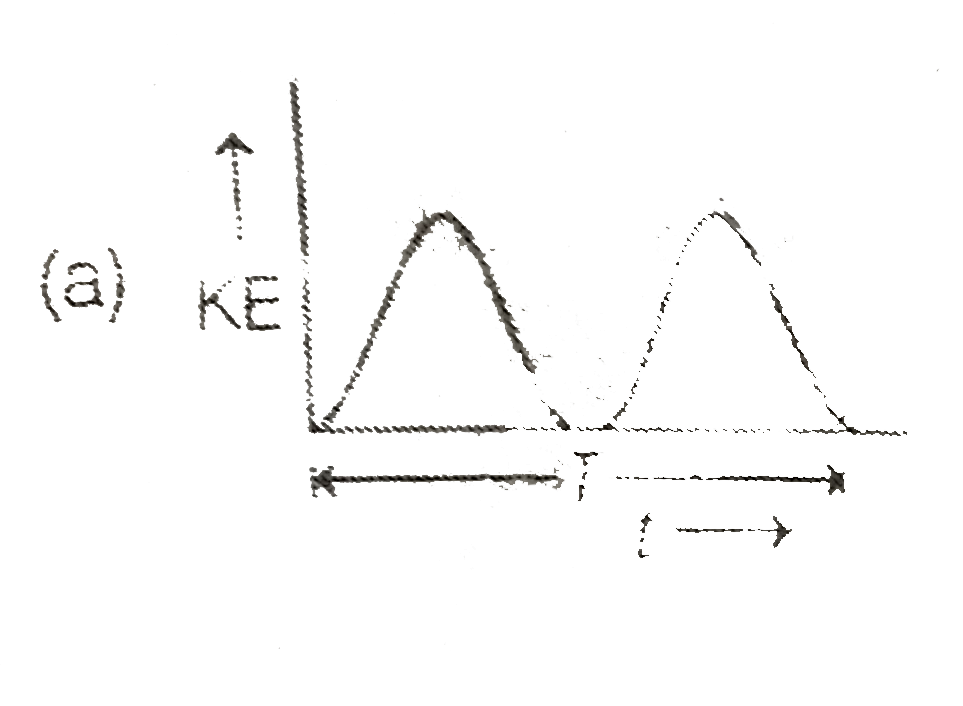
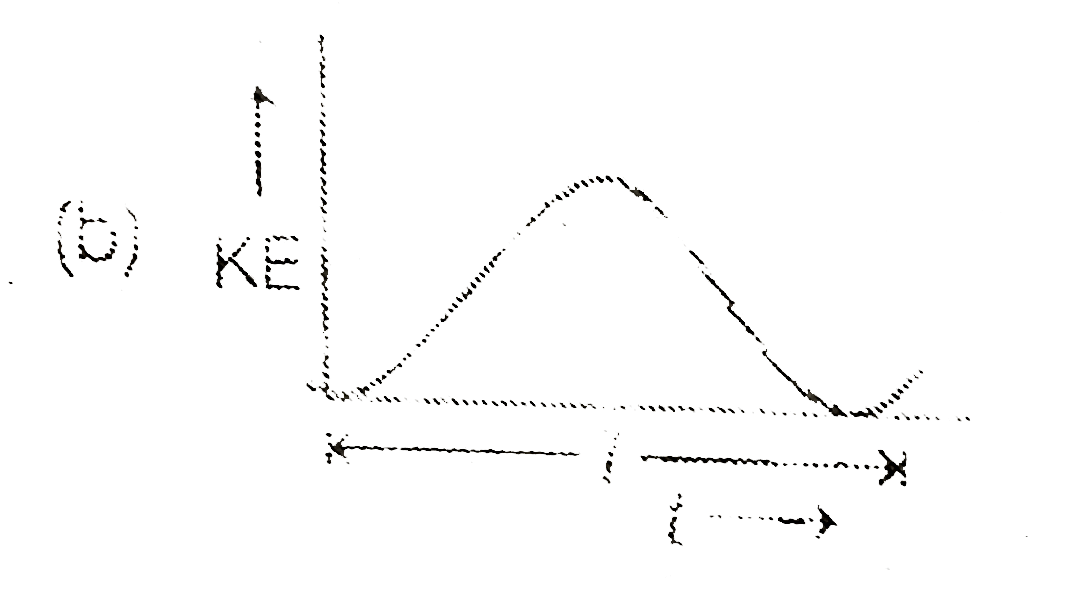
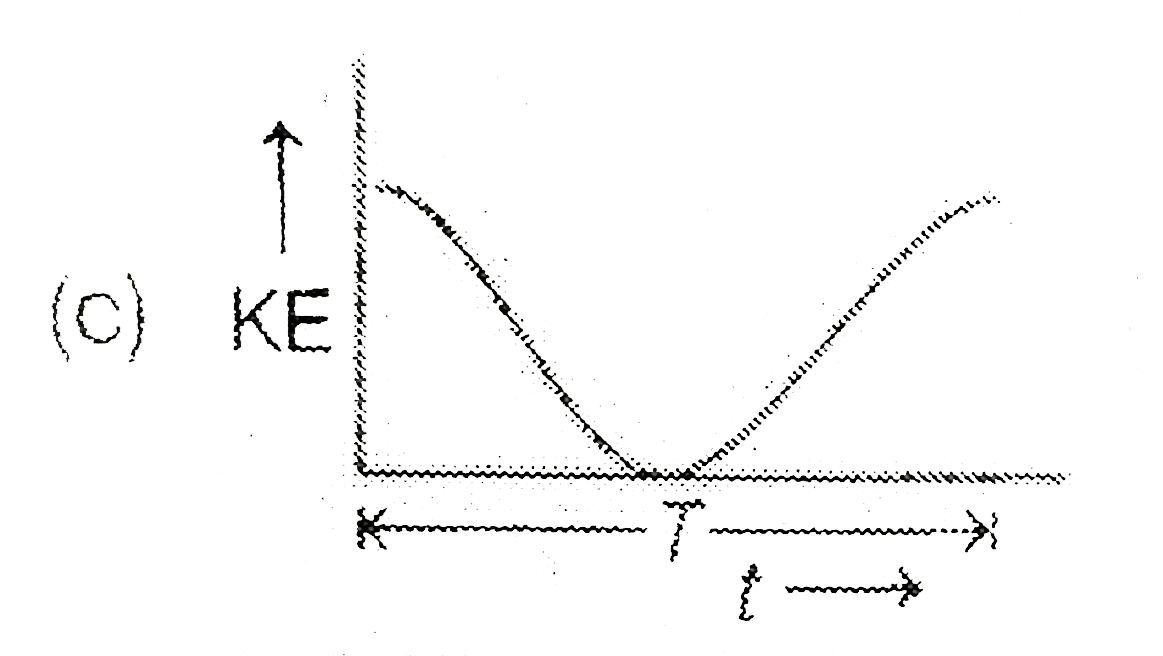
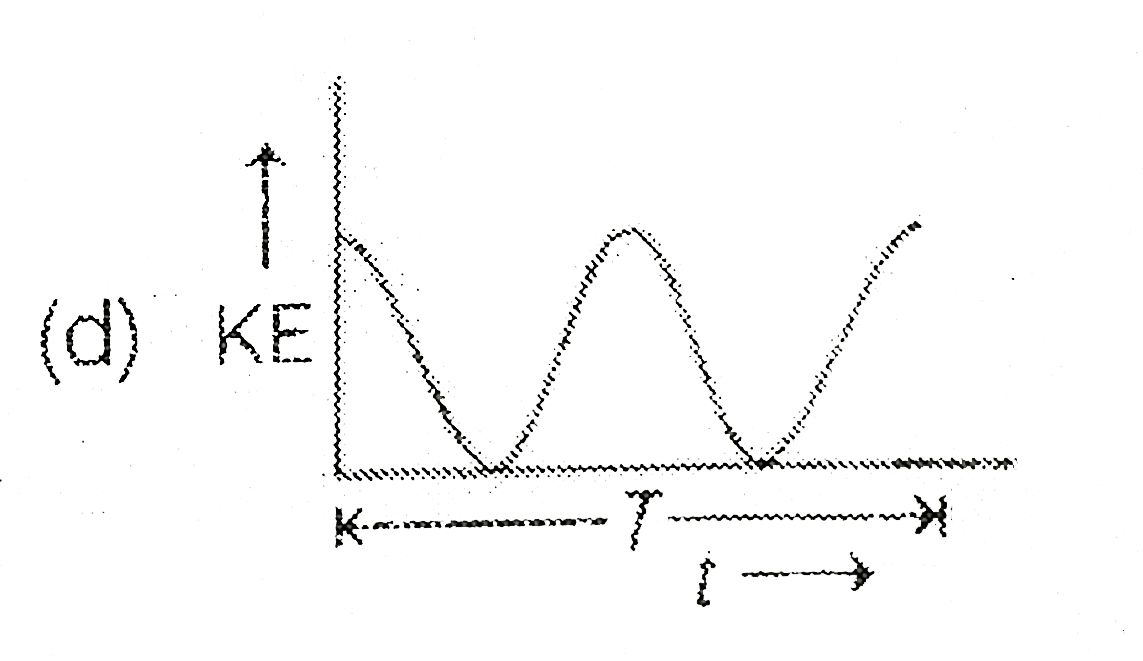
The correct Answer is:a
Step by step video, text & image solution for Acceleration versus time graph of a body in SHM is given by a curve shown below. T is the time period. Then corresponding graph between kinetic energy KE and time t is correctly represented by by Physics experts to help you in doubts & scoring excellent marks in Class 11 exams.
Topper's Solved these Questions
- BOOK - DC PANDEYCHAPTER - SIMPLE HARMONIC MOTIONEXERCISE - JEE Advanced34videos
SIMPLE HARMONIC MOTION
- BOOK - DC PANDEYCHAPTER - SIMPLE HARMONIC MOTIONEXERCISE - More than one option is correct50videos
SIMPLE HARMONIC MOTION
- BOOK - DC PANDEYCHAPTER - SIMPLE HARMONIC MOTIONEXERCISE - Exercise 14.44videos
SIMPLE HARMONIC MOTION
- BOOK - DC PANDEYCHAPTER - SEMICONDUCTORS AND ELECTRONIC DEVICESEXERCISE - More than One Option is Correct3videos
SEMICONDUCTORS AND ELECTRONIC DEVICES
- BOOK - DC PANDEYCHAPTER - SOLVD PAPERS 2017 NEET, AIIMS & JIPMEREXERCISE - Solved paper 2018(JIPMER)38videos
SOLVD PAPERS 2017 NEET, AIIMS & JIPMER
Similar Questions
Knowledge Check
- Question 1 - Select One
Acceleration a versus time t graph of a body in SHM is given by a curve shown below. T is the time period Then corresponding graph between kinetic energy KE and time t is correctly represented by
 A
A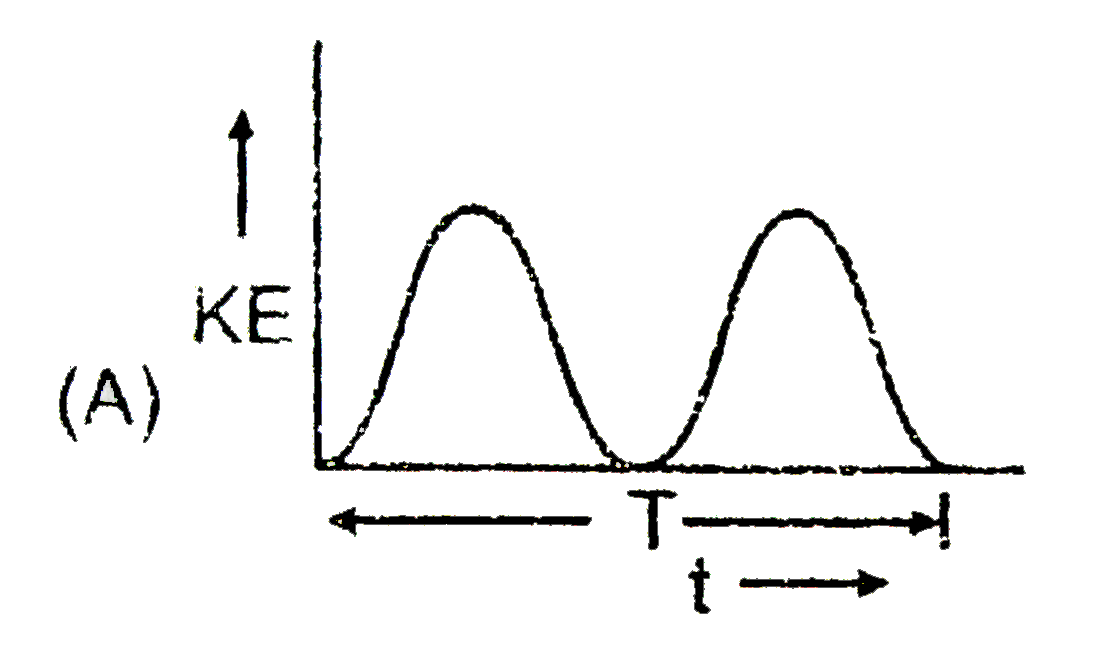 B
B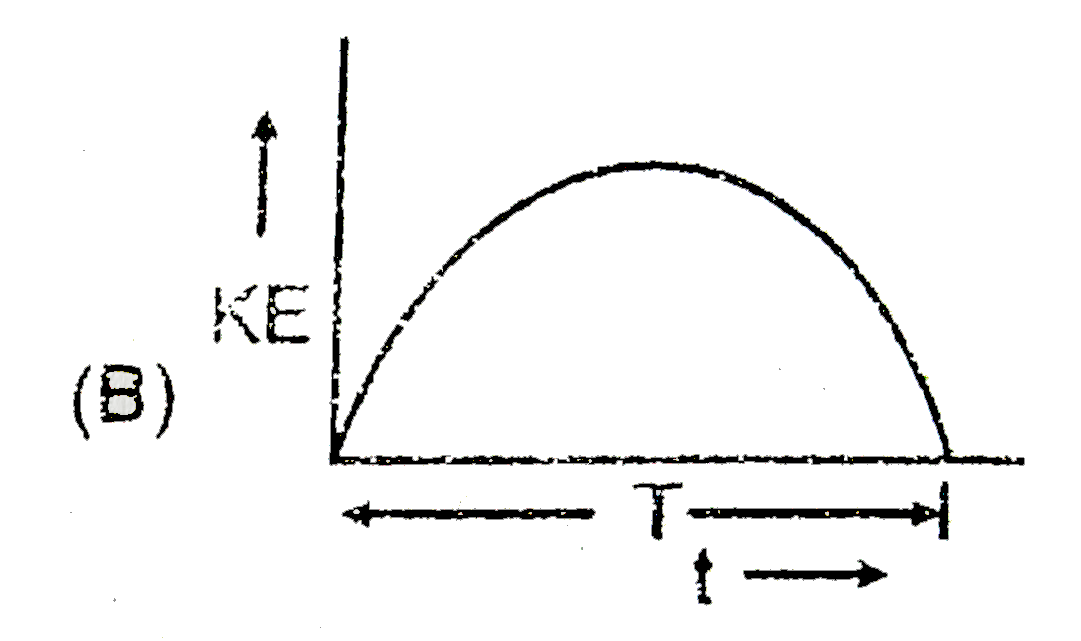 C
C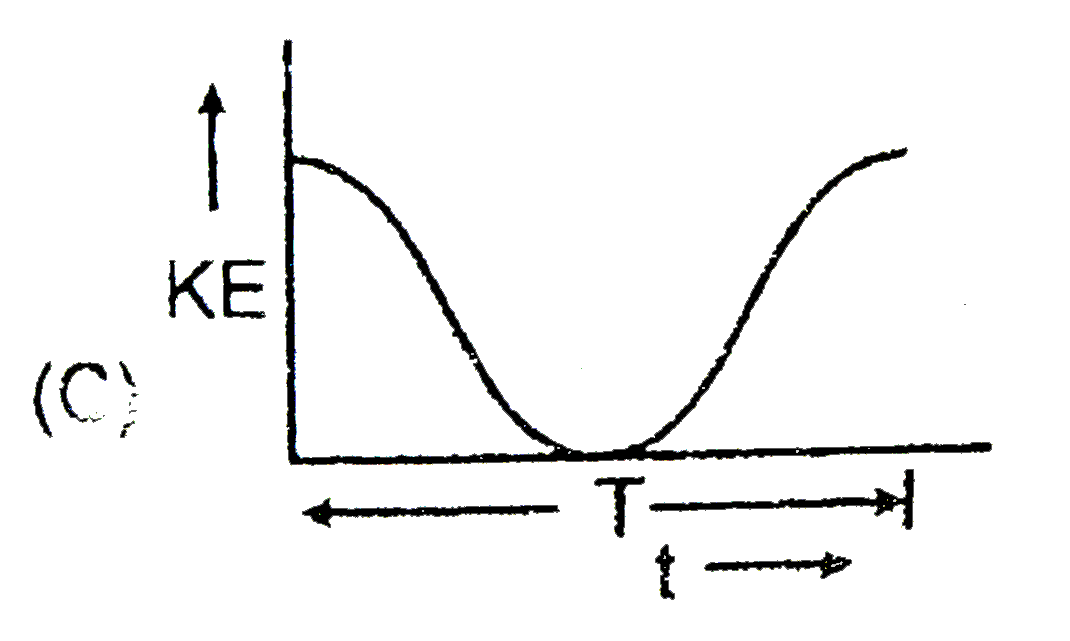 D
D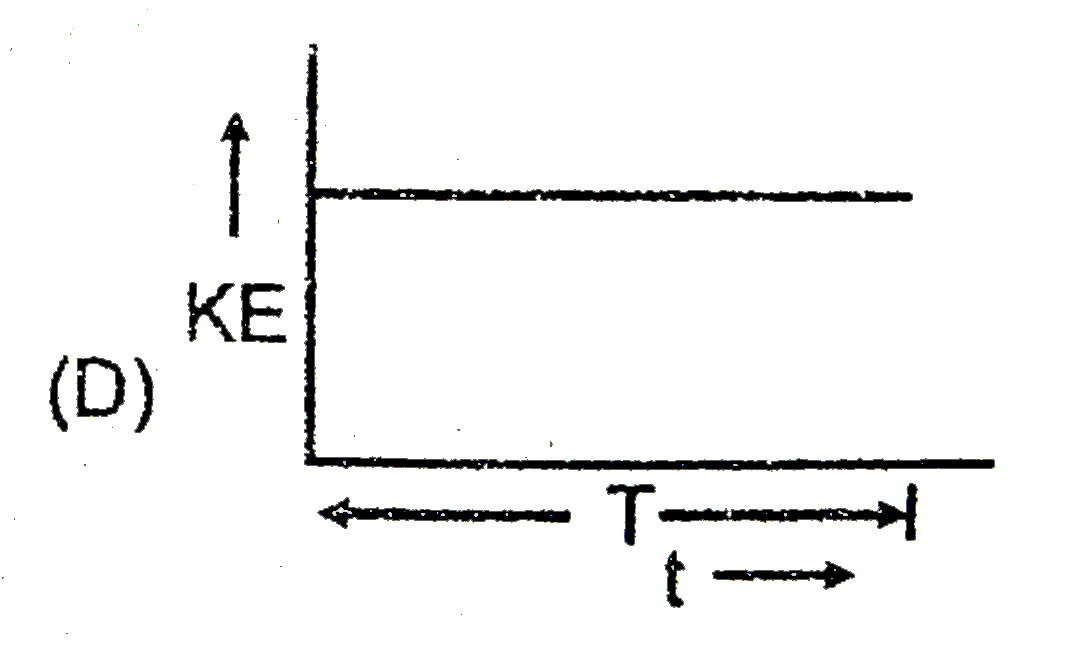
- Question 2 - Select One
Acceleration A and time period T of a body in S.H.M. is given by a curve shown below. Then corresponding graph, between kinetic energy (K.E.) and time t is correctly represented by
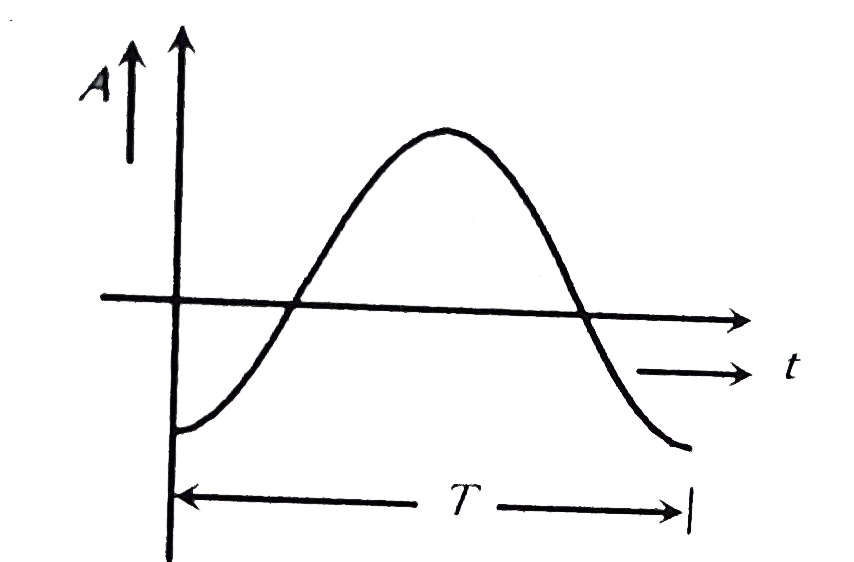 A
A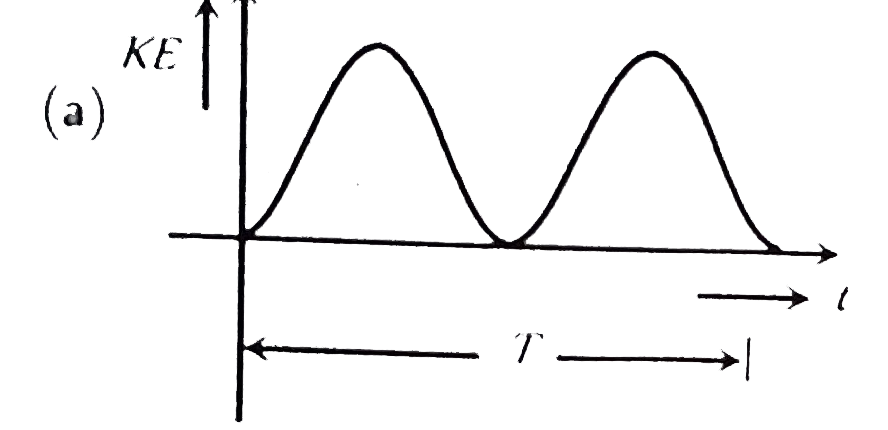 B
B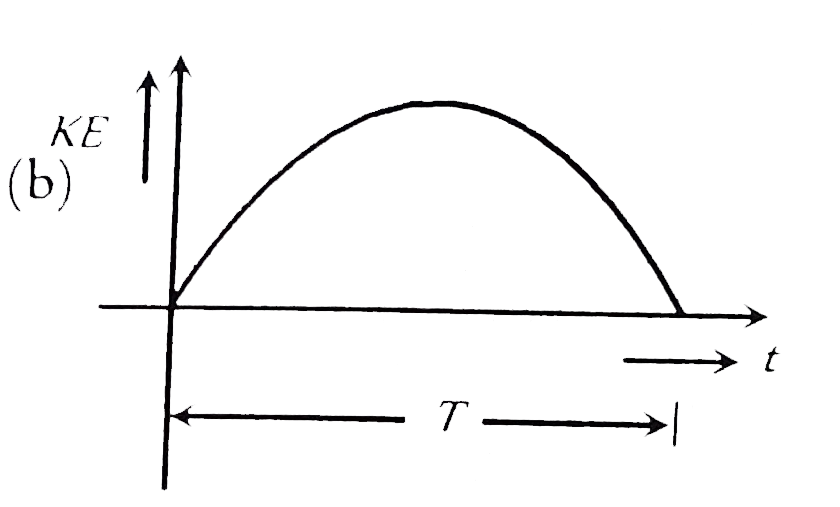 C
C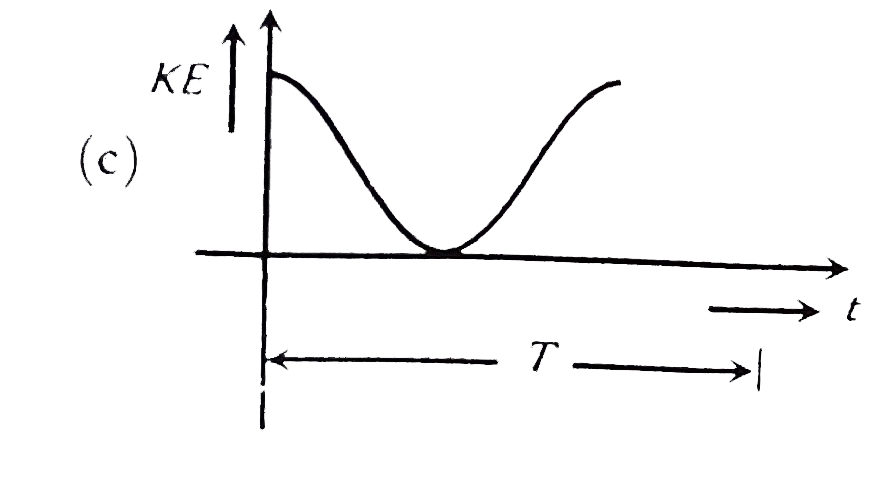 D
D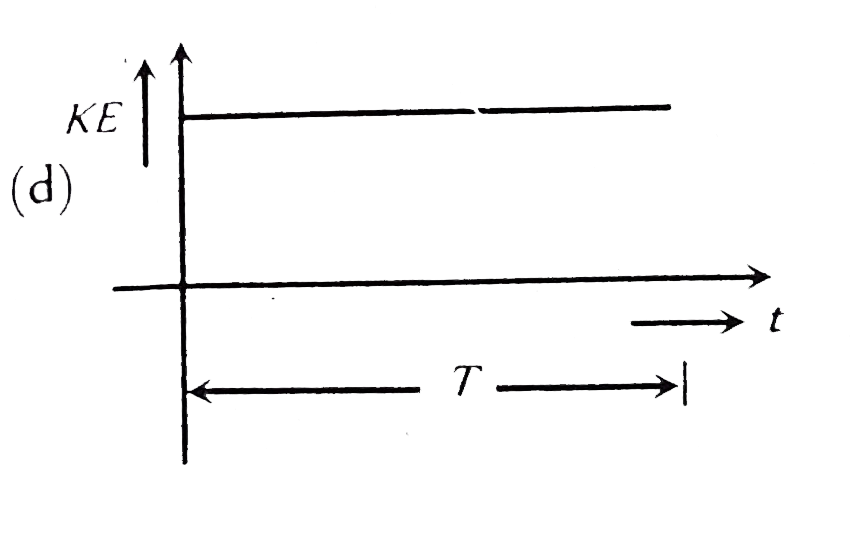
- Question 3 - Select One
Which of the graph between kinetic energy and time is correct ?
AABBCEDF
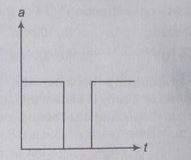
Acceleration time graph of a body is shown below the corresponding velocity time graph of the same body is
 View Solution
Acceleration time graph of a body is shown below the corresponding velocity time graph of the same body is
 View Solution
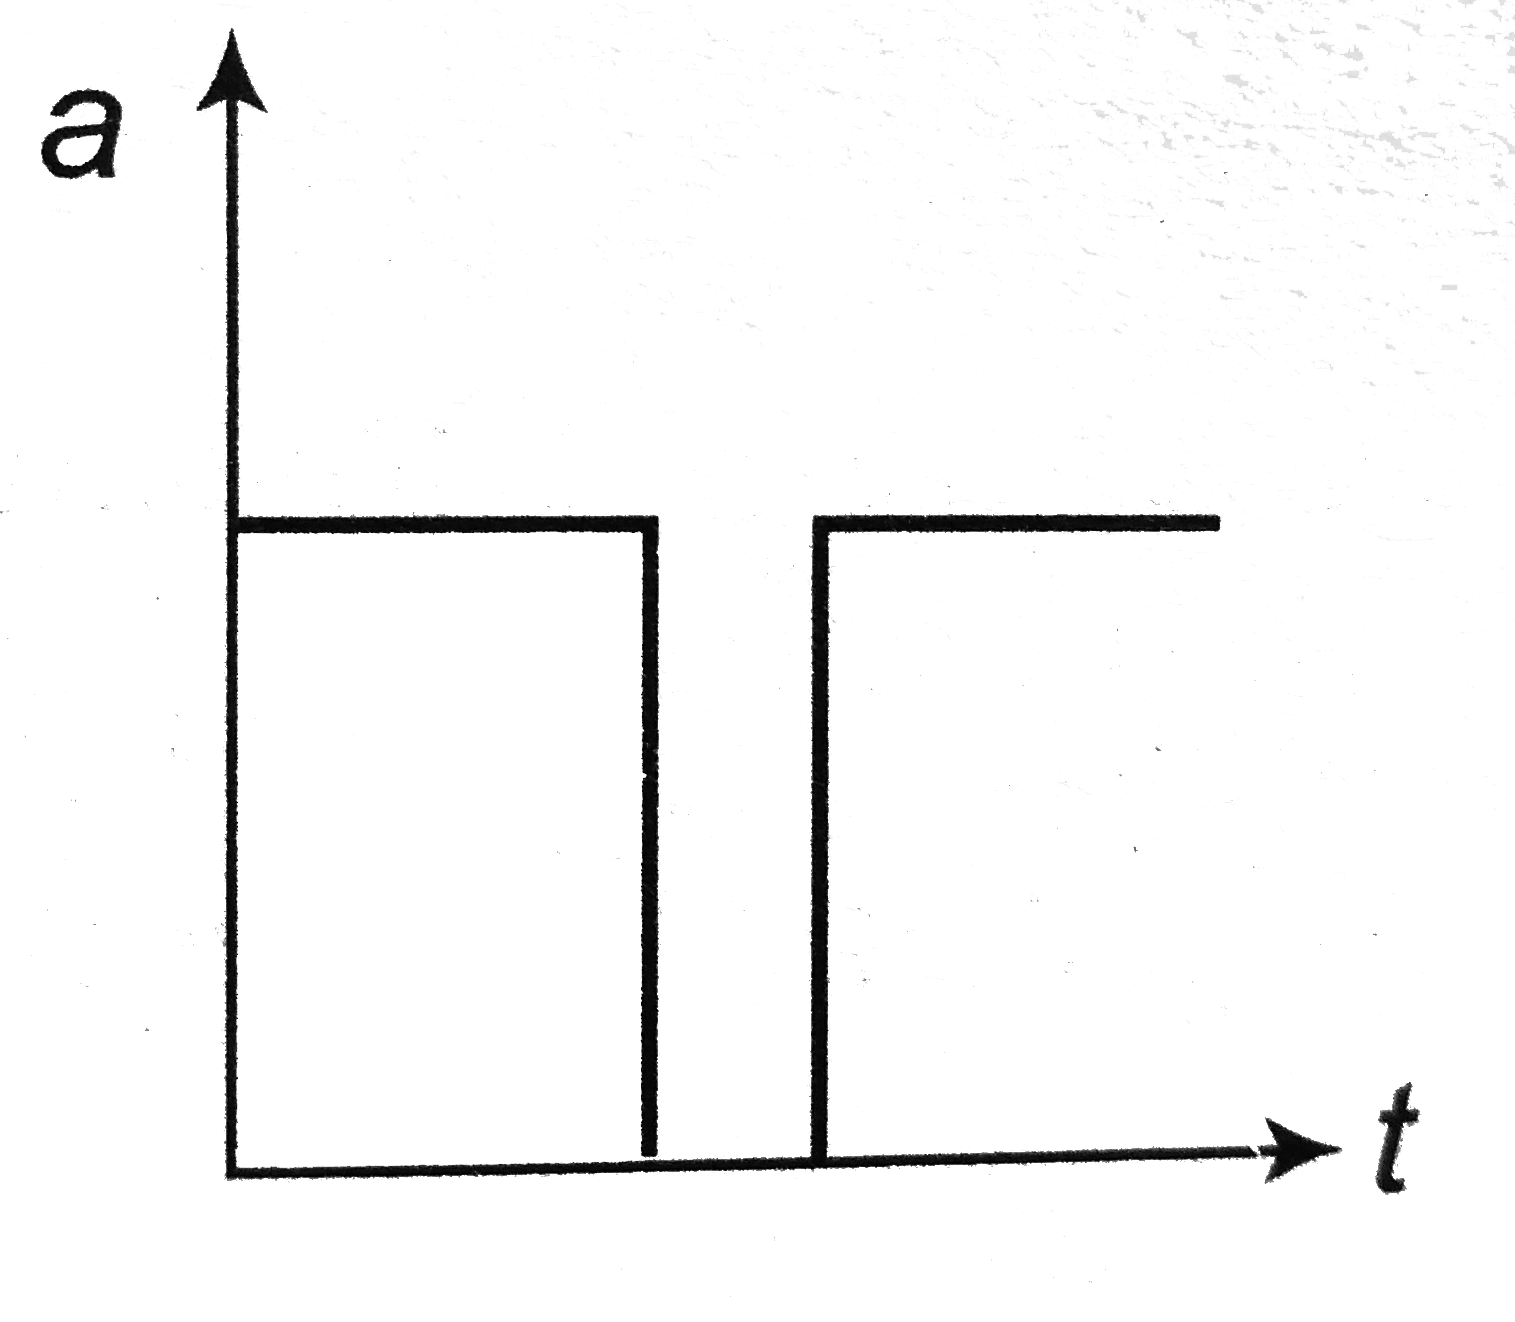
Acceleration-time graph of a body is shown. The corresponding velocity-time graph of the same body is.
 View Solution
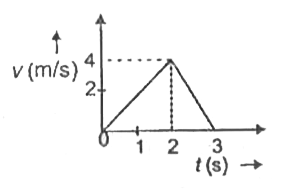
The velocity versus time graph of a body moving in a straight line is as shown in the figure below
 View Solution
The acceleration time graph of a body is shown below the most probable velocity time graph of the body isView Solution

