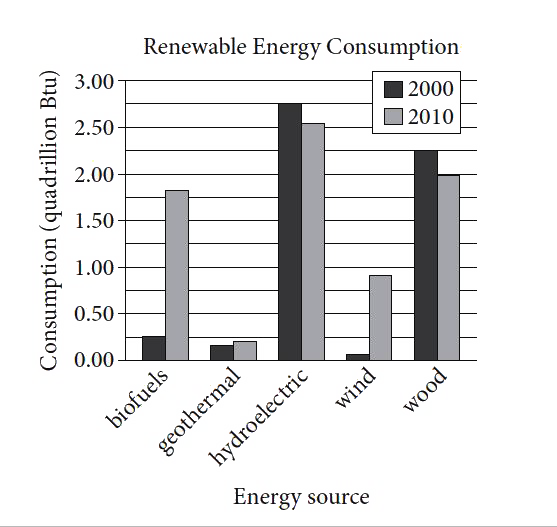
The bar graph above shows renewable energy consumption in quadrillions of British thermal units (Btu) in the United States, by energy source, for several energy sources in the years 2000 and 2010.
In a scatterplot of this data, where renewable energy consumption in the year 2000 is plotted along the x-axis and renewable energy consumption in the year 2010 is plotted along the y-axis for each of the given energy sources, how many data points would be above the line y=x ?
A
1
B
2
C
3
D
4
Text Solution
The correct Answer is:C
The exact coordinates of the scatterplot in the xy-plane cannot be read from the bar graph provided. However, for a data point to be above the line y = x, the value of y must be greater than the value of x. That is, the consumption in 2010 must be greater than the consumption in 2000. This occurs for 3 types of energy sources shown in the bar graph: biofuels, geothermal, and wind. Choices A, B, and D are incorrect and may be the result of a conceptual error in presenting the data shown in a scatterplot. For example, choice B is incorrect because there are 2 data points in the scatterplot that lie below the line y = x.
|
Similar Questions
Distinguish between renewable and non renewable sources of energy.
View SolutionWhich are the renewable sources of energy ?
View SolutionWhat is renewable sources of energy?
View SolutionShort Note-Renewable Sources of Energy Renewable Sources of Energy:
View SolutionWhat is renewable source of energy?
View SolutionIs geothermal energy a renewable source of energy?
View Solutionऊर्जा के नवीकरणीय स्रोत क्या होते हैं?
View Solutionजीवाश्म ईंधन, उर्जा के नवीकरणीय स्रोत है या अनवीकरणीय स्रोत?
View Solution
