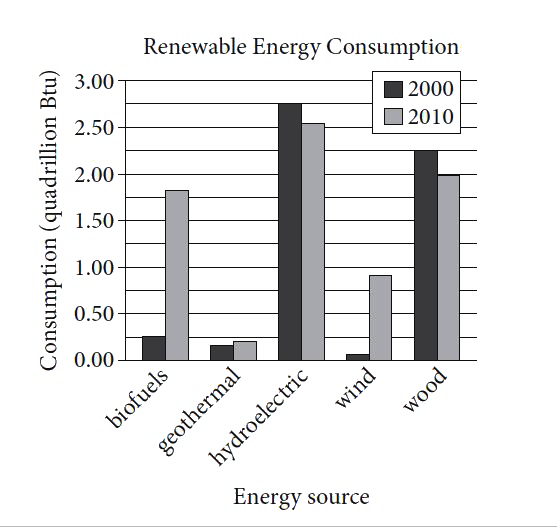
The bar graph above shows renewable energy consumption in quadrillions of British thermal units (Btu) in the United States, by energy source, for several energy sources in the years 2000 and 2010.
Of the following, which best approximates the percent decrease in consumption of wood power in the United States from 2000 to 2010 ?
0.06
0.11
0.21
0.26
The correct Answer is:B
Reading the graph, the amount of wood power used in 2000 was 2.25 quadrillion BTUs and the amount used in 2010 was 2.00 quadrillion BTUs. To find the percent decrease, find the difference between the two numbers, divide by the original value, and then multiply by 100:
2.25−2.002.25×100=0.252.25×100≈11.1 percent. Of the choices given, 11% is closest to the percent decrease in the consumption of wood power from 2000 to 2010. Choices A, C, and D are incorrect and may be the result of errors in reading the bar graph or in calculating the percent decrease.
Similar Questions
The inequation represented by the graph given below is :
View SolutionThe inequation that best describes the graph given below is _________
View SolutionThe inequation that best describes the following graph is _________
View SolutionWhich inequations represent the shaded region in the given figure
View SolutionFrom the following figure, the correct observation is :- ltimg src="https://d10lpgp6xz60nq.cloudfront.net/physics_images/ALN_PHY_R03_E08_015_Q01.png" width="80%"gt
View SolutionMatch the followings (column I with column II)
ltimg src="https://d10lpgp6xz60nq.cloudfront.net/physics_images/NCERT_BIO_XI_C03_E01_011_Q01.png" width="80%"gt
View Solution
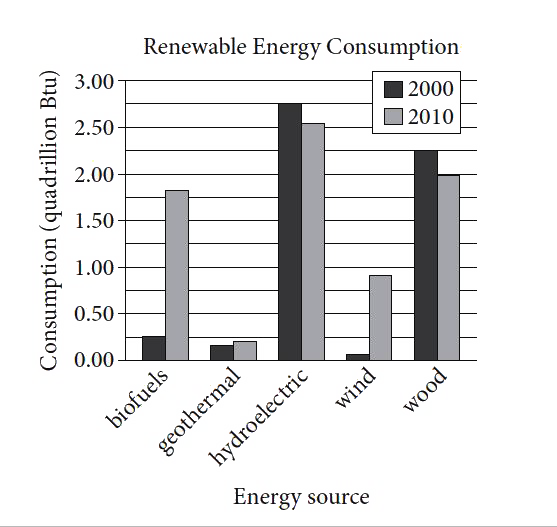
The bar graph above shows renewable energy consumption in quadrillions of British thermal units (Btu) in the United States, by energy source, for several energy sources in the years 2000 and 2010.
In a scatterplot of this data, where renewable energy consumption in the year 2000 is plotted along the x-axis and renewable energy consumption in the year 2010 is plotted along the y-axis for each of the given energy sources, how many data points would be above the line y=x ?
View Solution
