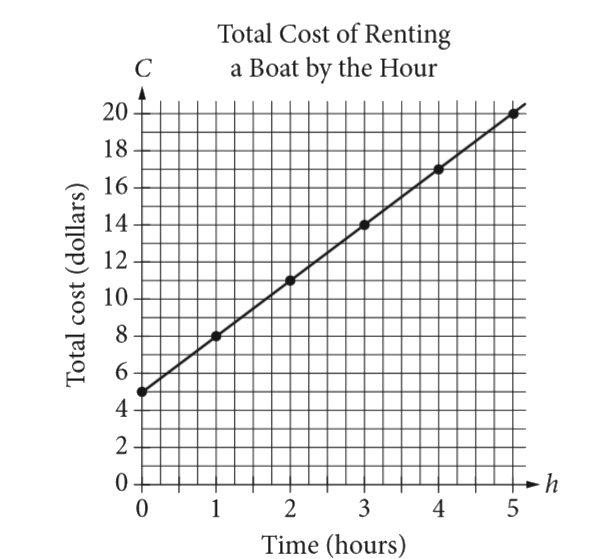
The graph above displays the total cost C, in dollars, of renting a boat for h hours.
What does the C-intercept represent in the graph?
The initial cost of renting the boat
The total number of boats rented
The total number of hours the boat is rented
The increase in cost to rent the boat for each additional hour
The correct Answer is:A
Step by step video, text & image solution for The graph above displays the total cost C, in dollars, of renting a boat for h hours. What does the C-intercept represent in the graph? by Maths experts to help you in doubts & scoring excellent marks in Class 12 exams.
Similar Questions
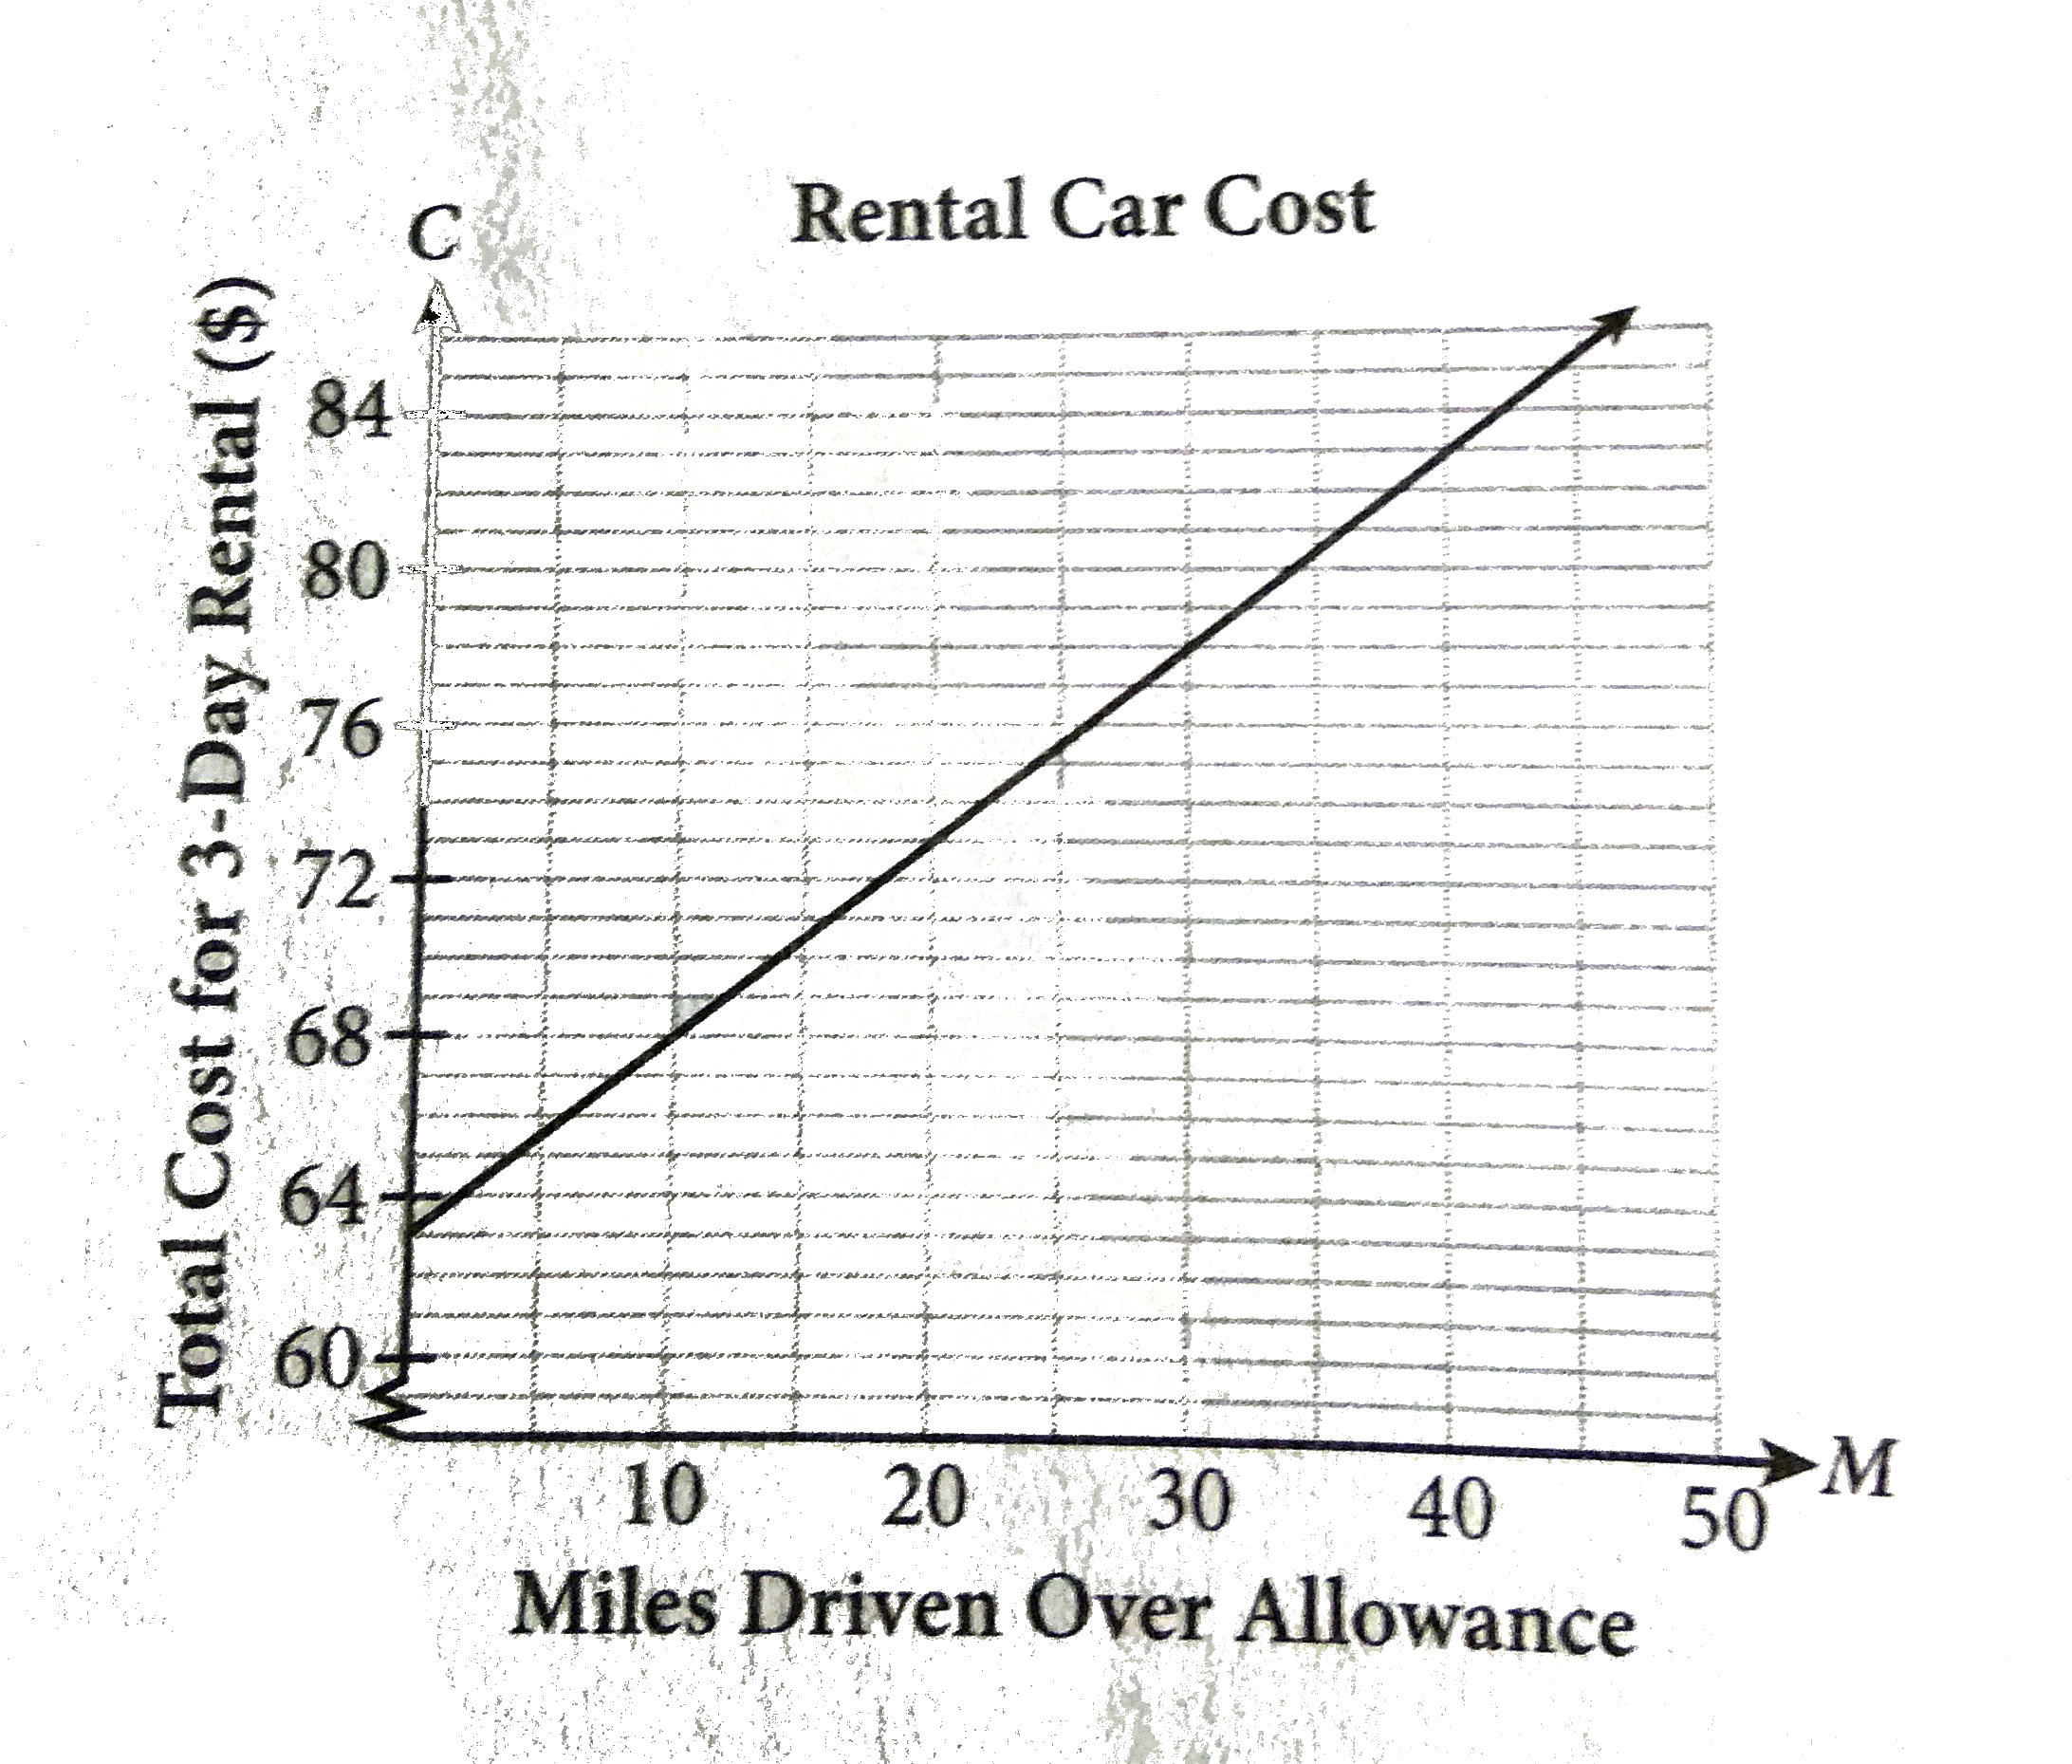
A car retal agency charges a per day rental fee which includes a daily mile age allowance plus a certain amount per mile driven over the allowance. The graph above compares the miles driven over the allowance and the total cost for a 3-day rental. What does the C-intercept most likely represent in this scenario?View SolutionWhat does the slope of a work-time graph represent?
View Solution
Knowledge Check
- Question 1 - Select One
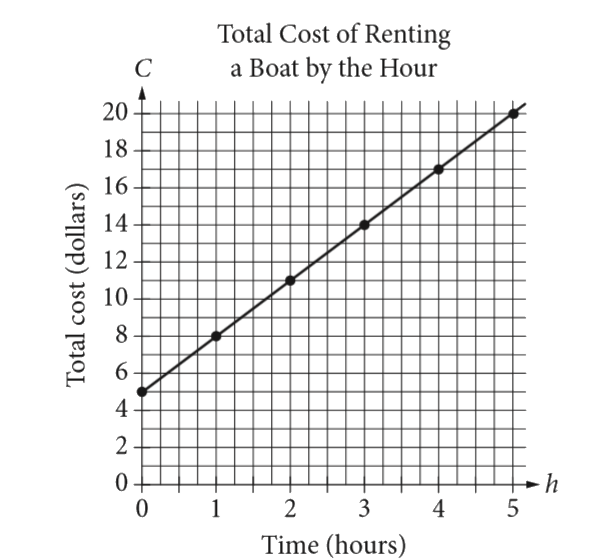
The graph above displays the total cost C, in dollars, of renting a boat for h hours.
Which of the following represents the relationship between h and C ?AC=5hBC=34h+5CC=3h+5Dh=3C - Question 2 - Select One
What does this graph not represent a function ?
A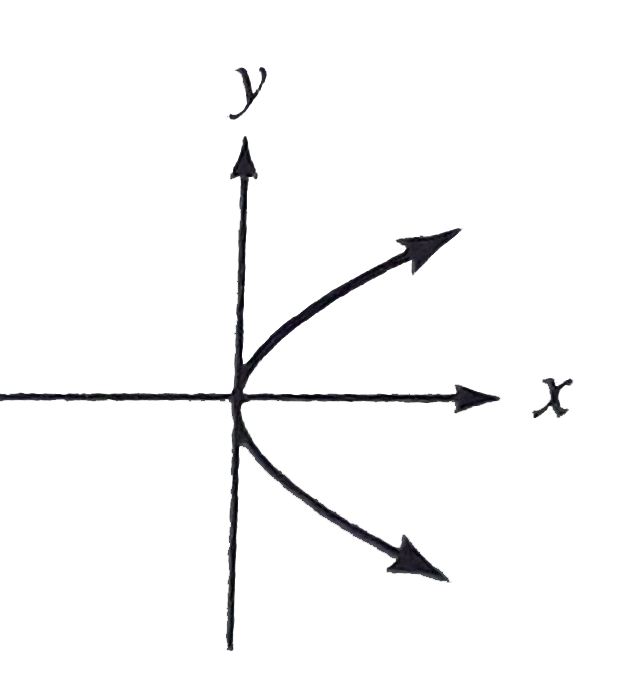 B
B C
C D
D
- Question 3 - Select One
y = 19.99 + 1.50x
The equation above models the total cost y, in dollars, that a company charges a customer to rent a truck for one day and drive the truck x miles. The total cost consists of a flat fee plus a charge per mile driven. When the equation is graphed in the xy-plane, what does the y-intercept of the graph represent in terms of the model?AA flat fee of $19.99BA charge per mile of $1.50CA charge per mile of $19.99DTotal daily charges of $21.49
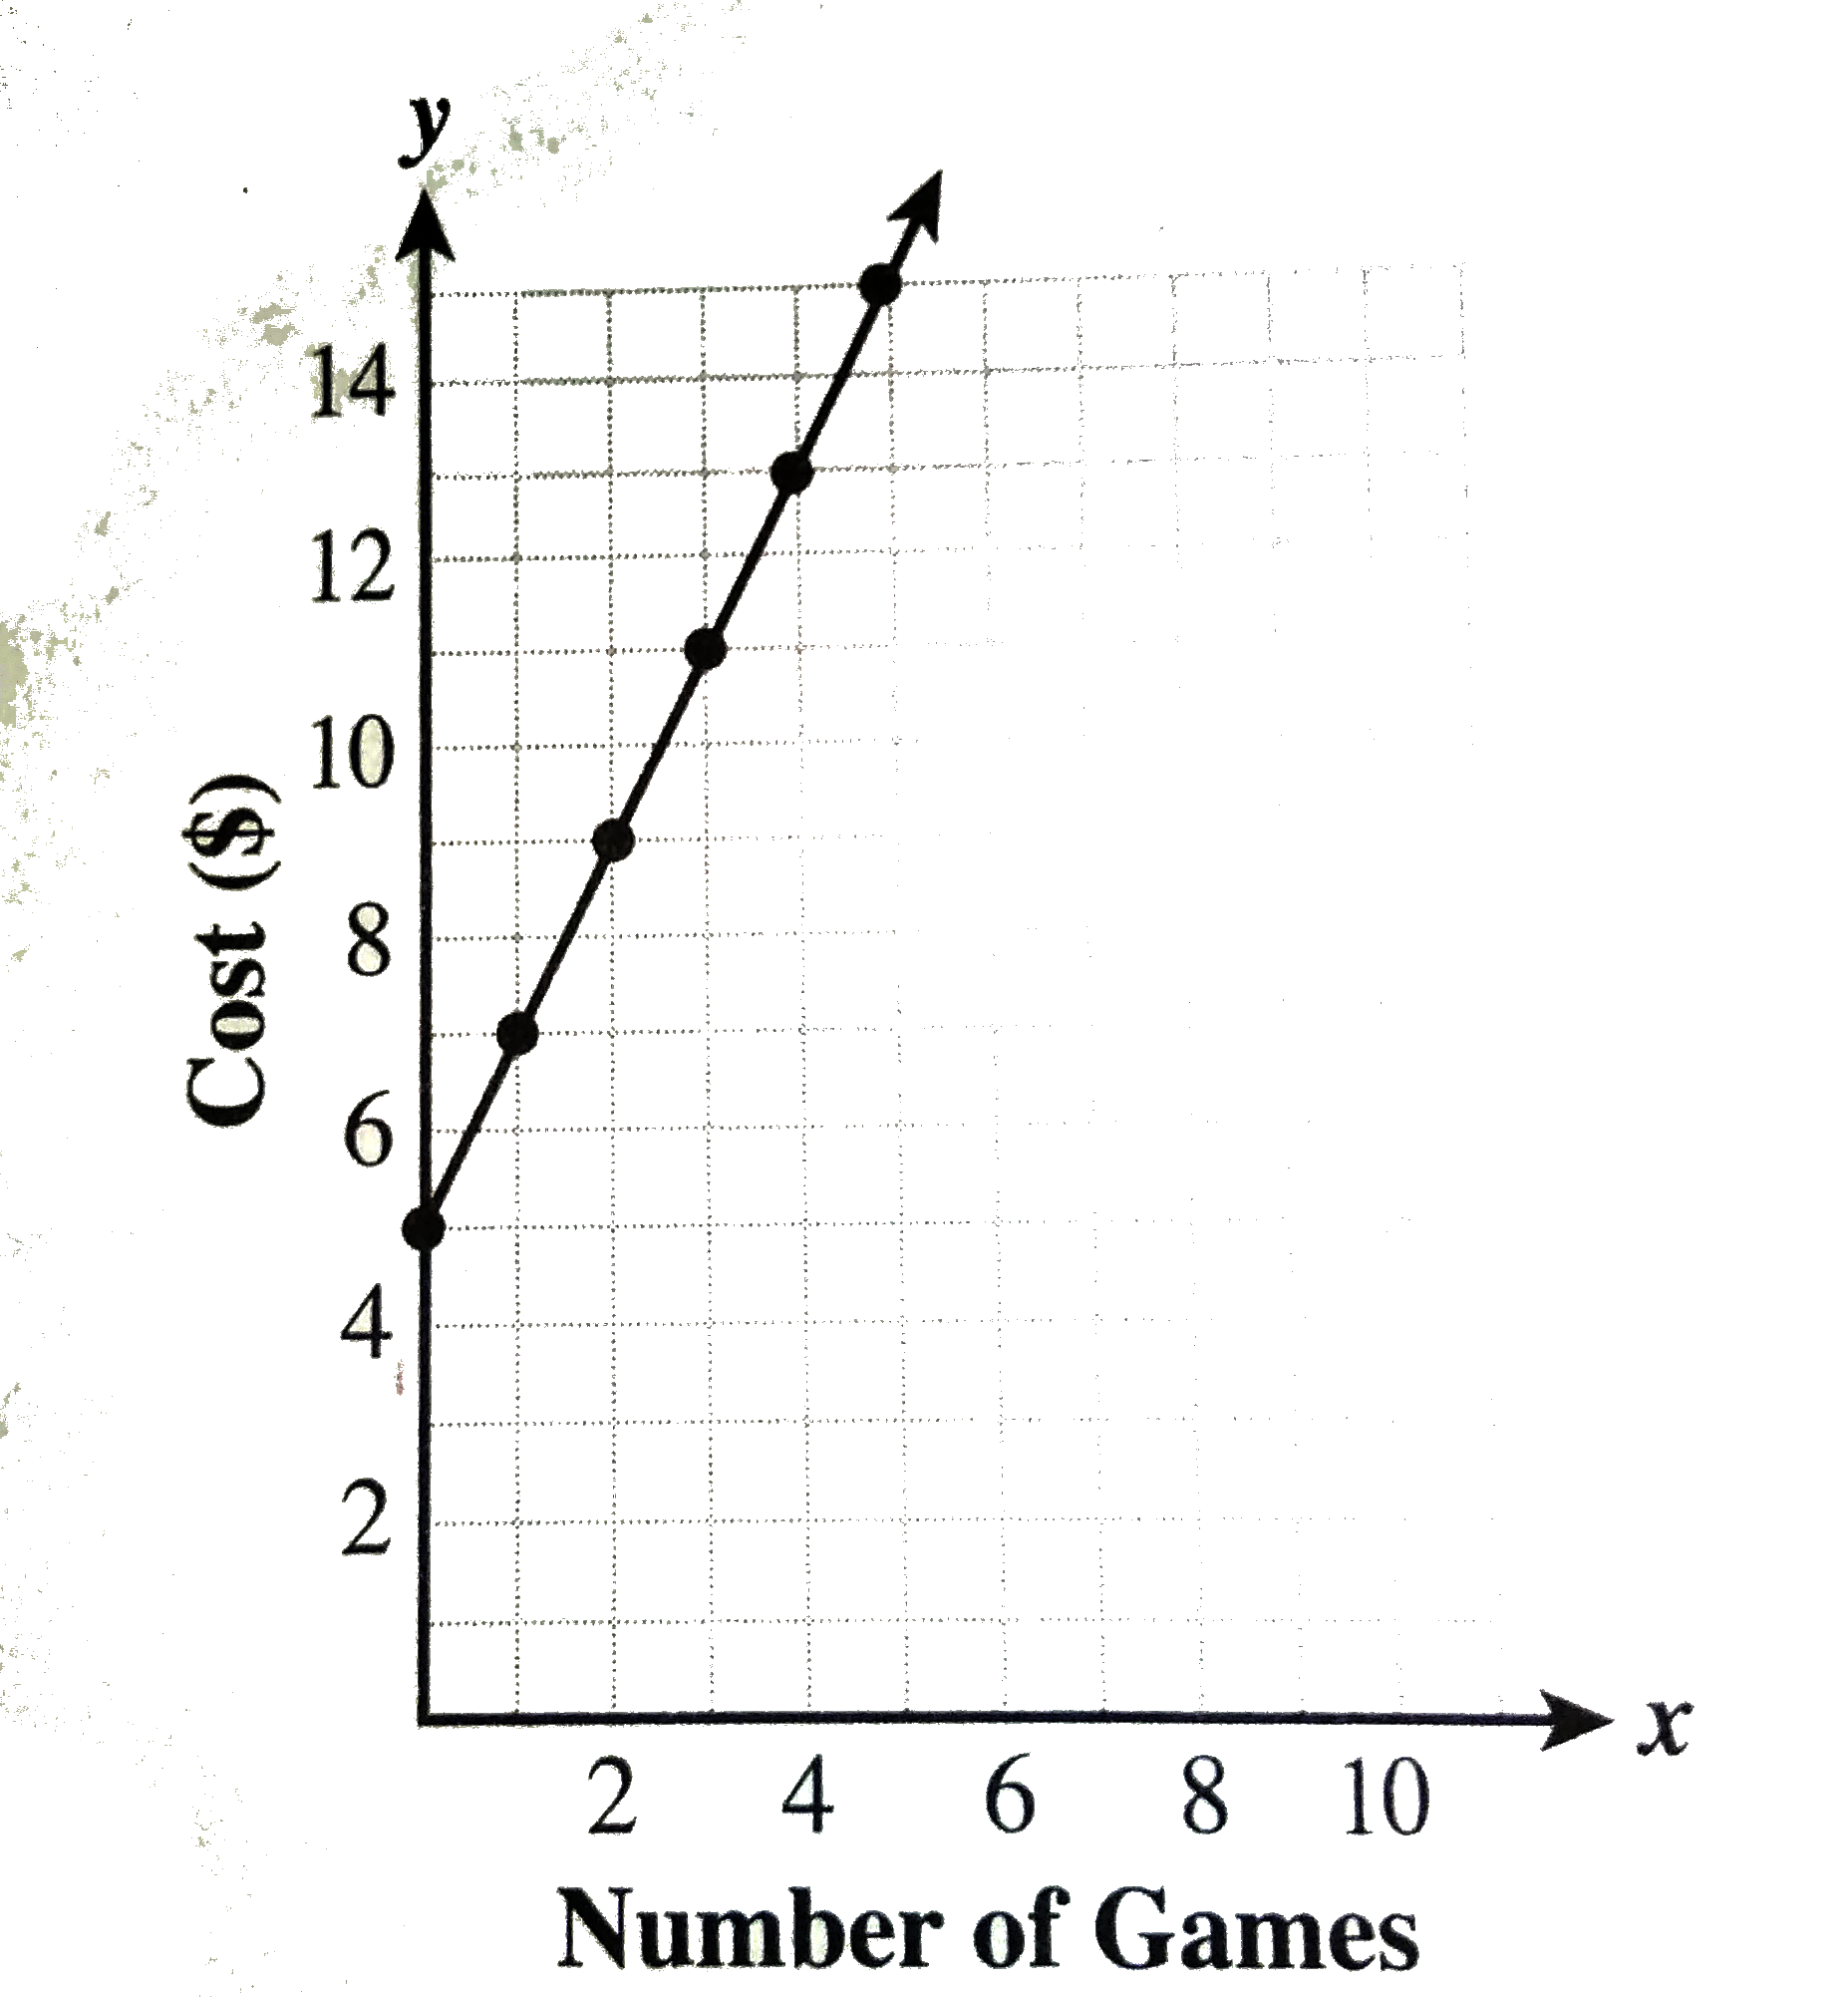
The graph above shows the amount that a new, high-tech video arcade charges its customers What could the y-intercept of this graph represent?View SolutionThe line graphed in the xy-plane below models the total cost, in dollars, for a cab ride, y, in a certain city during nonpeak hours based on the number of miles traveled, x.
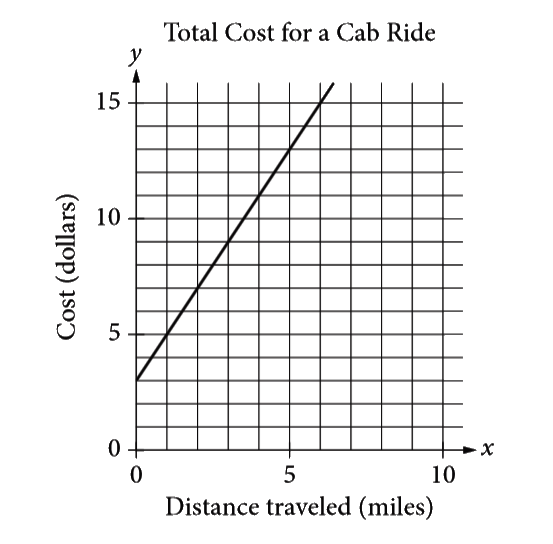
According to the graph, what is the cost for each additional mile traveled, in dollars, of a cab ride?View Solution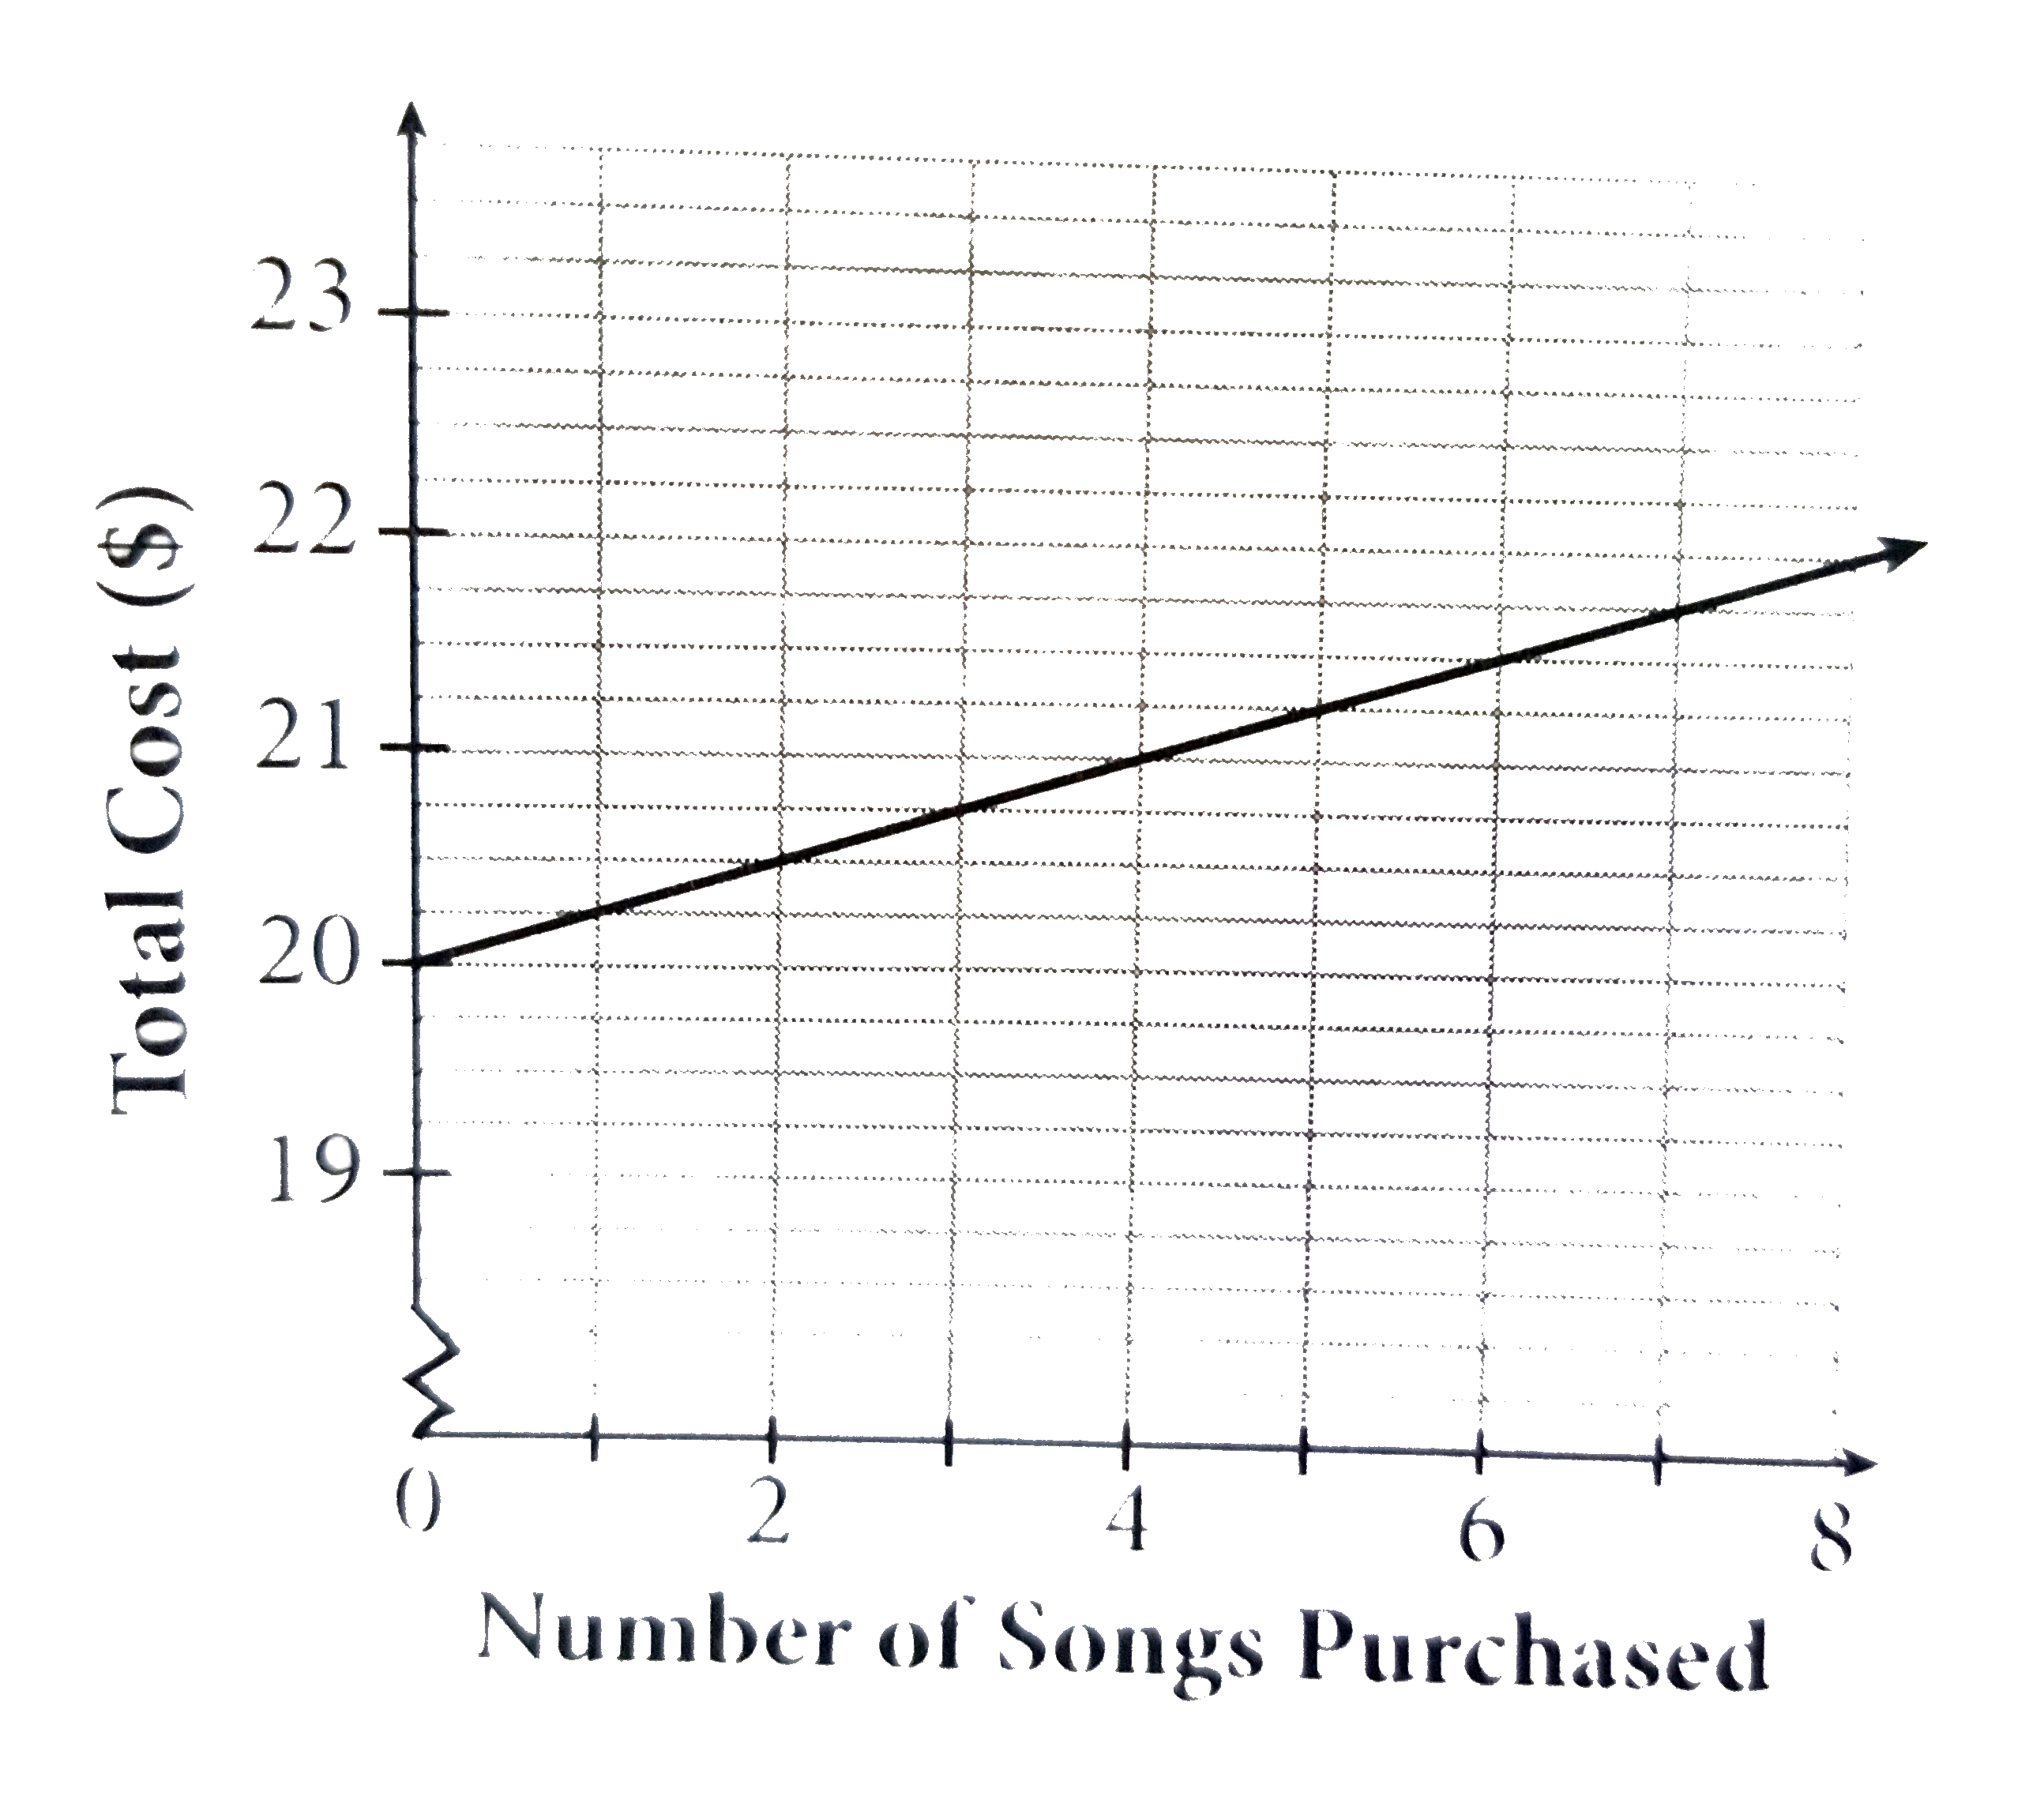
The graph above shows the cost of joining and buying music from a music subsciption service. What does the y-intercept of the line most likely represent ?View SolutionSalim wants to purchase tickets from a vendor to watch a tennis match. The vendor charges a one-time service fee for processing the purchase of the tickets. The equation T = 15n + 12 represents the total amount T, in dollars, Salim will pay for n tickets. What does 12 represent in the equation?
View SolutionC=60+0.05d
The equation above represents the total monthly cost, C, in dollars of a data plan offered by a cell phone company when the data usage in a month exceeds a 1 gigabyte limit by d megabytes. According to the model, what is the meaning of 0.05?View Solution

