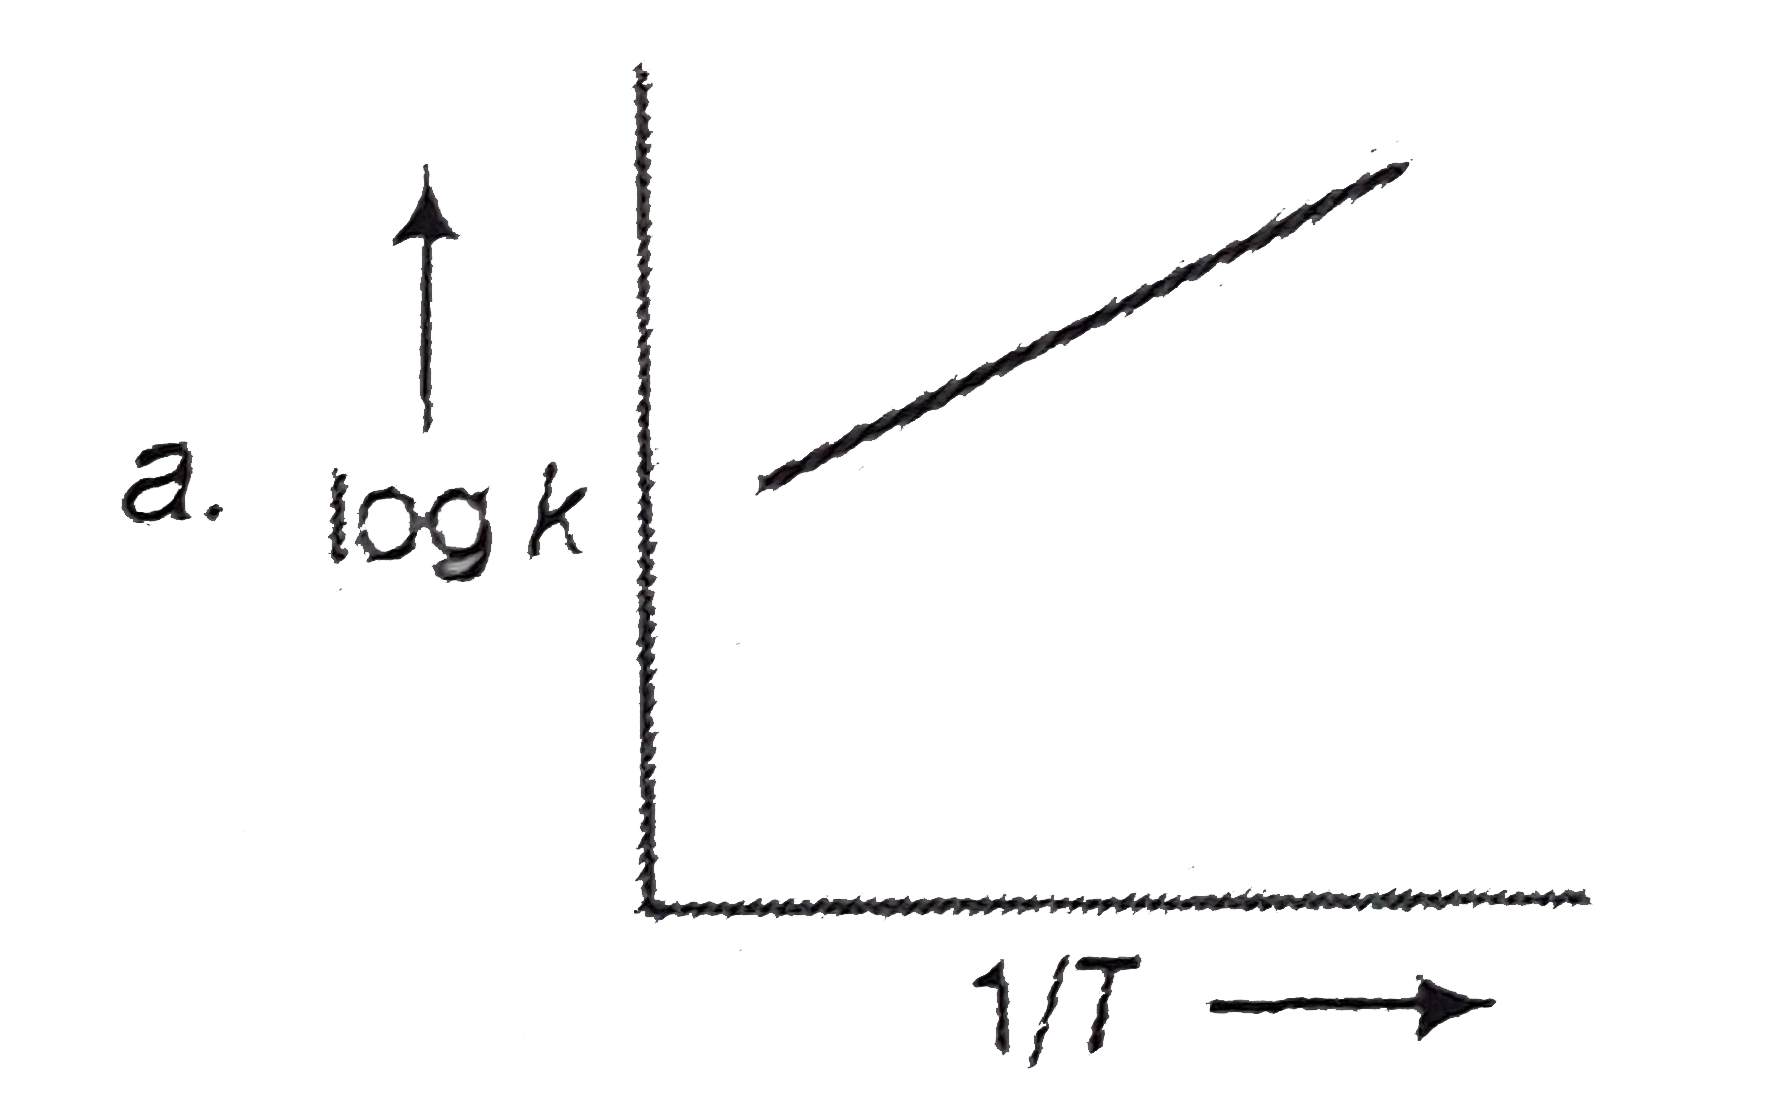
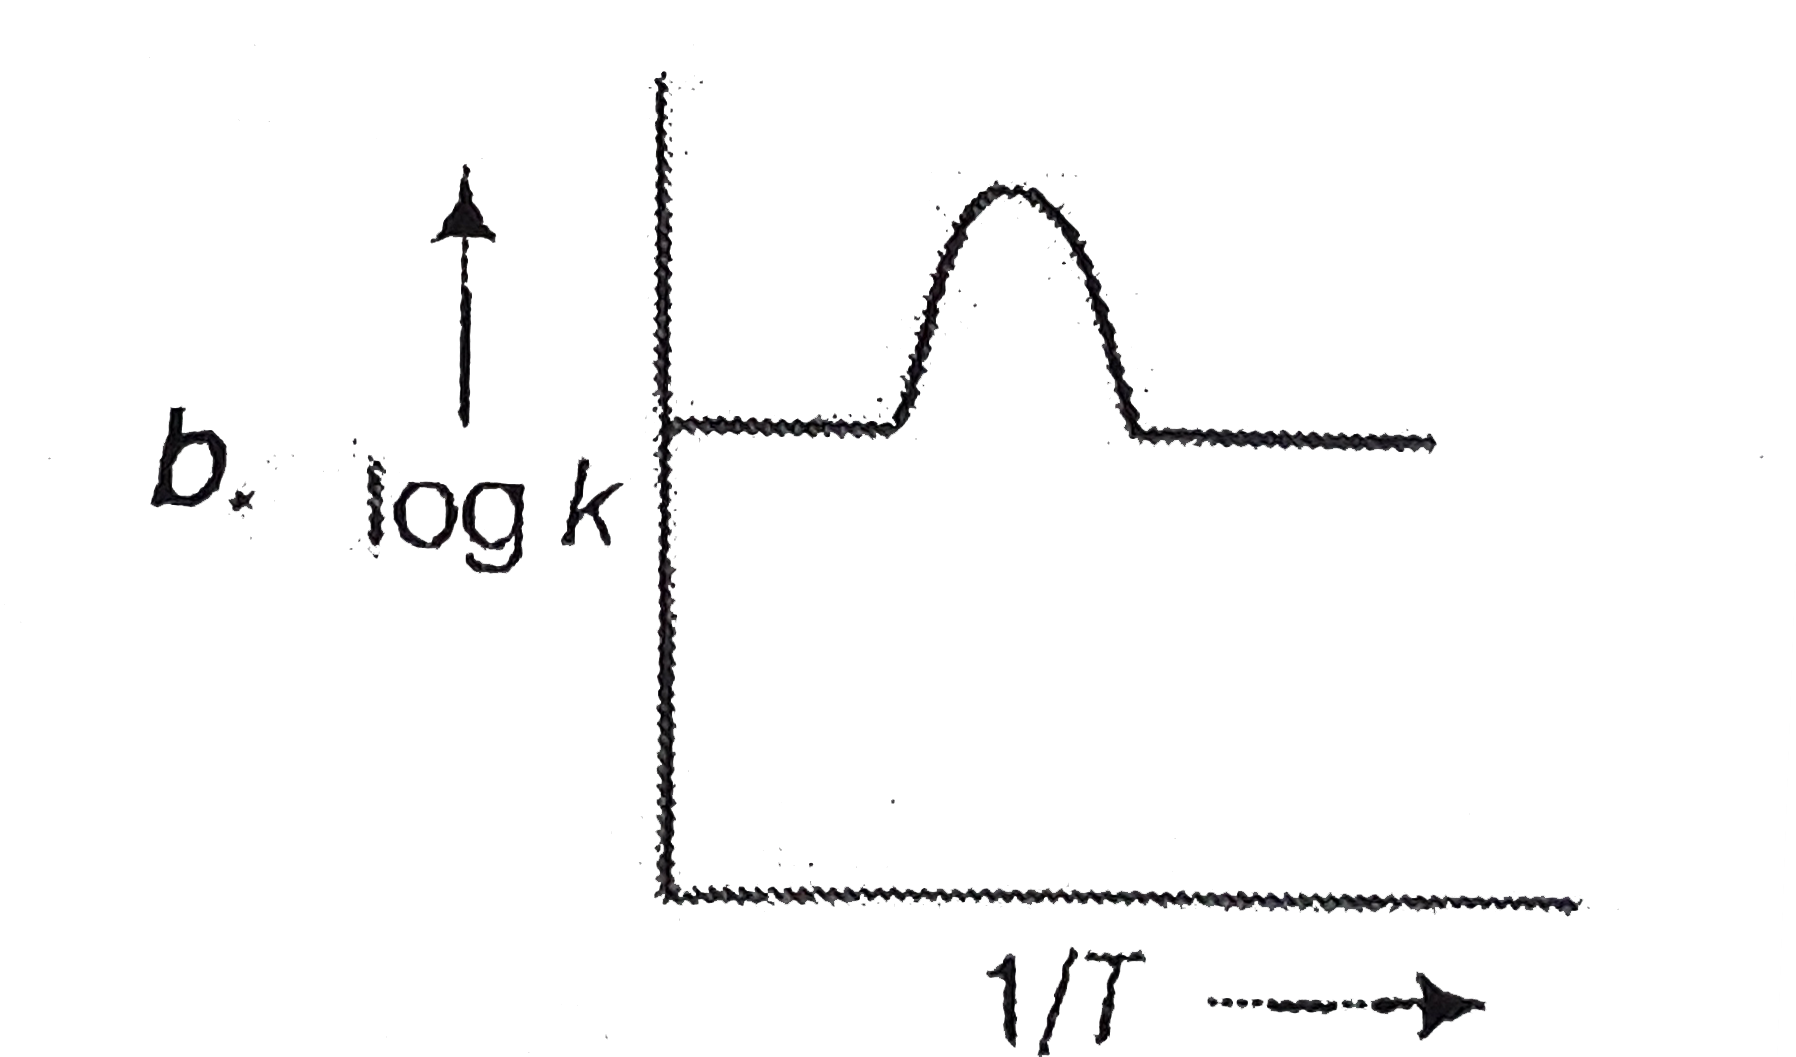
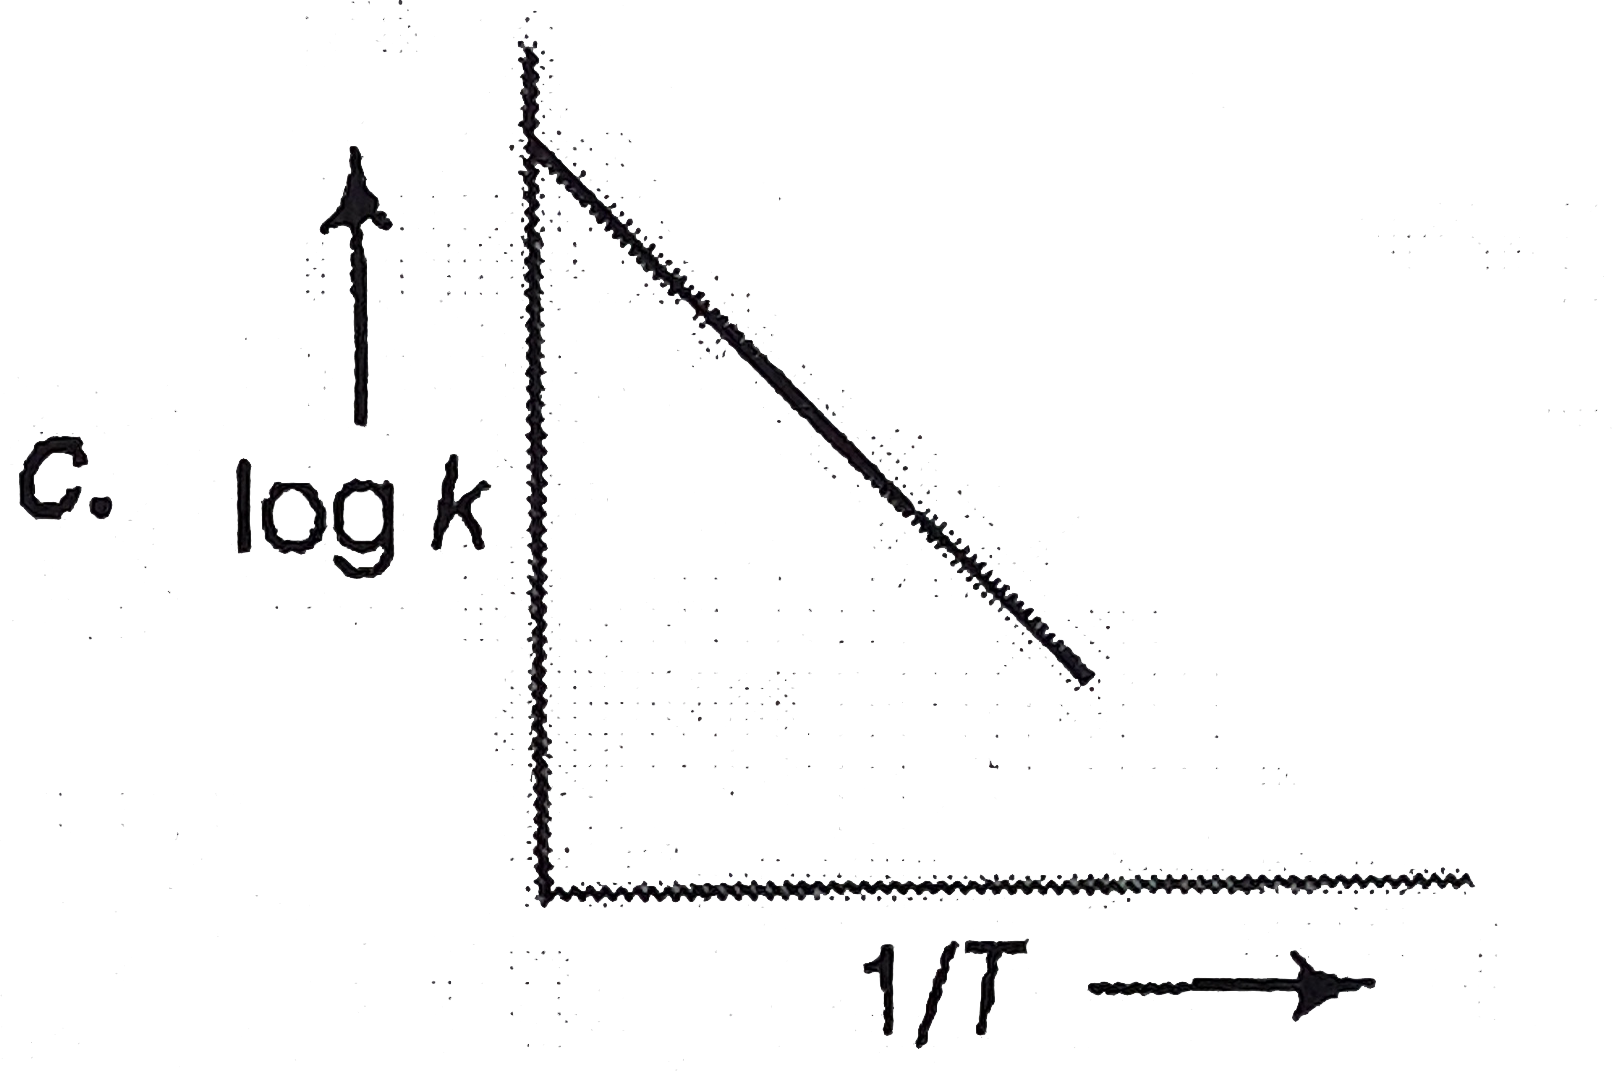
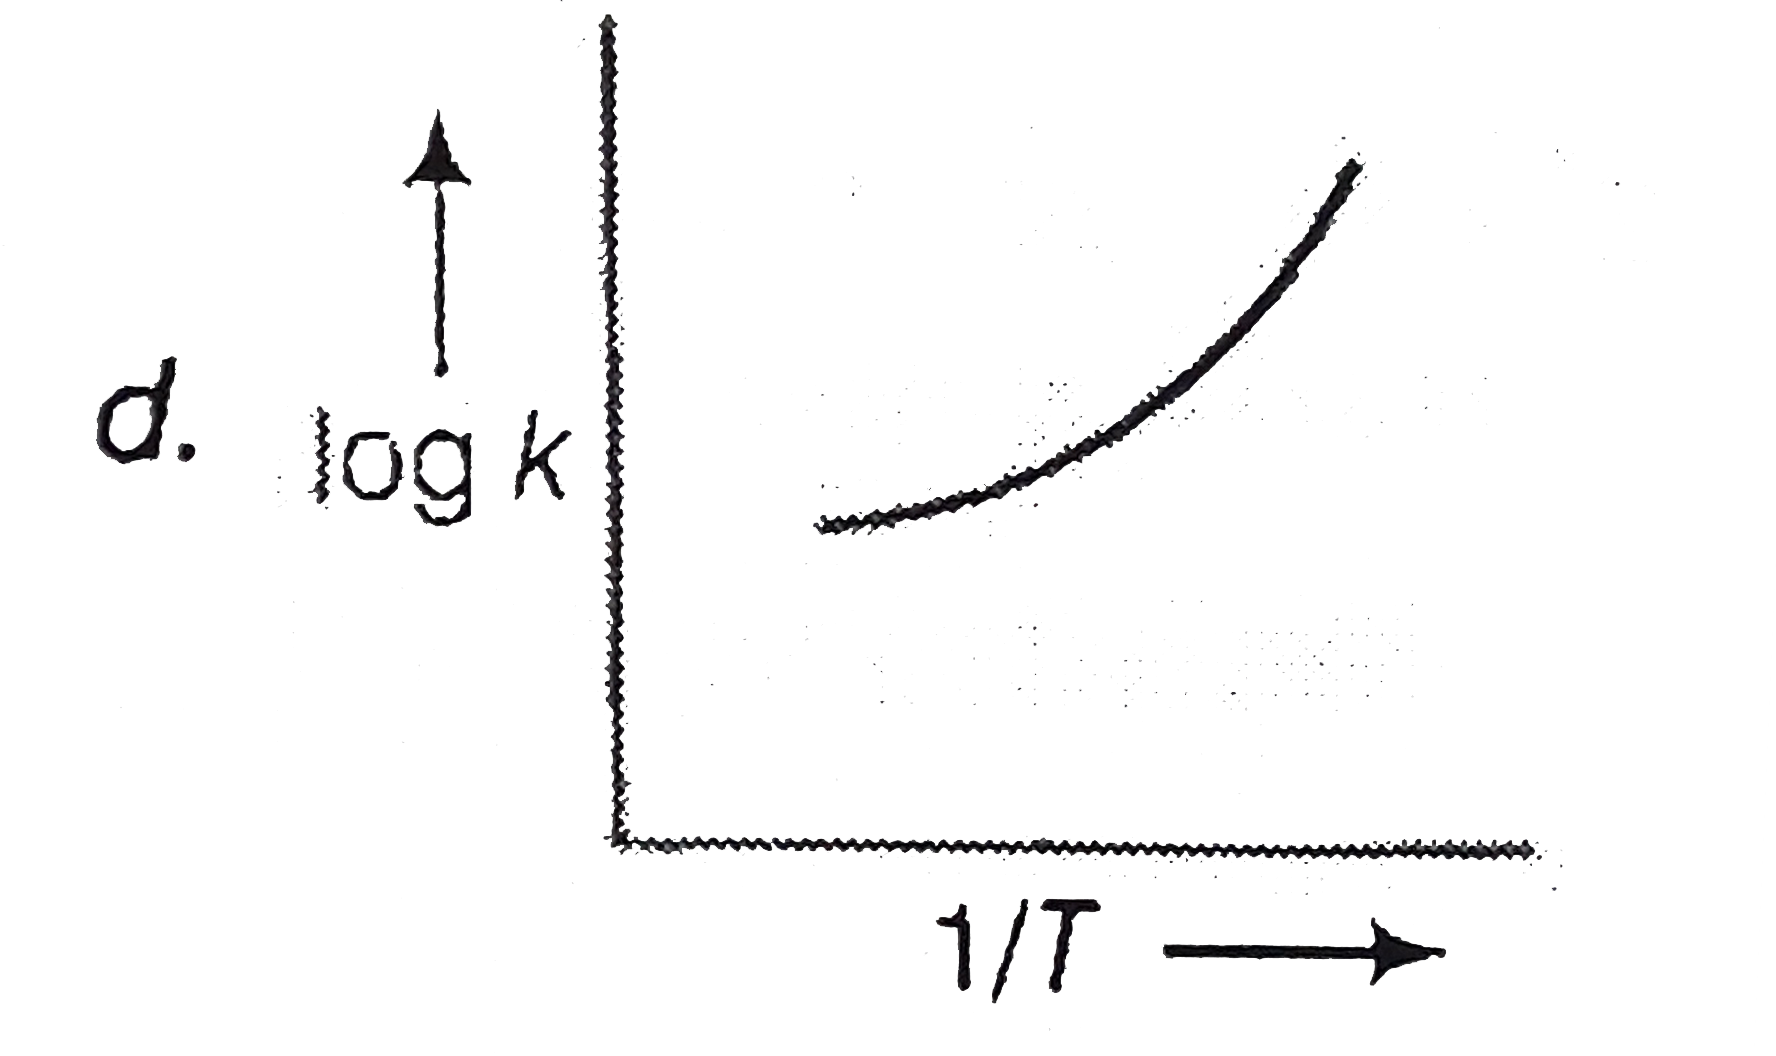
Explain how will you find activation energy of a reaction by graphical method. (or) Draw the graph between log k vs 1T. What is the relationship between its slope and acitivation energy.
Text Solution
A plot of log k against 1T values gives a straight line with slope value equal to - Ea/2.303R and intercept value equals to log A.

(ii) The plot gives a negative slope straight line also.
(iii) From the slope of straight line Ea can be calculated.
|
Topper's Solved these Questions
- CHEMICAL KINETICS BOOK - SURA PUBLICATIONCHAPTER - CHEMICAL KINETICS EXERCISE - NUMERICAL PROBLEMS
14 Videos
- CHEMICAL KINETICS BOOK - SURA PUBLICATIONCHAPTER - CHEMICAL KINETICS EXERCISE - UNIT TEST (CHOOSE THE CORRECT ANSWER)
5 Videos
- CHEMICAL KINETICS BOOK - SURA PUBLICATIONCHAPTER - CHEMICAL KINETICS EXERCISE - ADDITIONAL QUESTIONS AND ANSWERS (LONG ANSWER)
5 Videos
- CARBONYL COMPOUNDBOOK - SURA PUBLICATIONCHAPTER - CARBONYL COMPOUNDEXERCISE - UNIT TEST (LONG ANSWER)
1 Videos
- CHEMISTRY IN EVERYDAY LIFE BOOK - SURA PUBLICATIONCHAPTER - CHEMISTRY IN EVERYDAY LIFE EXERCISE - UNIT TEST (LONG ANSWER )
1 Videos
Similar Questions
Knowledge Check
A graph plotted between log k vs 1T is represented by
A B
B C
C D
D
If we plot a graph between log K and 1T by Arrhenius equation , the slope is
A−EaRB+EaRC−Ea2.303RD+Ea2.303RThe graph between the log K versus 1T is a straight line. The slope of the line is
A−2.303REaB−Ea2.303RC2.303REaDEa2.303R
How can you graphically find the activation energy of the reaction from the above expression?
View SolutionDraw the plot of In vs 1/T for a chemical reaction .What does the intercept represent ? What is the relation between slope and Ea ?
View SolutionDraw the plot of In vs 1/T for a chemical reaction .What does the intercept represent ? What is the relation between slope and Ea ?
View SolutionA graph plotted between logk versus 1/T for calculating activation energy is shown by
View SolutionA graph plotted between logk versus 1/T for calculating activation energy is shown by
View Solution
