A graph plotted between logk versus 1/T for calculating activation energy is shown by


The correct Answer is:B
Step by step video, text & image solution for A graph plotted between log k versus 1//T for calculating activation energy is shown by by Chemistry experts to help you in doubts & scoring excellent marks in Class 12 exams.
Updated on:21/07/2023Topper's Solved these Questions
Similar Questions
The graph between logk versus 1/T is a straight line.
View Solutioni) Write the mathematics expressions relating the variation of the rate constant of a reaction with temperatures.
ii) How can you graphically find the activation energy of the reaction from the above expression?
iii) The slope of the line in the graph of log k(k=rate constant) versus 1/T is −5841. Calculate the activation energy of the reaction.
View Solution
Knowledge Check
A graph plotted between logk versus 1/T for calculating activation energy is shown by
A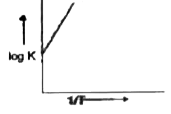 B
B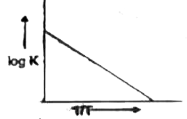 C
C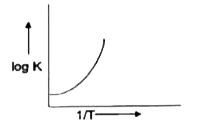 D
D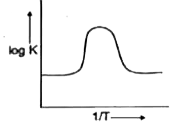
A graph is ploted between log K virsus 1T for calculation of activation energy (Ea). The correct plot is
A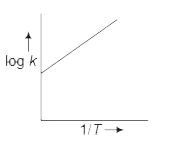 B
B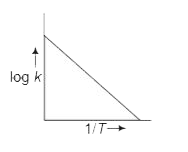 C
C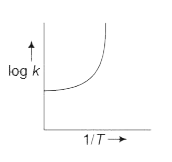 D
D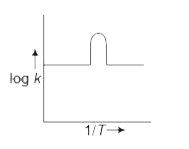
A graph plotted between log k vs 1T is represented by
A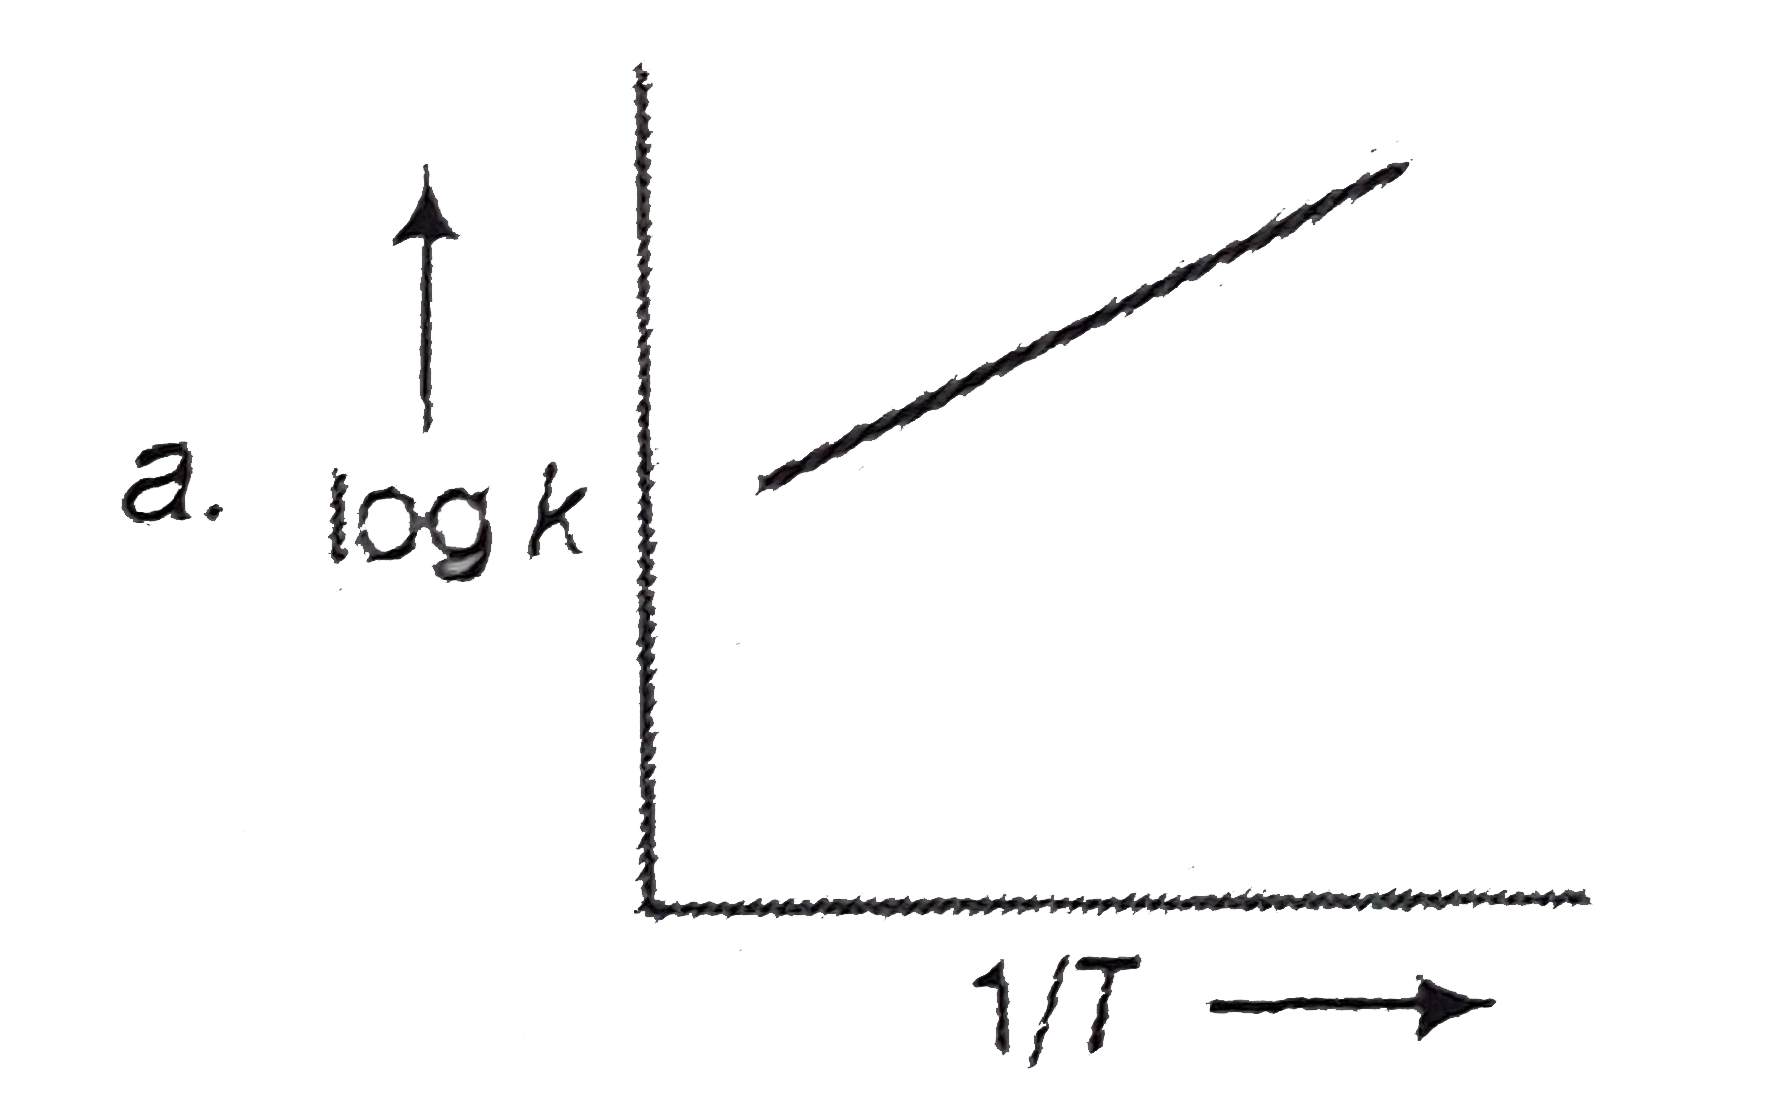 B
B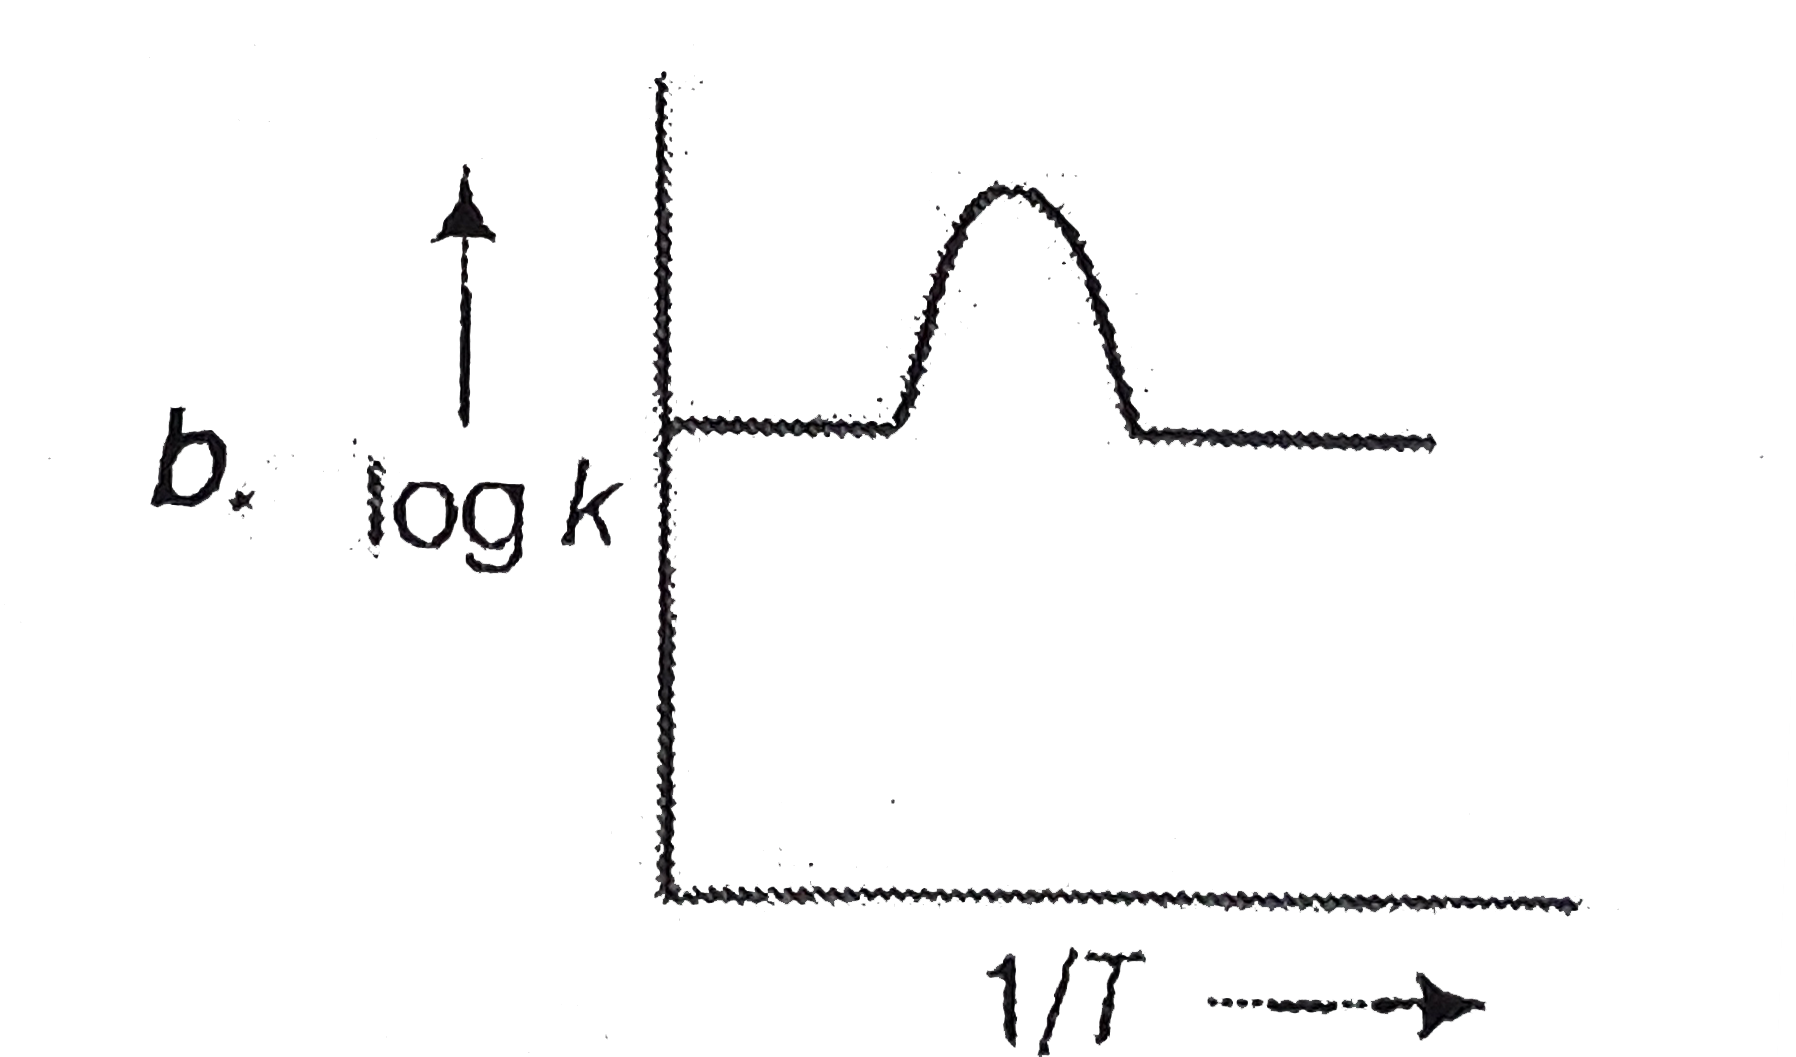 C
C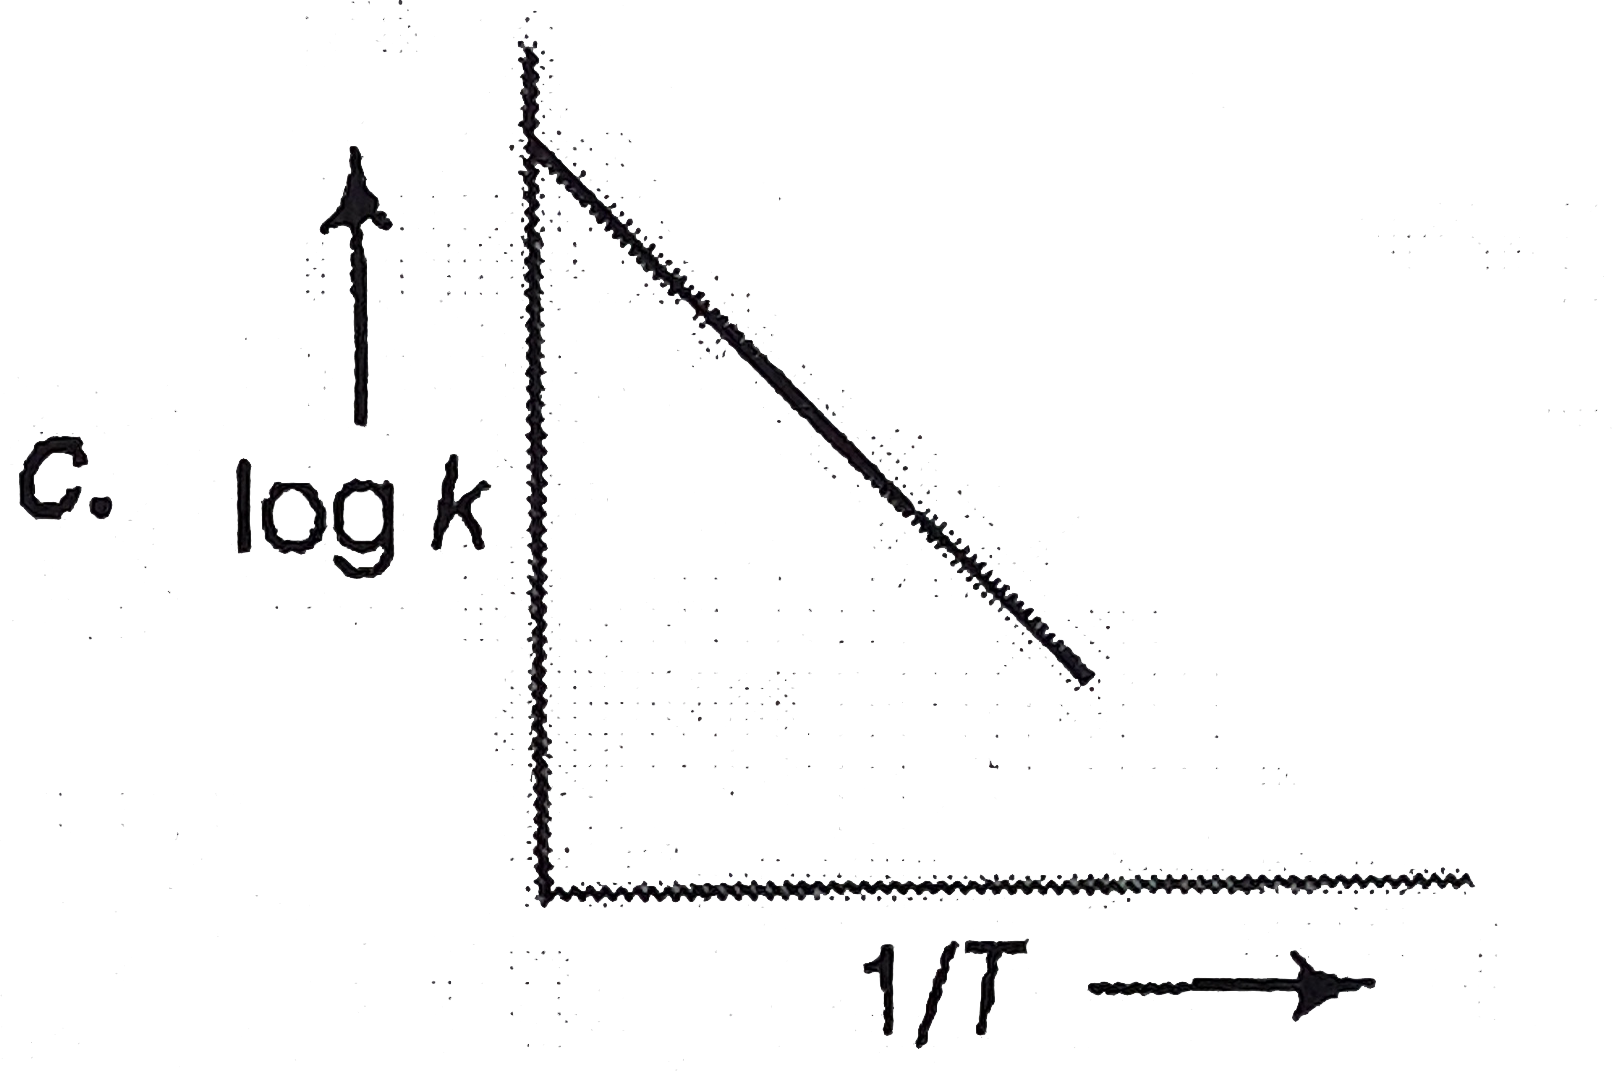 D
D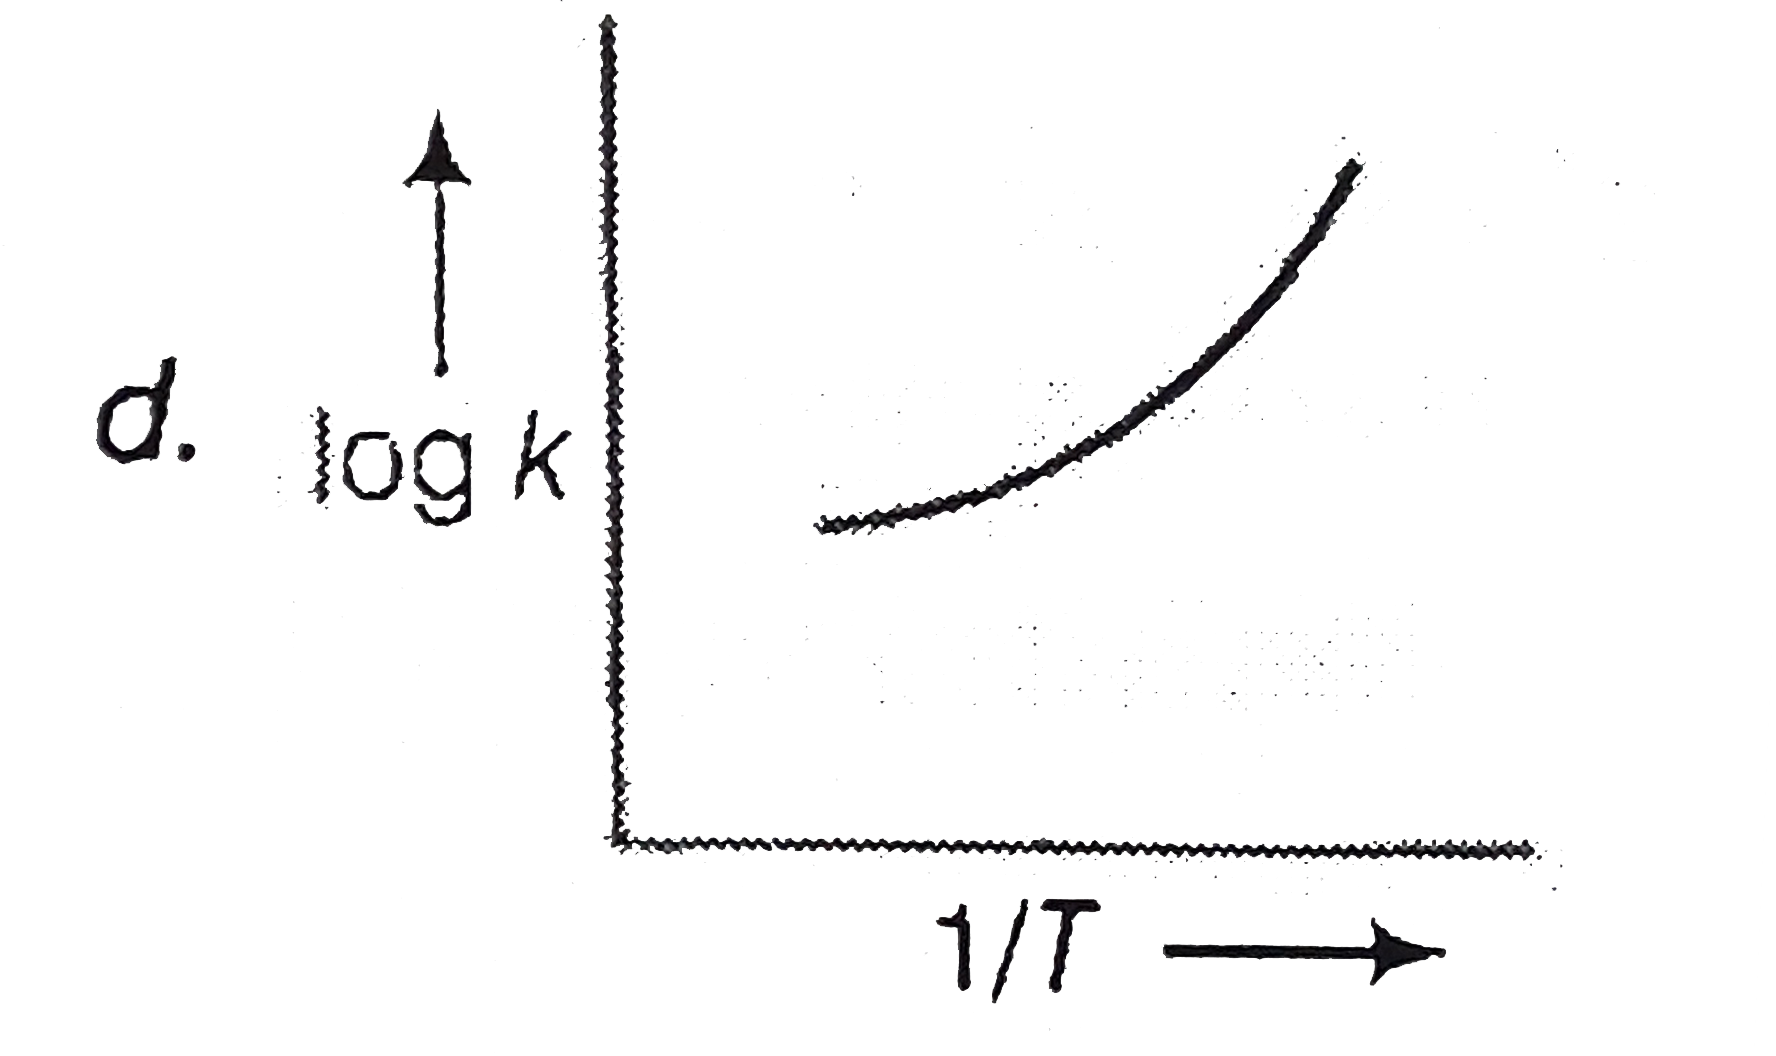
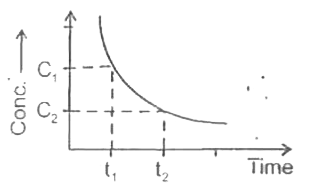
The graph plotted between concentration versus time
View SolutionThe plot og logk vs 1/T helps to calculate
View SolutionThe plot of log k vs 1/T helps to calculate
View SolutionThe slope of straight line graph between ln k us 1T is equal to 2.4×10⁴K. Calculate the activation energy of the reaction at 400 K. (K represents rate constant)
View SolutionIf a graph is plotted between ln k and 1/T for the first order reaction, the slope of the straight line so obtained is given by
View Solution