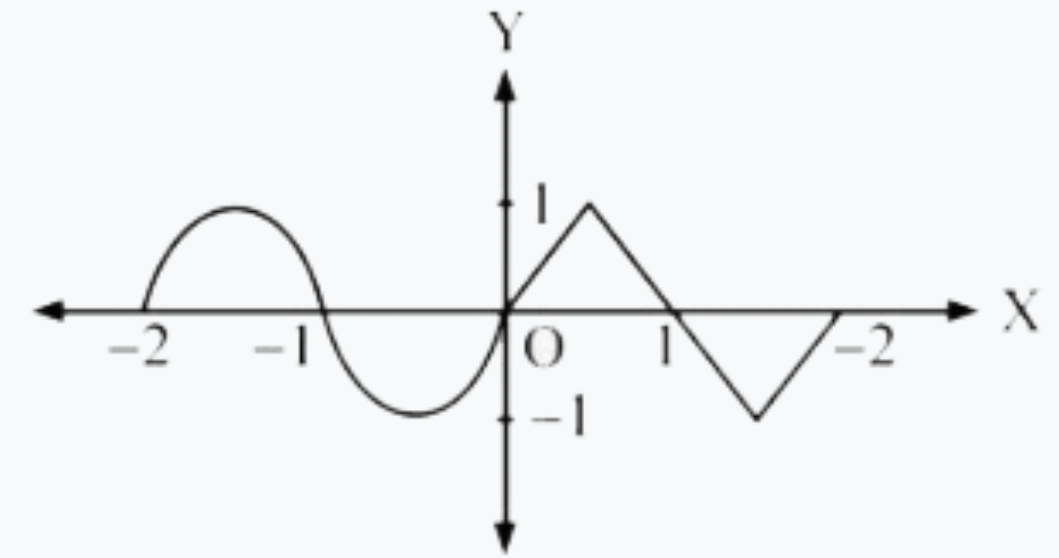
If the graph of the function y=f(x) is as shown : the graph of y=12(|f(x)|−f(x)) is
Step by step video & image solution for If the graph of the function y = f(x) is as shown : the graph of y = 1/2( |f(x)| - f(x)) is by Maths experts to help you in doubts & scoring excellent marks in Class 12 exams.
Updated on:21/07/2023Similar Questions
The graph of the function y=f(x) is shown.
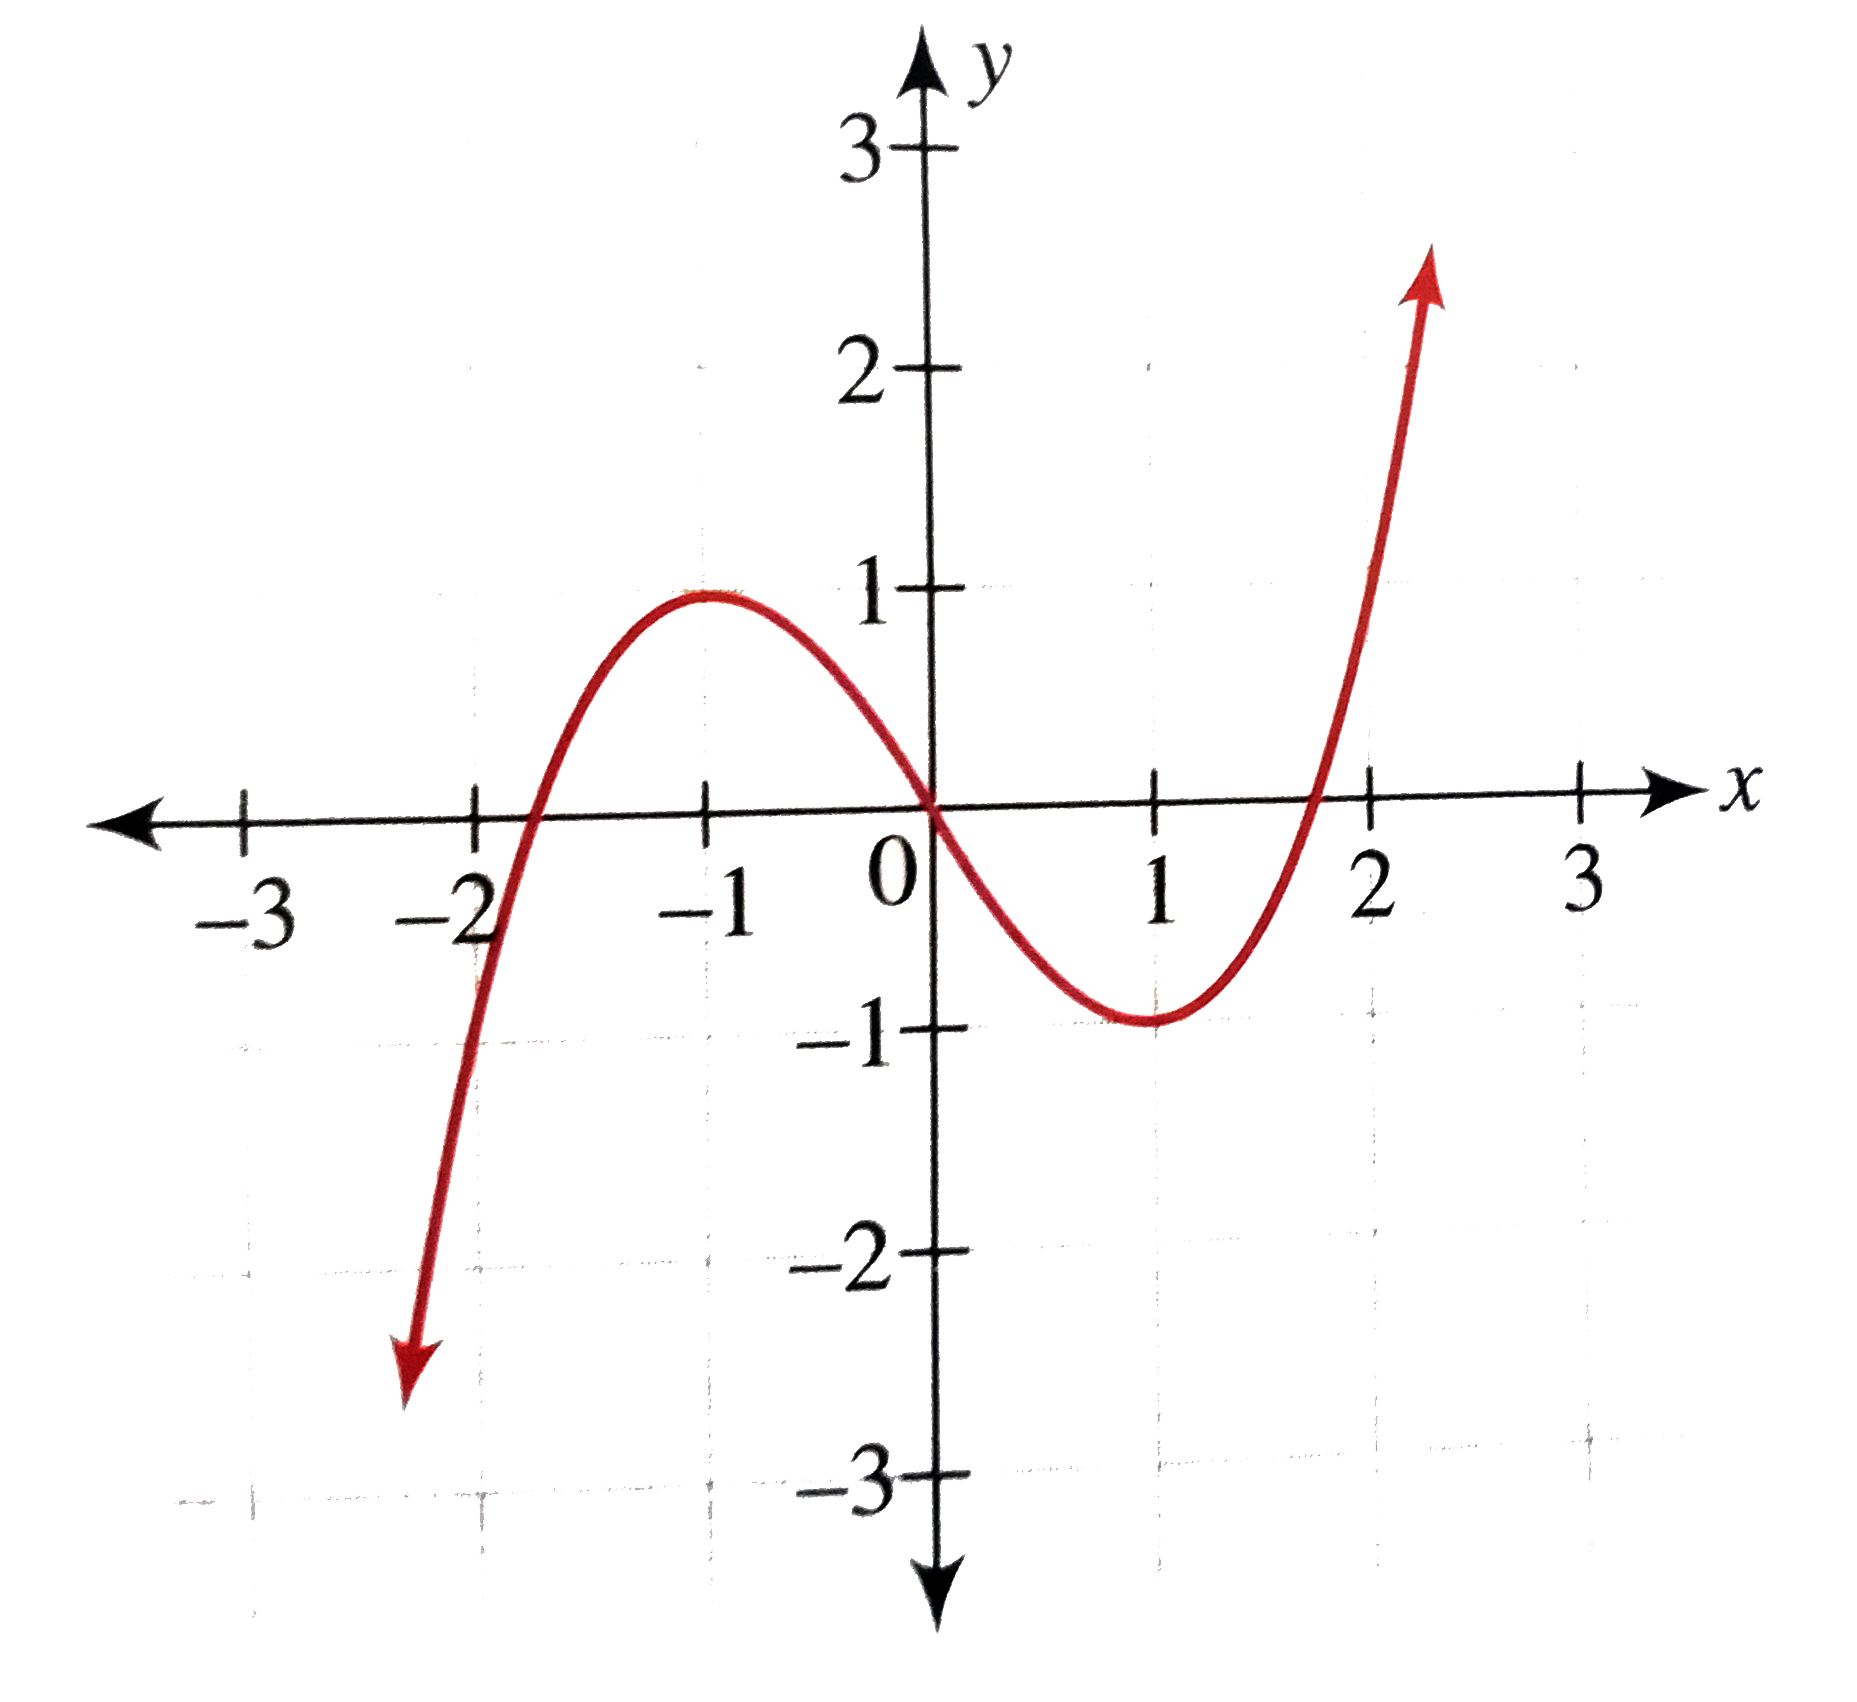
Find the number of solutions to the equation ||f(x)|−1|=12.
View SolutionThe graph of the function y=f(x) is as shown in the figure.
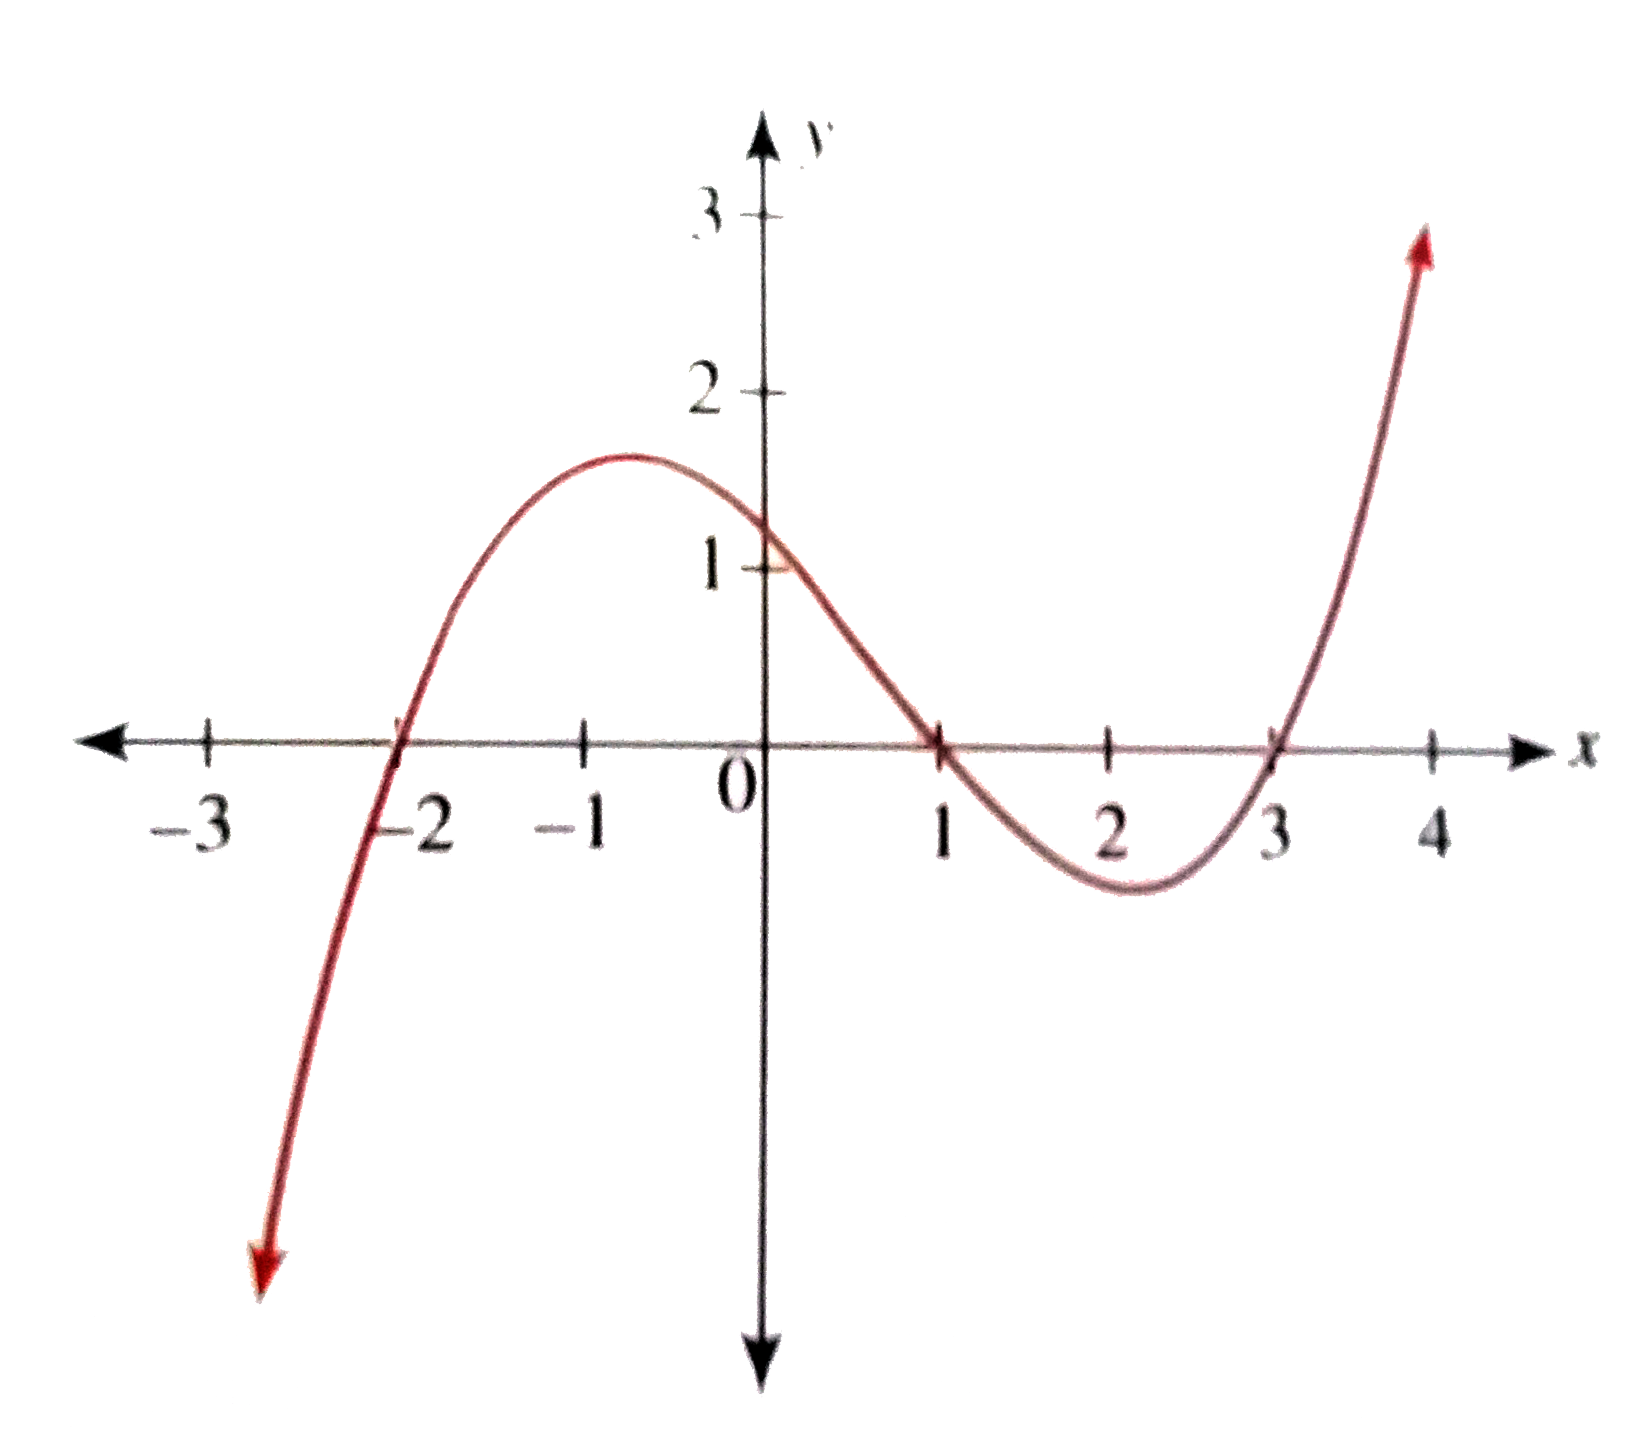
Then draw the graphs of
(i) |y|=sgn(f(x)) (ii) |y|=|f(x∣)|
(iii) y=xsgn(f(x))
View SolutionThe graph of y=f''(x) for a function f is shown.
Number of points of inflection for y=f(x) is….. .

View SolutionIf the graph of the function y=f(x) is as shown :
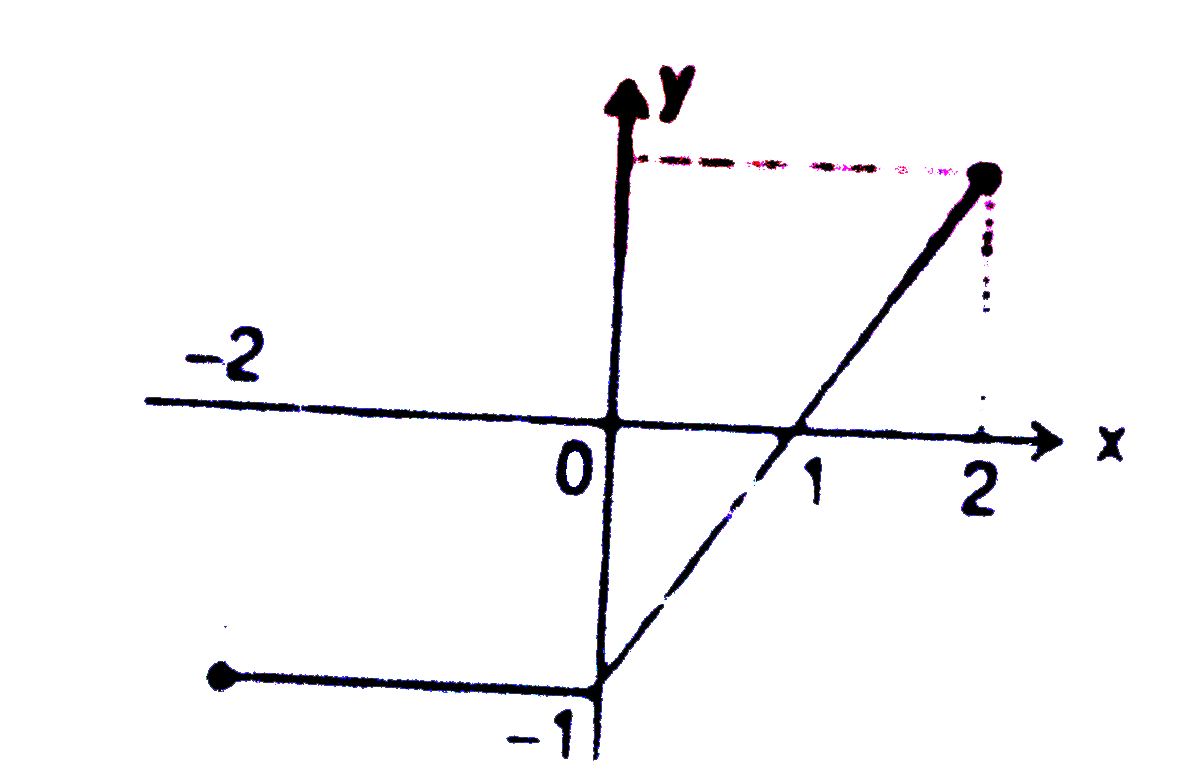
The graph of y=1/2(|f(x)|−f(x)) is
View SolutionThe graph of y=f(x) is given below
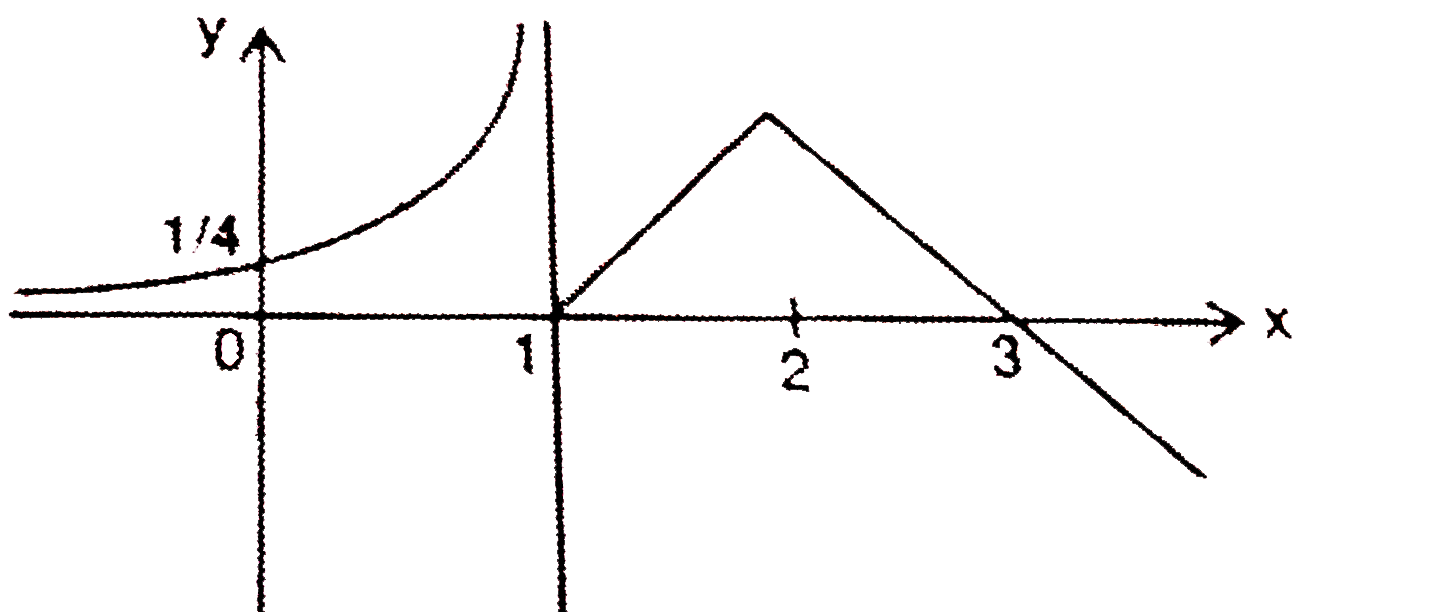
then the graph y=|f(|x|)| is :
View SolutionThe graph y = f (x) is as shown:
The graph of y = f (–|x|) is:
View SolutionThe graph of the function y=f(x). Then which of the following curve represent the graph of the function y=|f(x)|
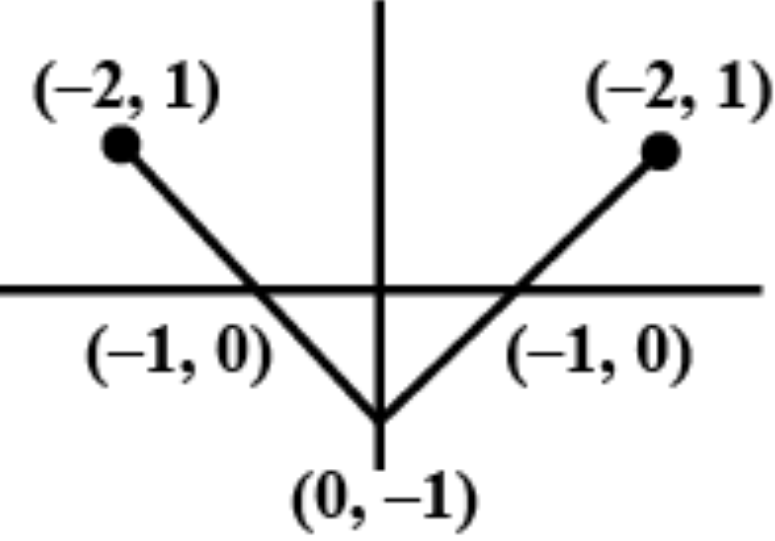
View SolutionIf the graph of the function y=f(x) is as shown :

the graph of y=12(|f(x)|−f(x)) is
View Solution
