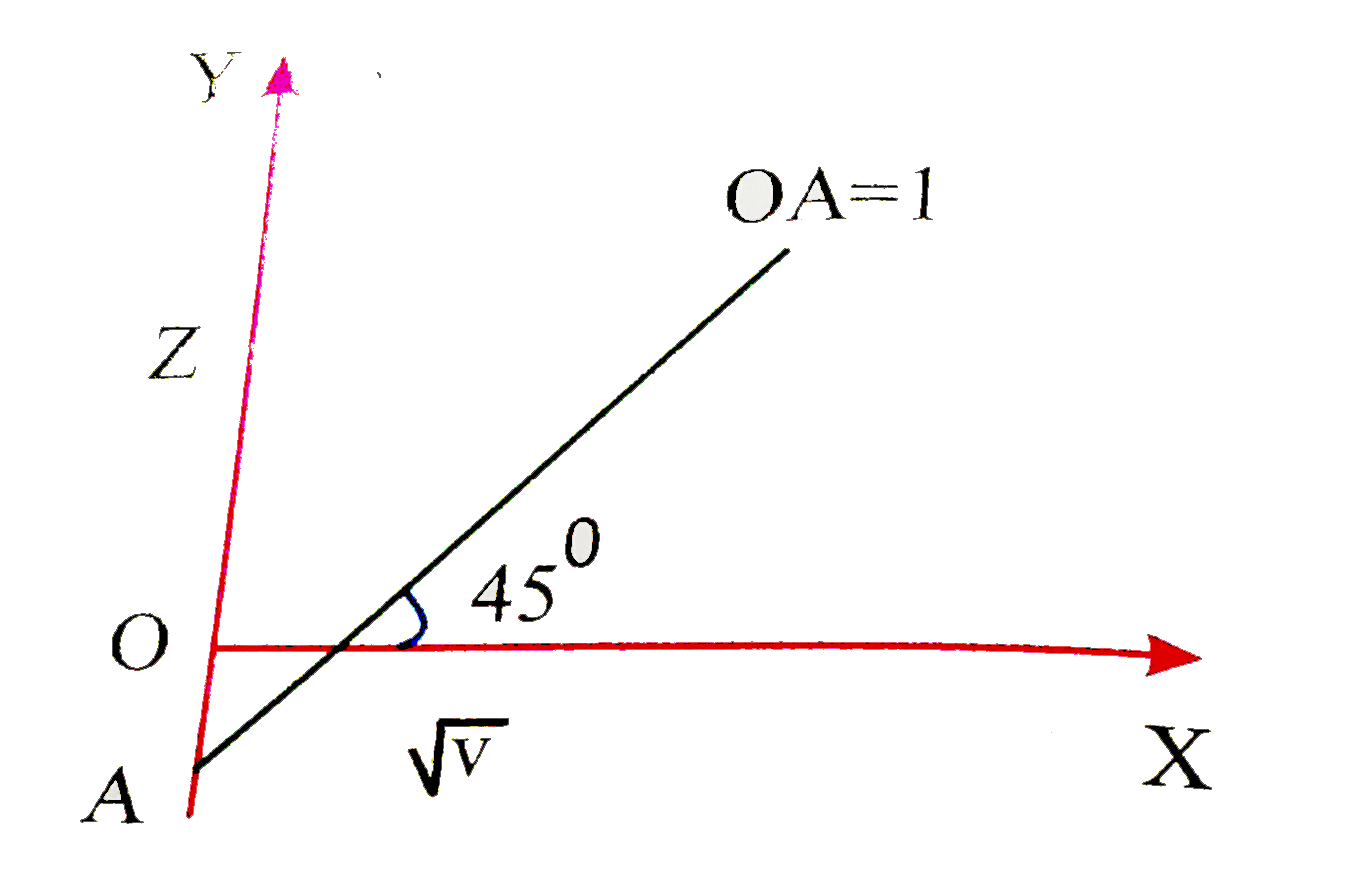
The plot of √v vs Z is
A
Straight line
B
Exponential curve
C
Hyperbolic
D
Curve with -ve slope
Video Solution
Text Solution
The correct Answer is:A
|
Answer
Step by step video, text & image solution for The plot of sqrt(v) vs Z is by Chemistry experts to help you in doubts & scoring excellent marks in Class 11 exams.
Updated on:21/07/2023
Topper's Solved these Questions
Similar Questions
Knowledge Check
- Question 1 - Select One
For a first order reaction, the plot of log[A]tvs t is linear with a
Apositive slope and zero interceptBpositive slope and non zero interceptCnegative slope and zero interceptDnegative slope and non zero intercept - Question 2 - Select One
For a zero order reaction, the slope in the plot of [R] vs. time is
A−k2.303B−kC+k2.303D+k - Question 3 - Select One
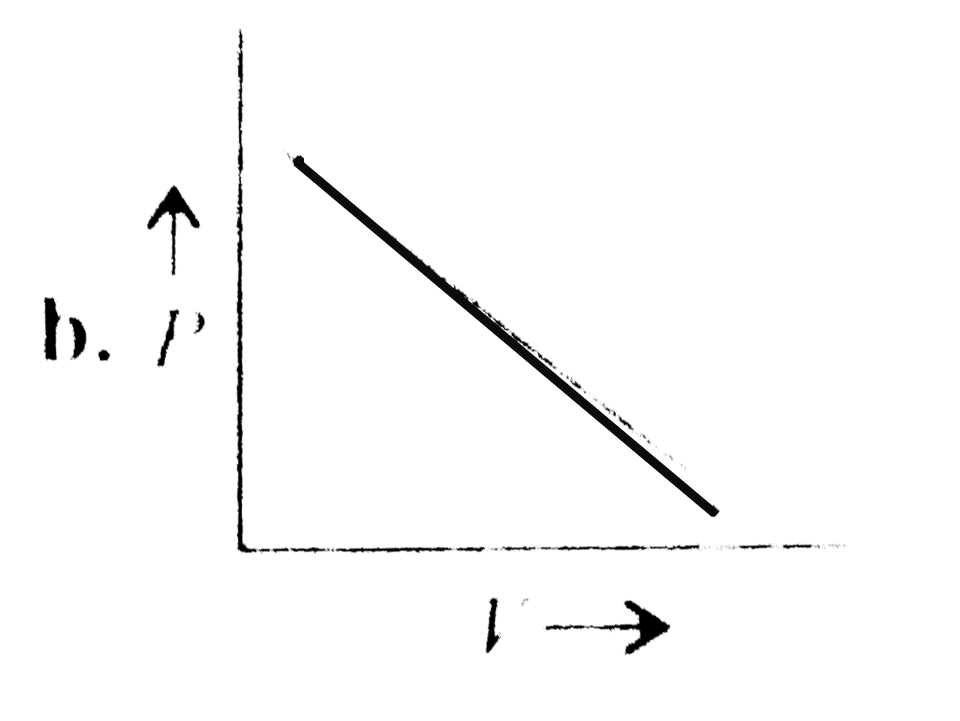
Among the plots of PvsV given below, which one corresponds to Boyle's law?
A B
B C
C D
D
For a zero order reaction,
(A) plot of [R0] vs time is a straight line
(B) plot of [R] vs time is a straight line
(C) plot of [R] vs time has slope =k
(D) plot of [R0] vs time has slope =−kView SolutionThe plot of PV vs P at particular temperature is called isovbar.
View SolutionWhich of the plots of ln K vs (1T) is/are correct?
View SolutionThe plot of log k vs 1/T helps to calculate
View SolutionThe frequency of the characterstic X ray of Kα line of metal targent 'M' is 2500cm−1 and the graoh between √v Vs 'z' is as follows, then atomic number of M is
 View Solution


