A body moves with uniform acceleration, which of the following graph is correct?
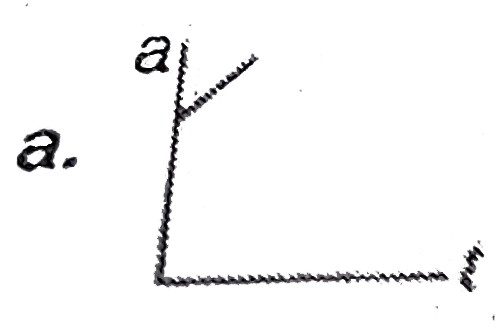
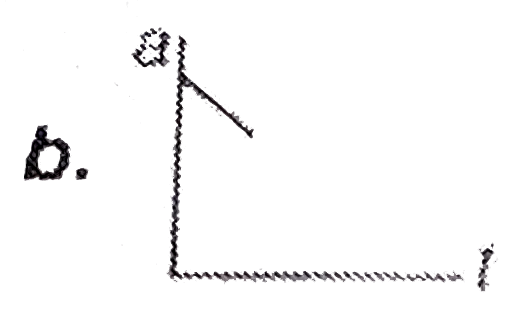
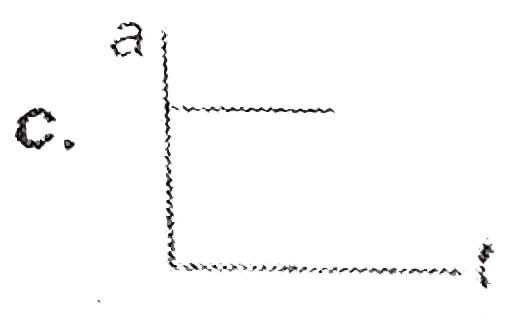
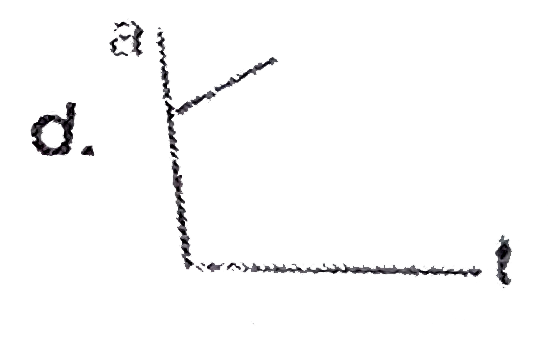
To determine which graph represents a body moving with uniform acceleration, we can follow these steps:
Step 1: Understand Uniform Acceleration
Uniform acceleration means that the body’s velocity changes by equal amounts in equal intervals of time. This implies that the acceleration is constant.
Step 2: Analyze the Relationship Between Velocity and Time
For an object moving with uniform acceleration, the velocity-time graph will be a straight line. This is because the change in velocity is constant over time.
Step 3: Identify the Graphs
We need to look at the options provided and identify which graph shows a straight line when plotting velocity (y-axis) against time (x-axis).
Step 4: Evaluate the Options
- If a graph shows a straight line with a positive slope, it indicates uniform acceleration.
- If a graph shows a curve or a line with varying slope, it indicates changing acceleration (non-uniform).
Step 5: Conclusion
The correct graph for uniform acceleration is the one that is a straight line on the velocity vs. time graph.
Final Answer
The correct graph representing uniform acceleration is the one that shows a straight line when plotting velocity against time.
---
Uniform acceleration means that the body’s velocity changes by equal amounts in equal intervals of time. This implies that the acceleration is constant.
For an object moving with uniform acceleration, the velocity-time graph will be a straight line. This is because the change in velocity is constant over time.
We need to look at the options provided and identify which graph shows a straight line when plotting velocity (y-axis) against time (x-axis).
- If a graph shows a straight line with a positive slope, it indicates uniform acceleration.
- If a graph shows a curve or a line with varying slope, it indicates changing acceleration (non-uniform).
The correct graph for uniform acceleration is the one that is a straight line on the velocity vs. time graph.
The correct graph representing uniform acceleration is the one that shows a straight line when plotting velocity against time.
Topper's Solved these Questions
Similar Questions
Knowledge Check
- Question 1 - Select One
A body moves with uniform acceleration, which of the following graph is correct?
A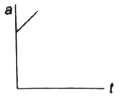 B
B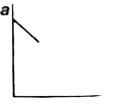 C
C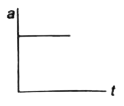 D
D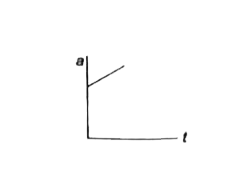
- Question 2 - Select One
A body moves from rest with a constant acceleration. Which one of the following graphs represents the variation of its kinetic energy K with the distance travelled x?
A B
B C
C D
D
- Question 3 - Select One
A body moves from rest with a constant acceleration. Which one of the following graphs represents the variation of its kinetic energy K with the distance travelled x?
A B
B C
C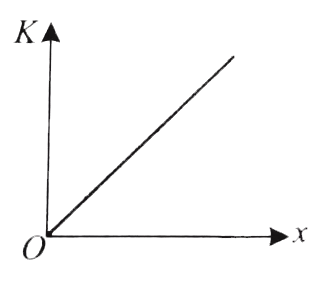 D
D
A body starting from the the rest moves along a straight line with constant acceleration. Which one of the following graphs represents the variation of speed(v) and distance(s)?
View SolutionA body starting from the rest moves along a straight line with constant acceleration .Which one of the following graphs represent the variation of speed (v) and distance (s) ?
View SolutionWhen a body moves with uniform velocity then
View SolutionAssertion : The displacement-time graph of a body moving with uniform acceleration is a straight line.
Reason : The displacement is proportional to time for uniformly accelerated motion.View SolutionA body moves with uniform velocity. Which of the graphs shown here is a graph of velocity against time for this motion?
View Solution

