A body starting from the rest moves along a straight line with constant acceleration .Which one of the following graphs represent the variation of speed (v) and distance (s) ?


The correct Answer is:c
Similar Questions
A body moves from rest with a constant acceleration. Which one of the following graphs represents the variation of its kinetic energy K with the distance travelled x?
View SolutionA body moves from rest with a constant acceleration. Which one of the following graphs represents the variation of its kinetic energy K with the distance travelled x?
View Solution
Knowledge Check
A body starting from the the rest moves along a straight line with constant acceleration. Which one of the following graphs represents the variation of speed(v) and distance(s)?
A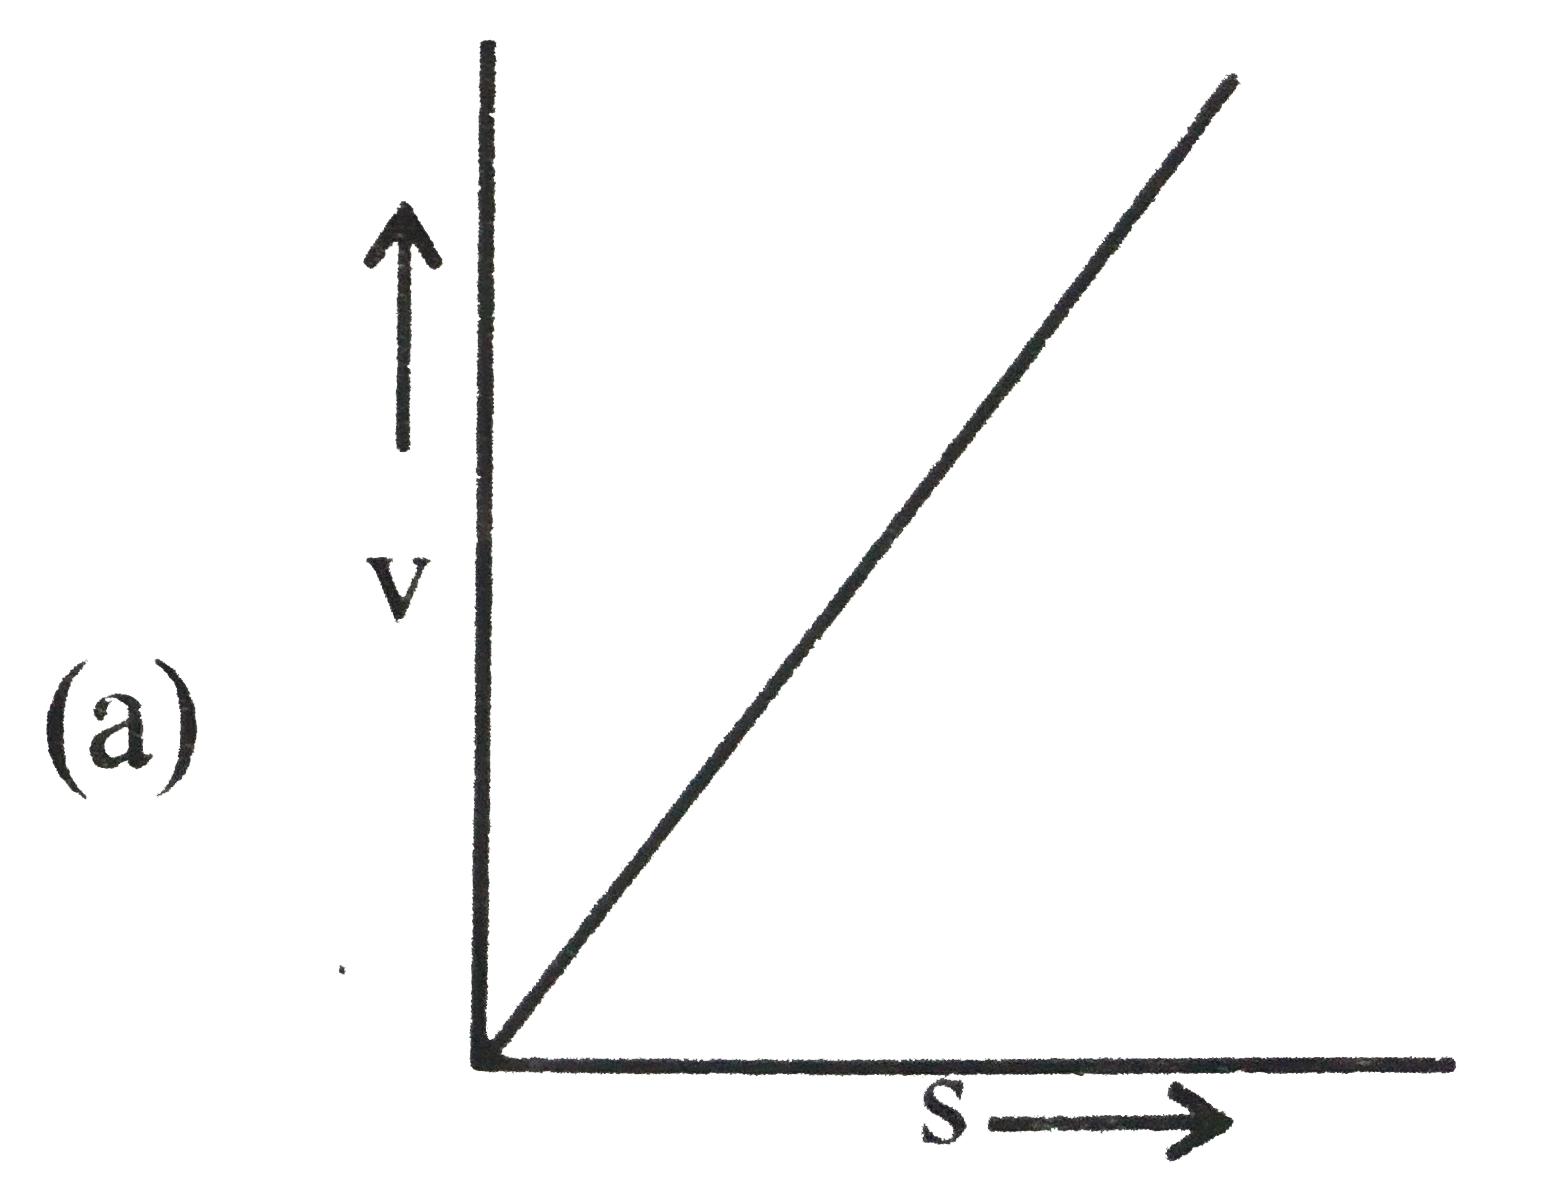 B
B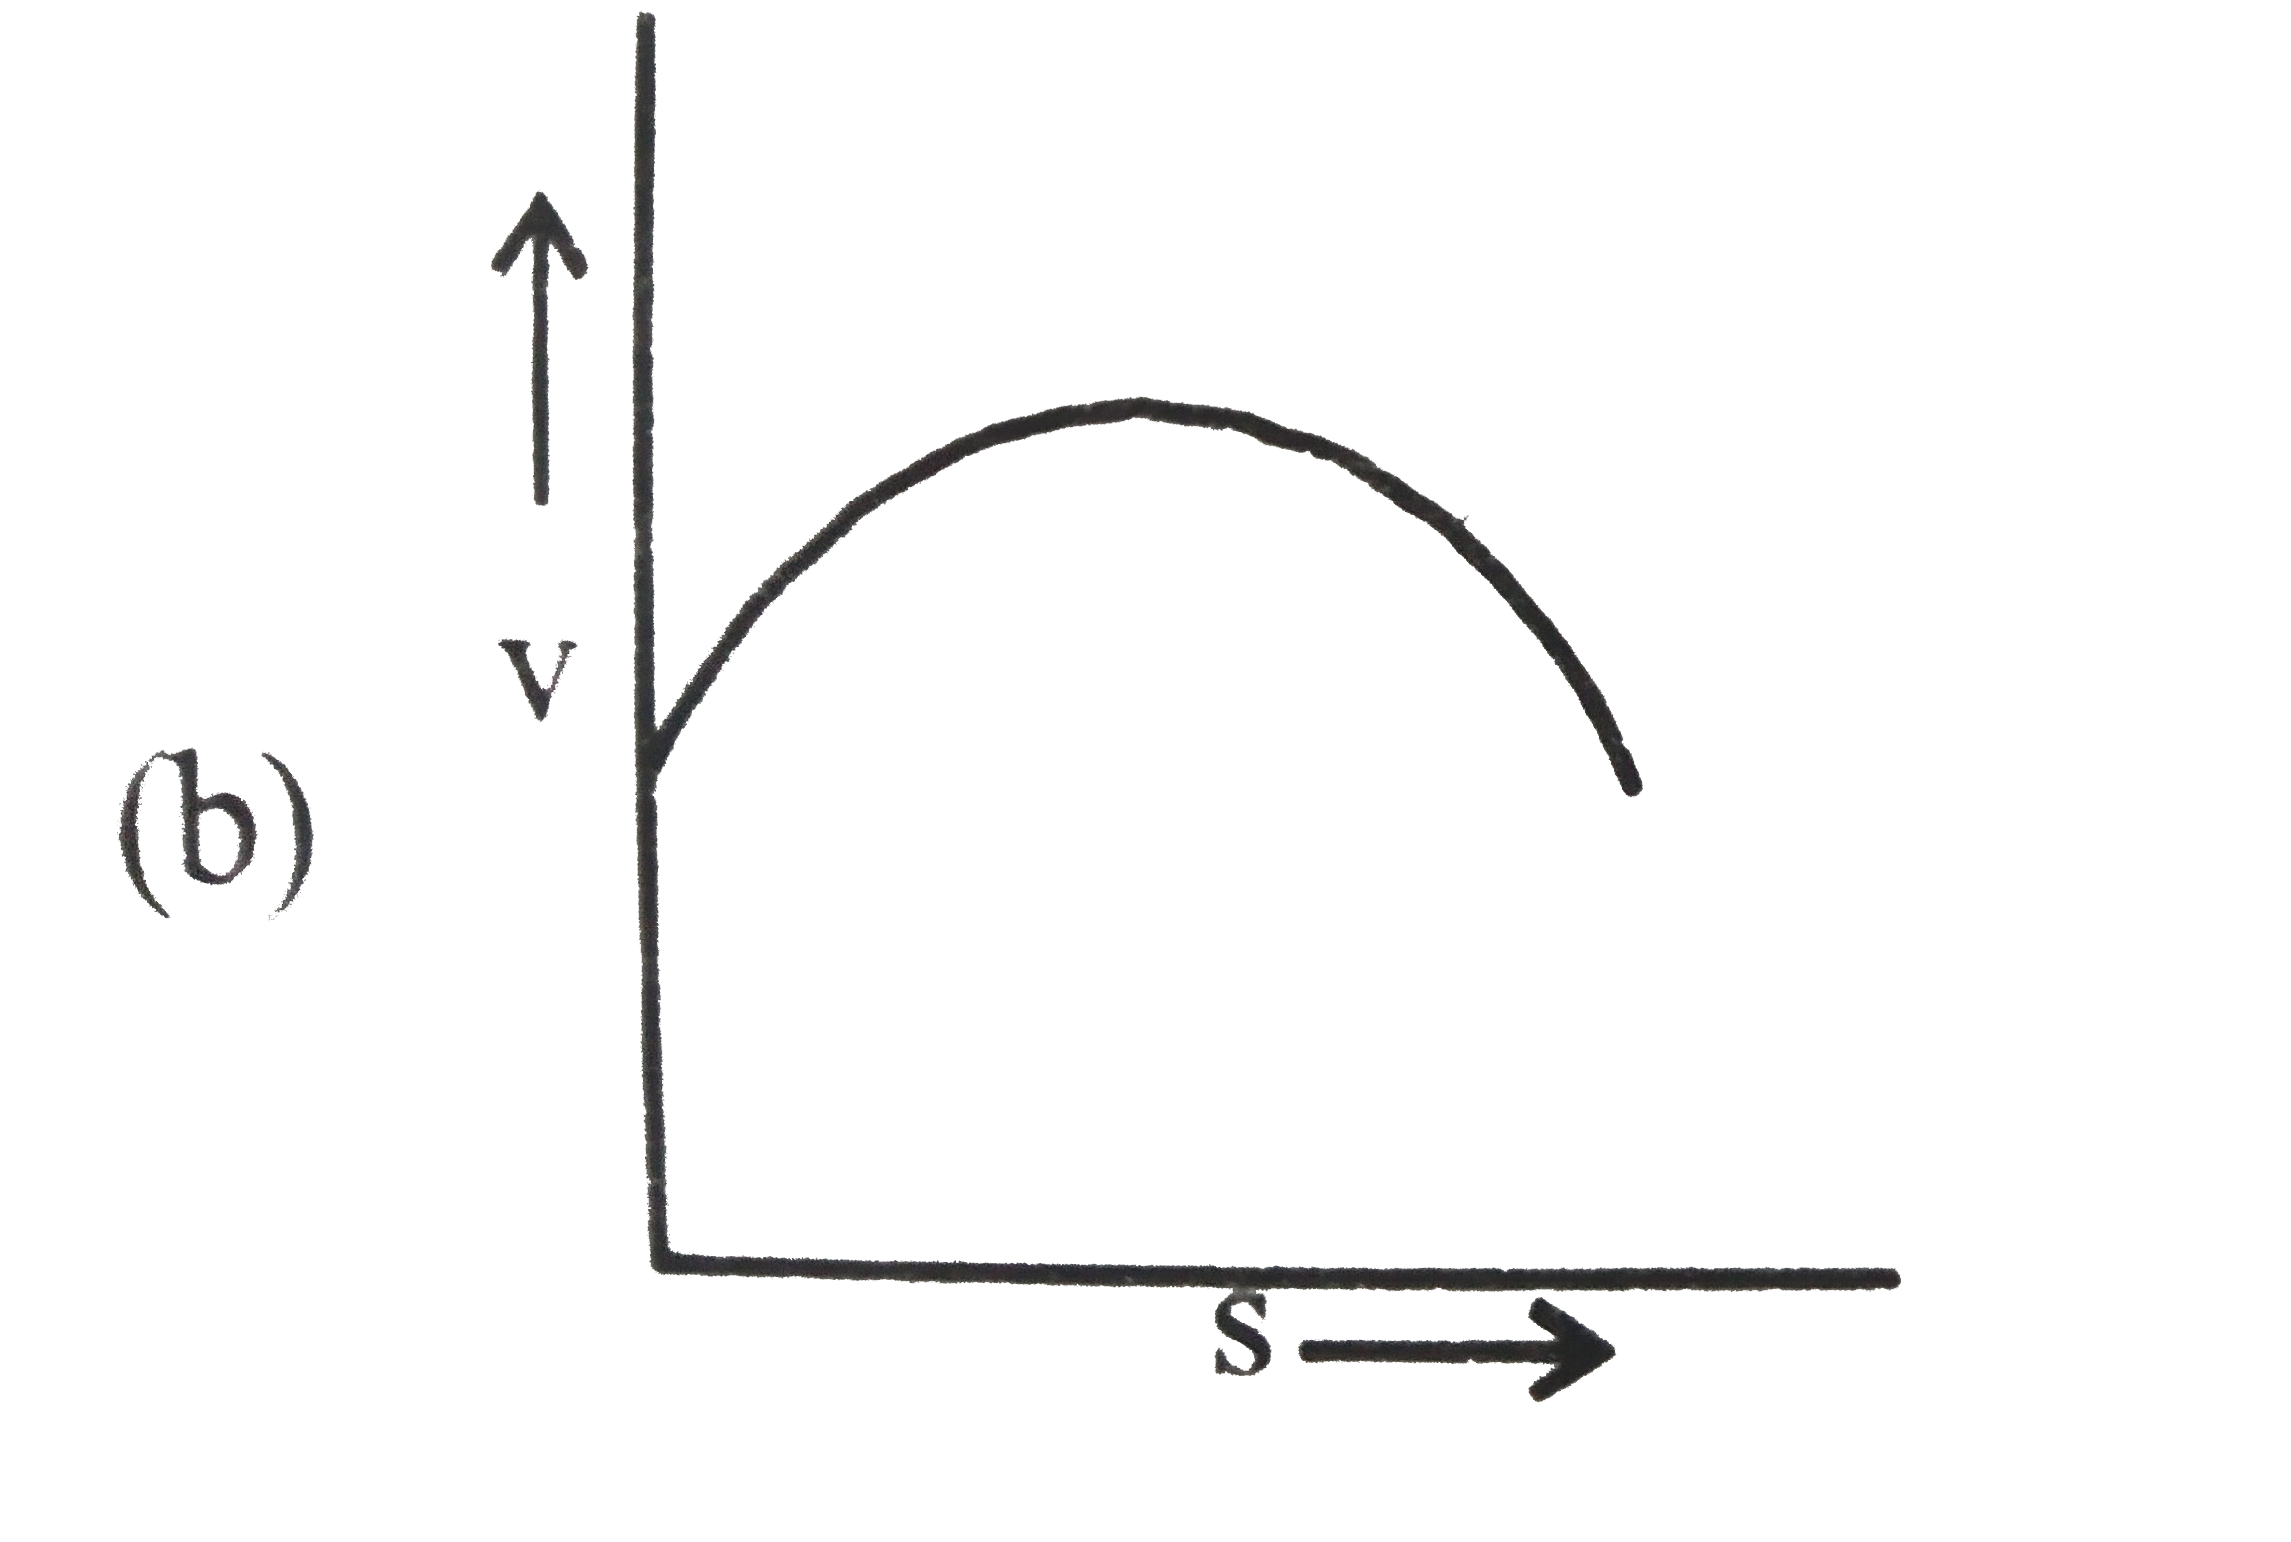 C
C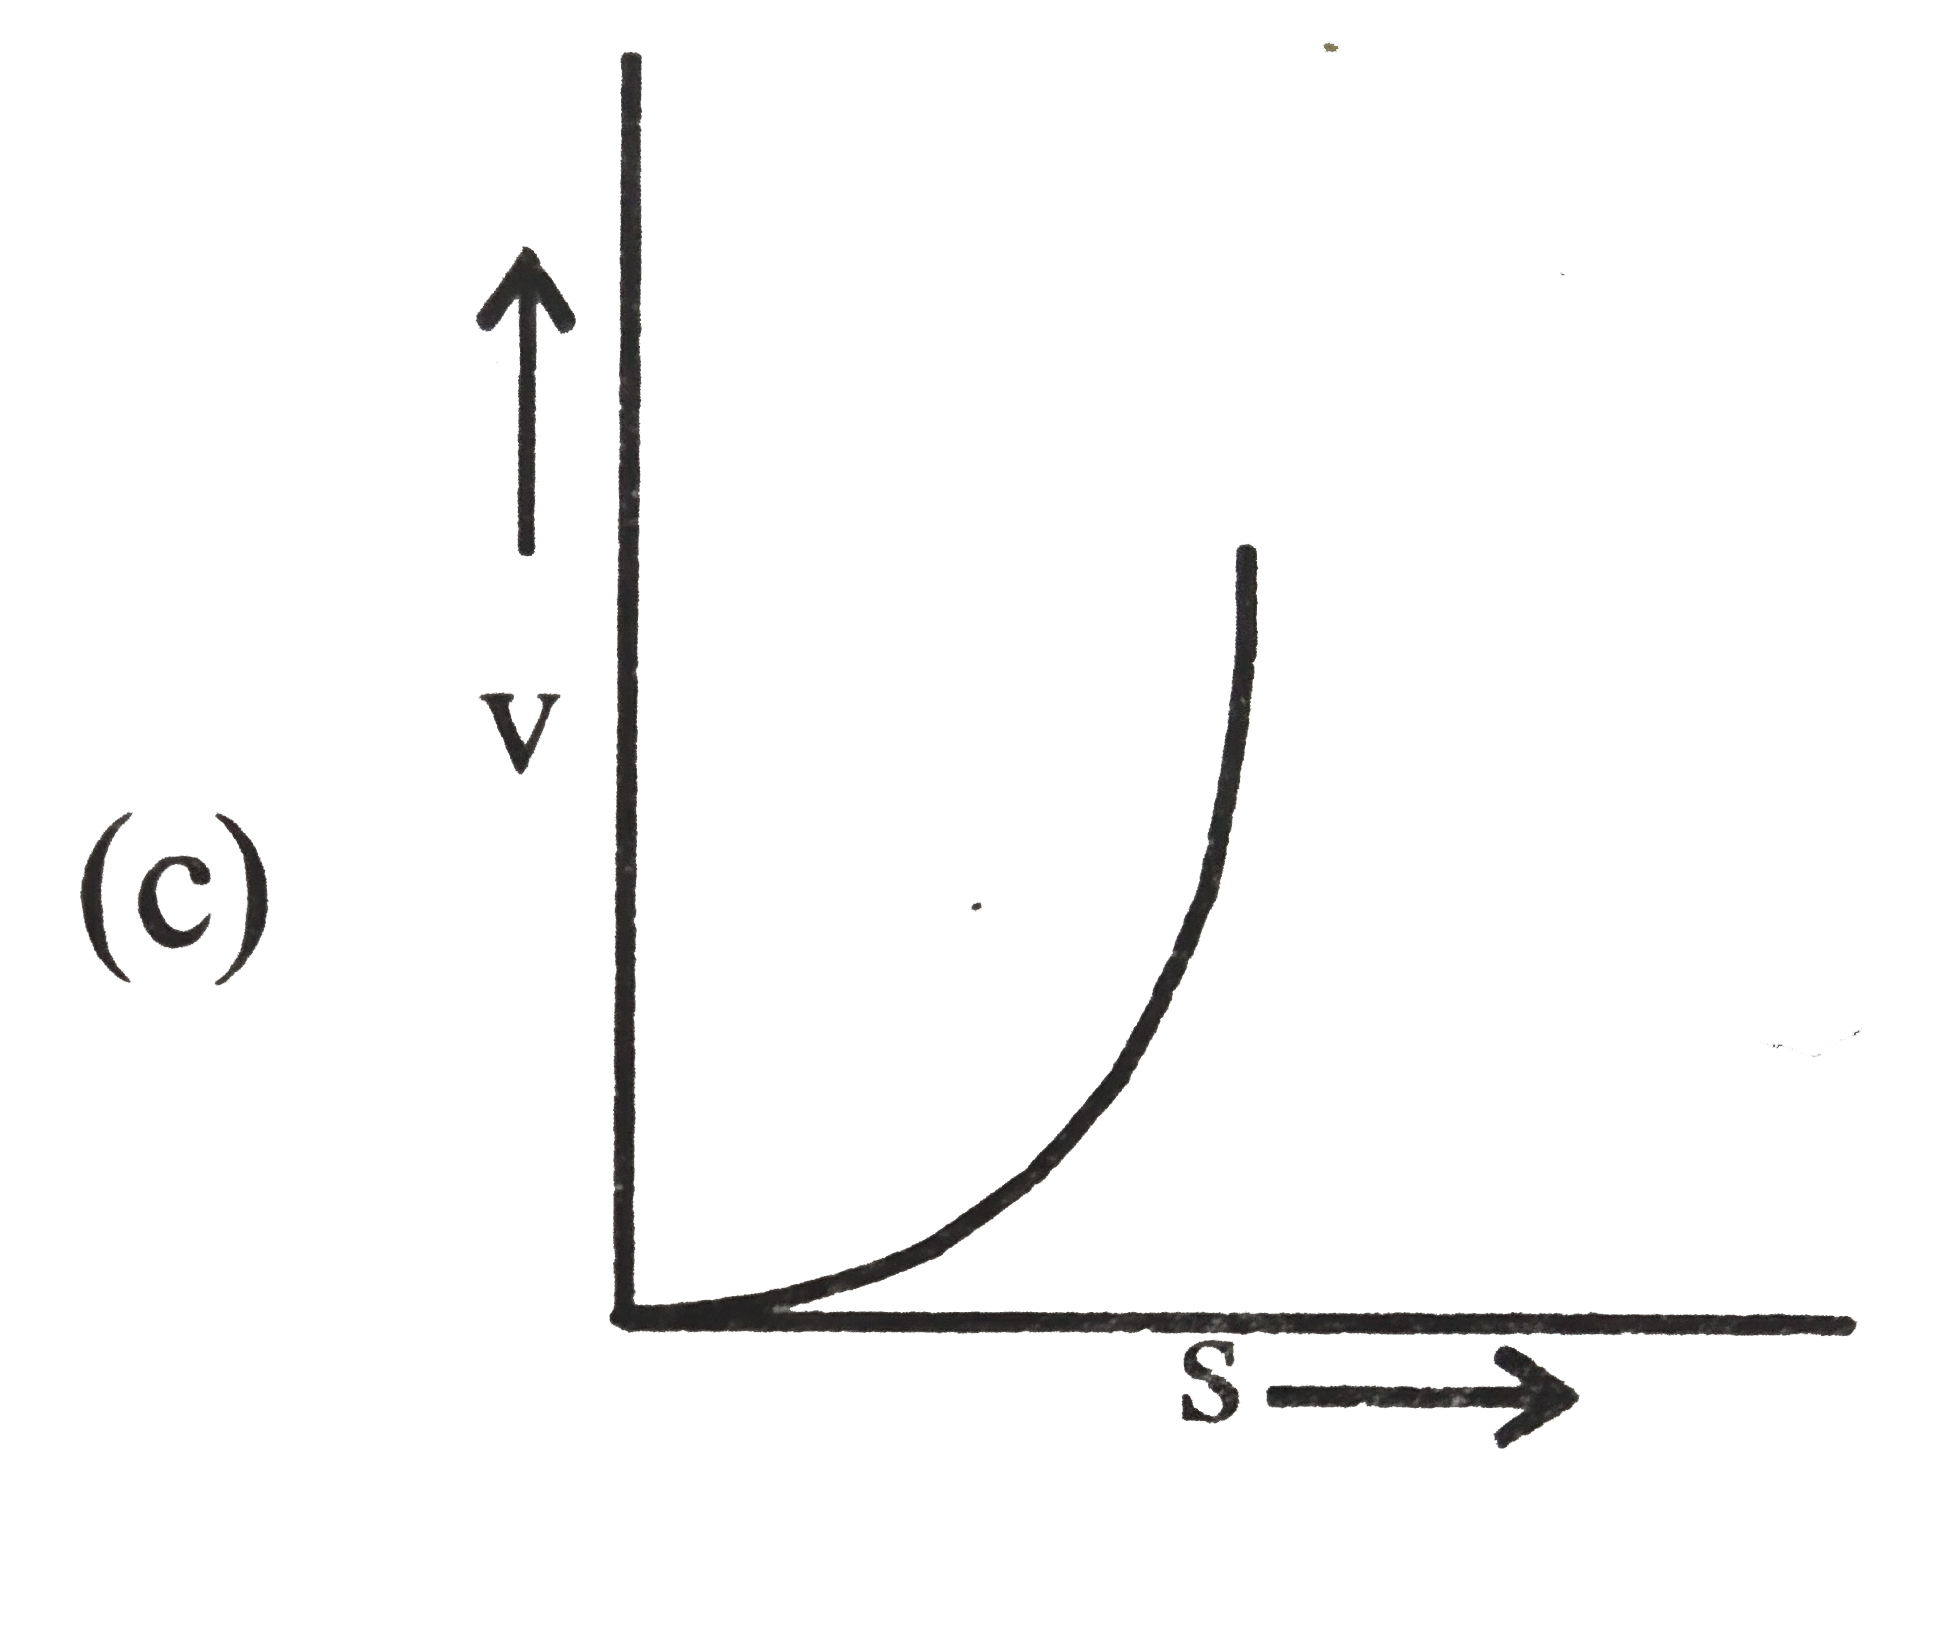 D
D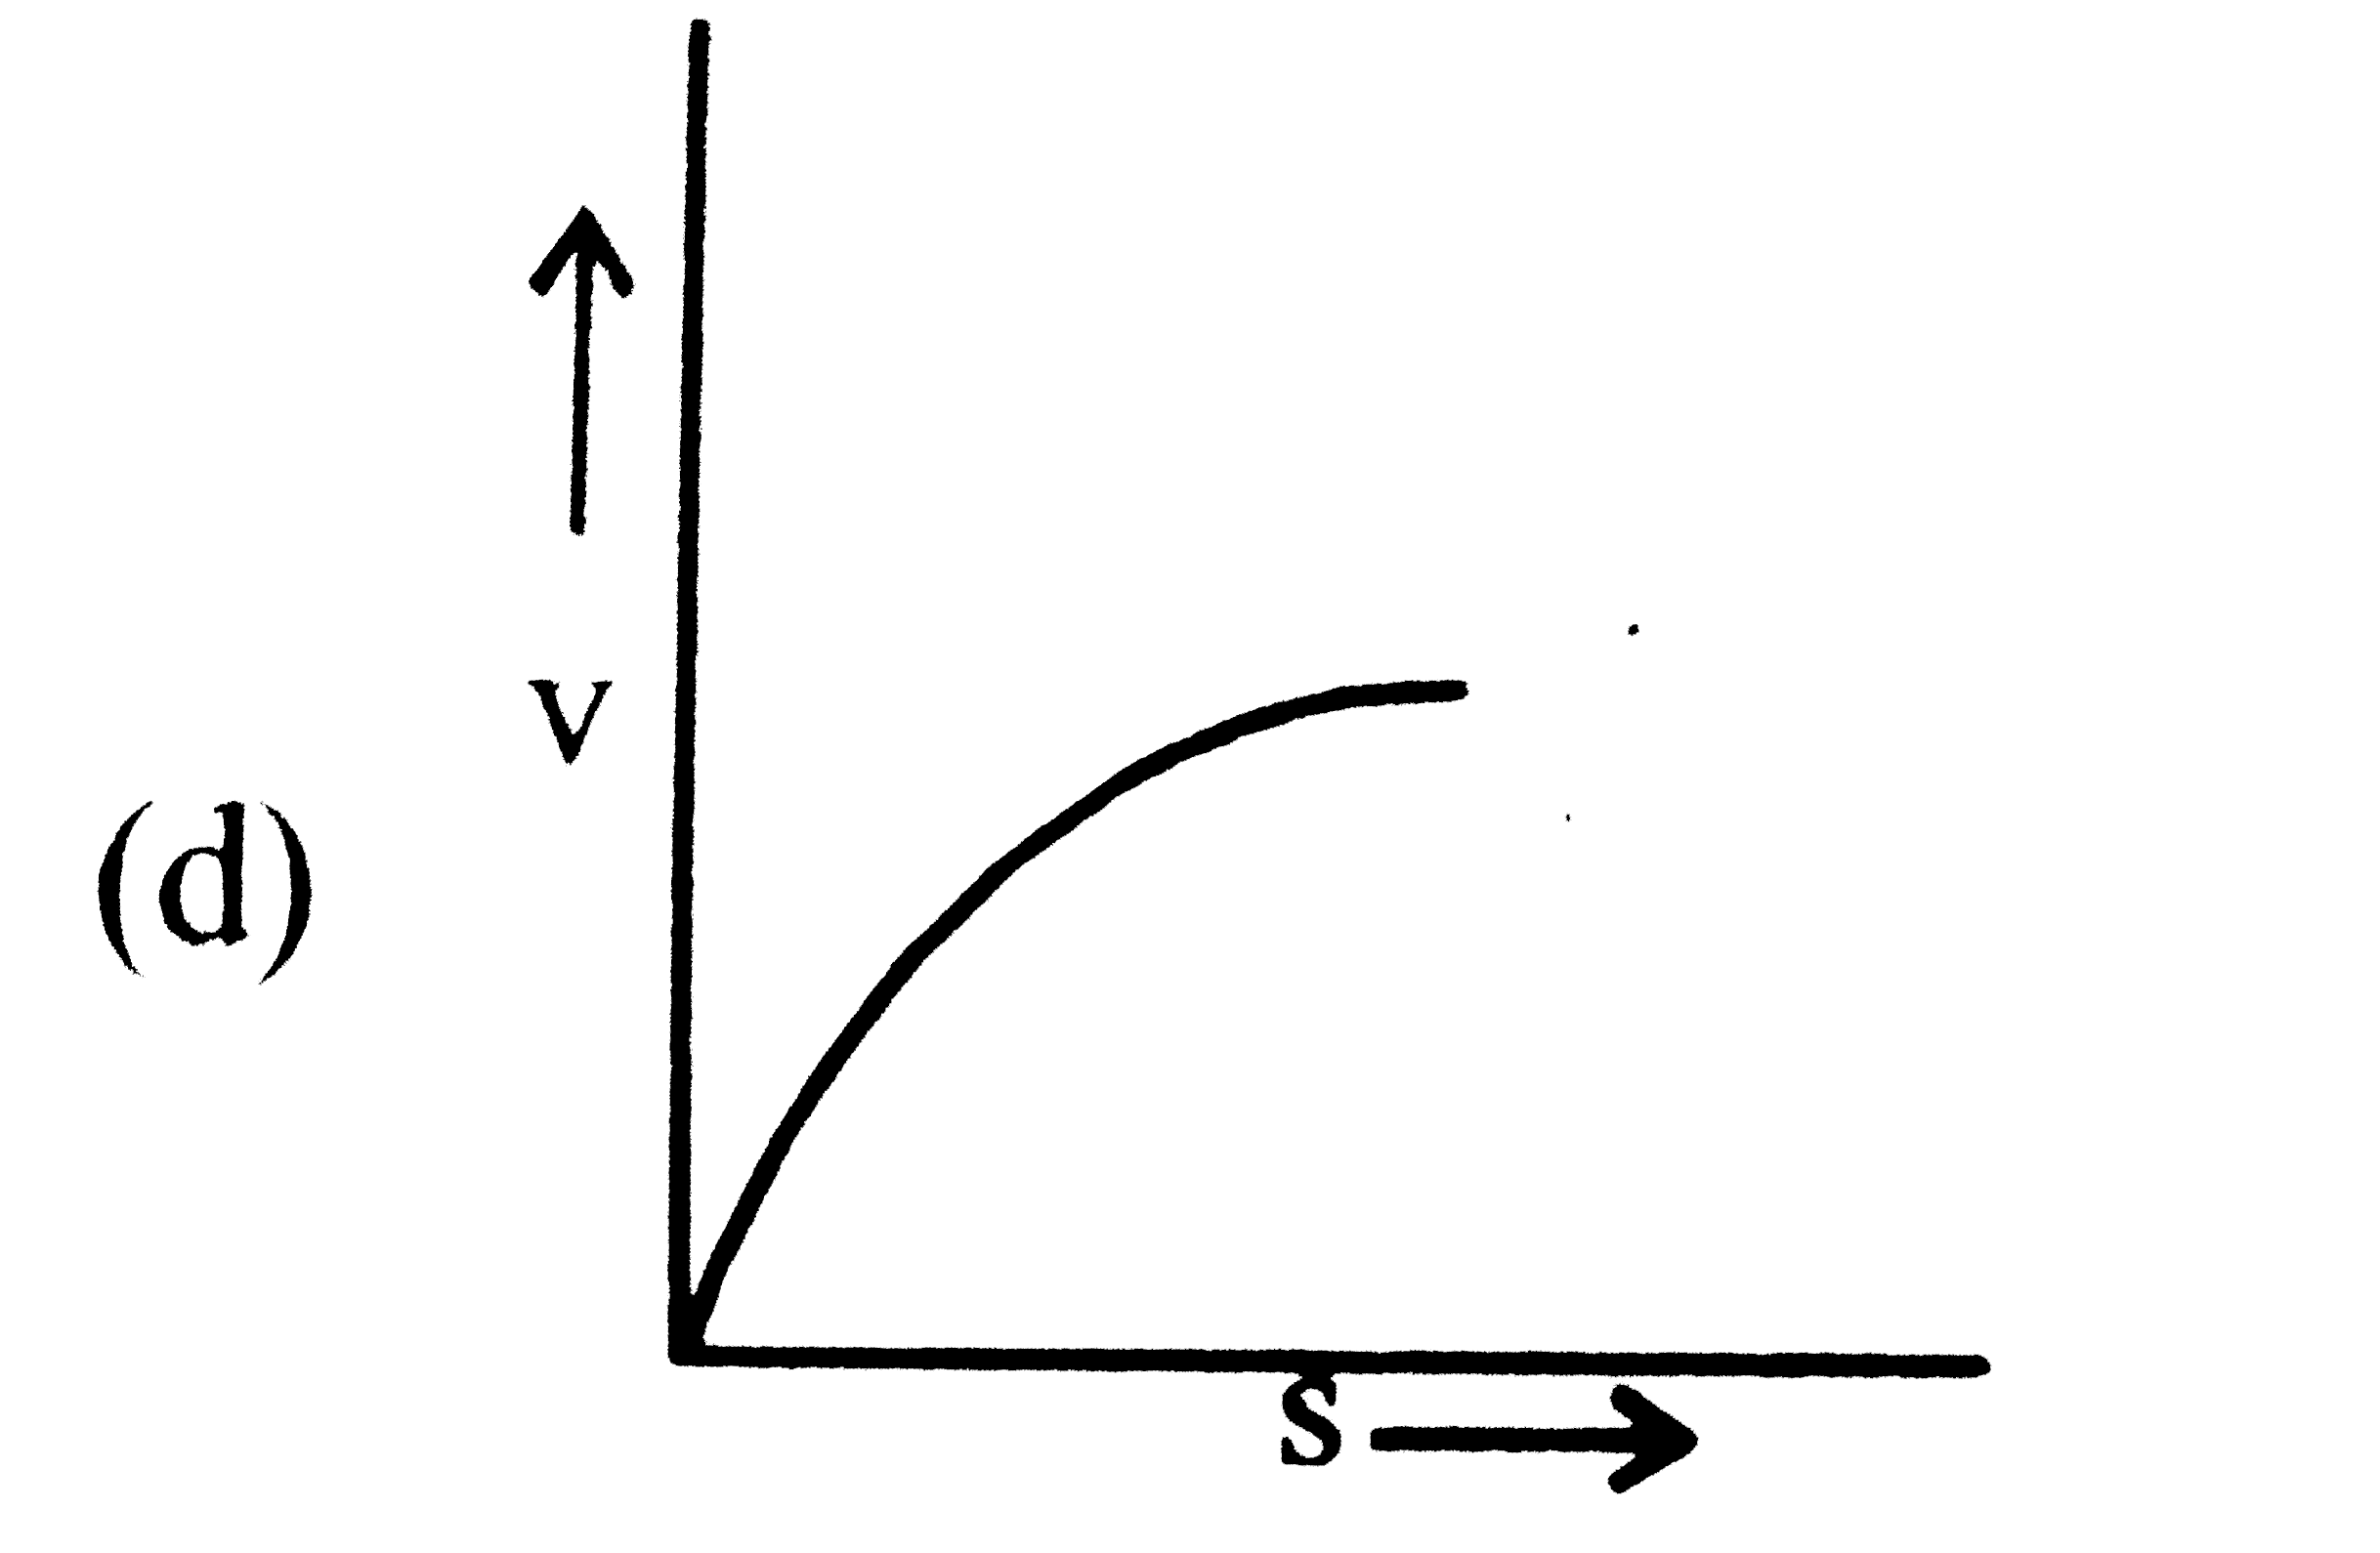
A body moves from rest with a constant ac- celeration. Which of the following graphs represents the variation of its kinetic energy (E) with distance travelled (x)?
A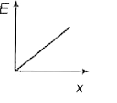 B
B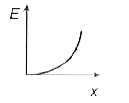 C
C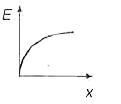 D
D
A body moves from rest with a constant acceleration. Which one of the following graphs represents the variation of its kinetic energy K with the distance travelled x?
A B
B C
C D
D
A body starting from rest moves along a straight line with a constant acceleration. The variation of speed (v) with distance (s) is represented by the graph:
View SolutionA body moves from rest with a constant acceleration. Which one of the following graphs represents the variation of its kinetic energy K with the distance travelled x?
View SolutionA body starting from rest moves along a straight line with a constant acceleration. The variation of speed (v) with distance (s) is represented by the graph
View SolutionA body starting from rest moves along a straight line with a constant acceleration. The variation of speed (v) with distance (s) is represented by the graph
View SolutionA body starting from rest moves along a string line with a constant acceleration The variation of speed (v) with distance (s) is repressed by the graph
View Solution
