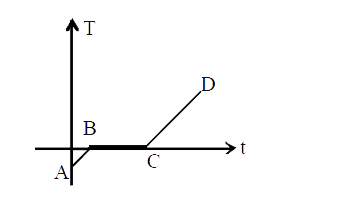
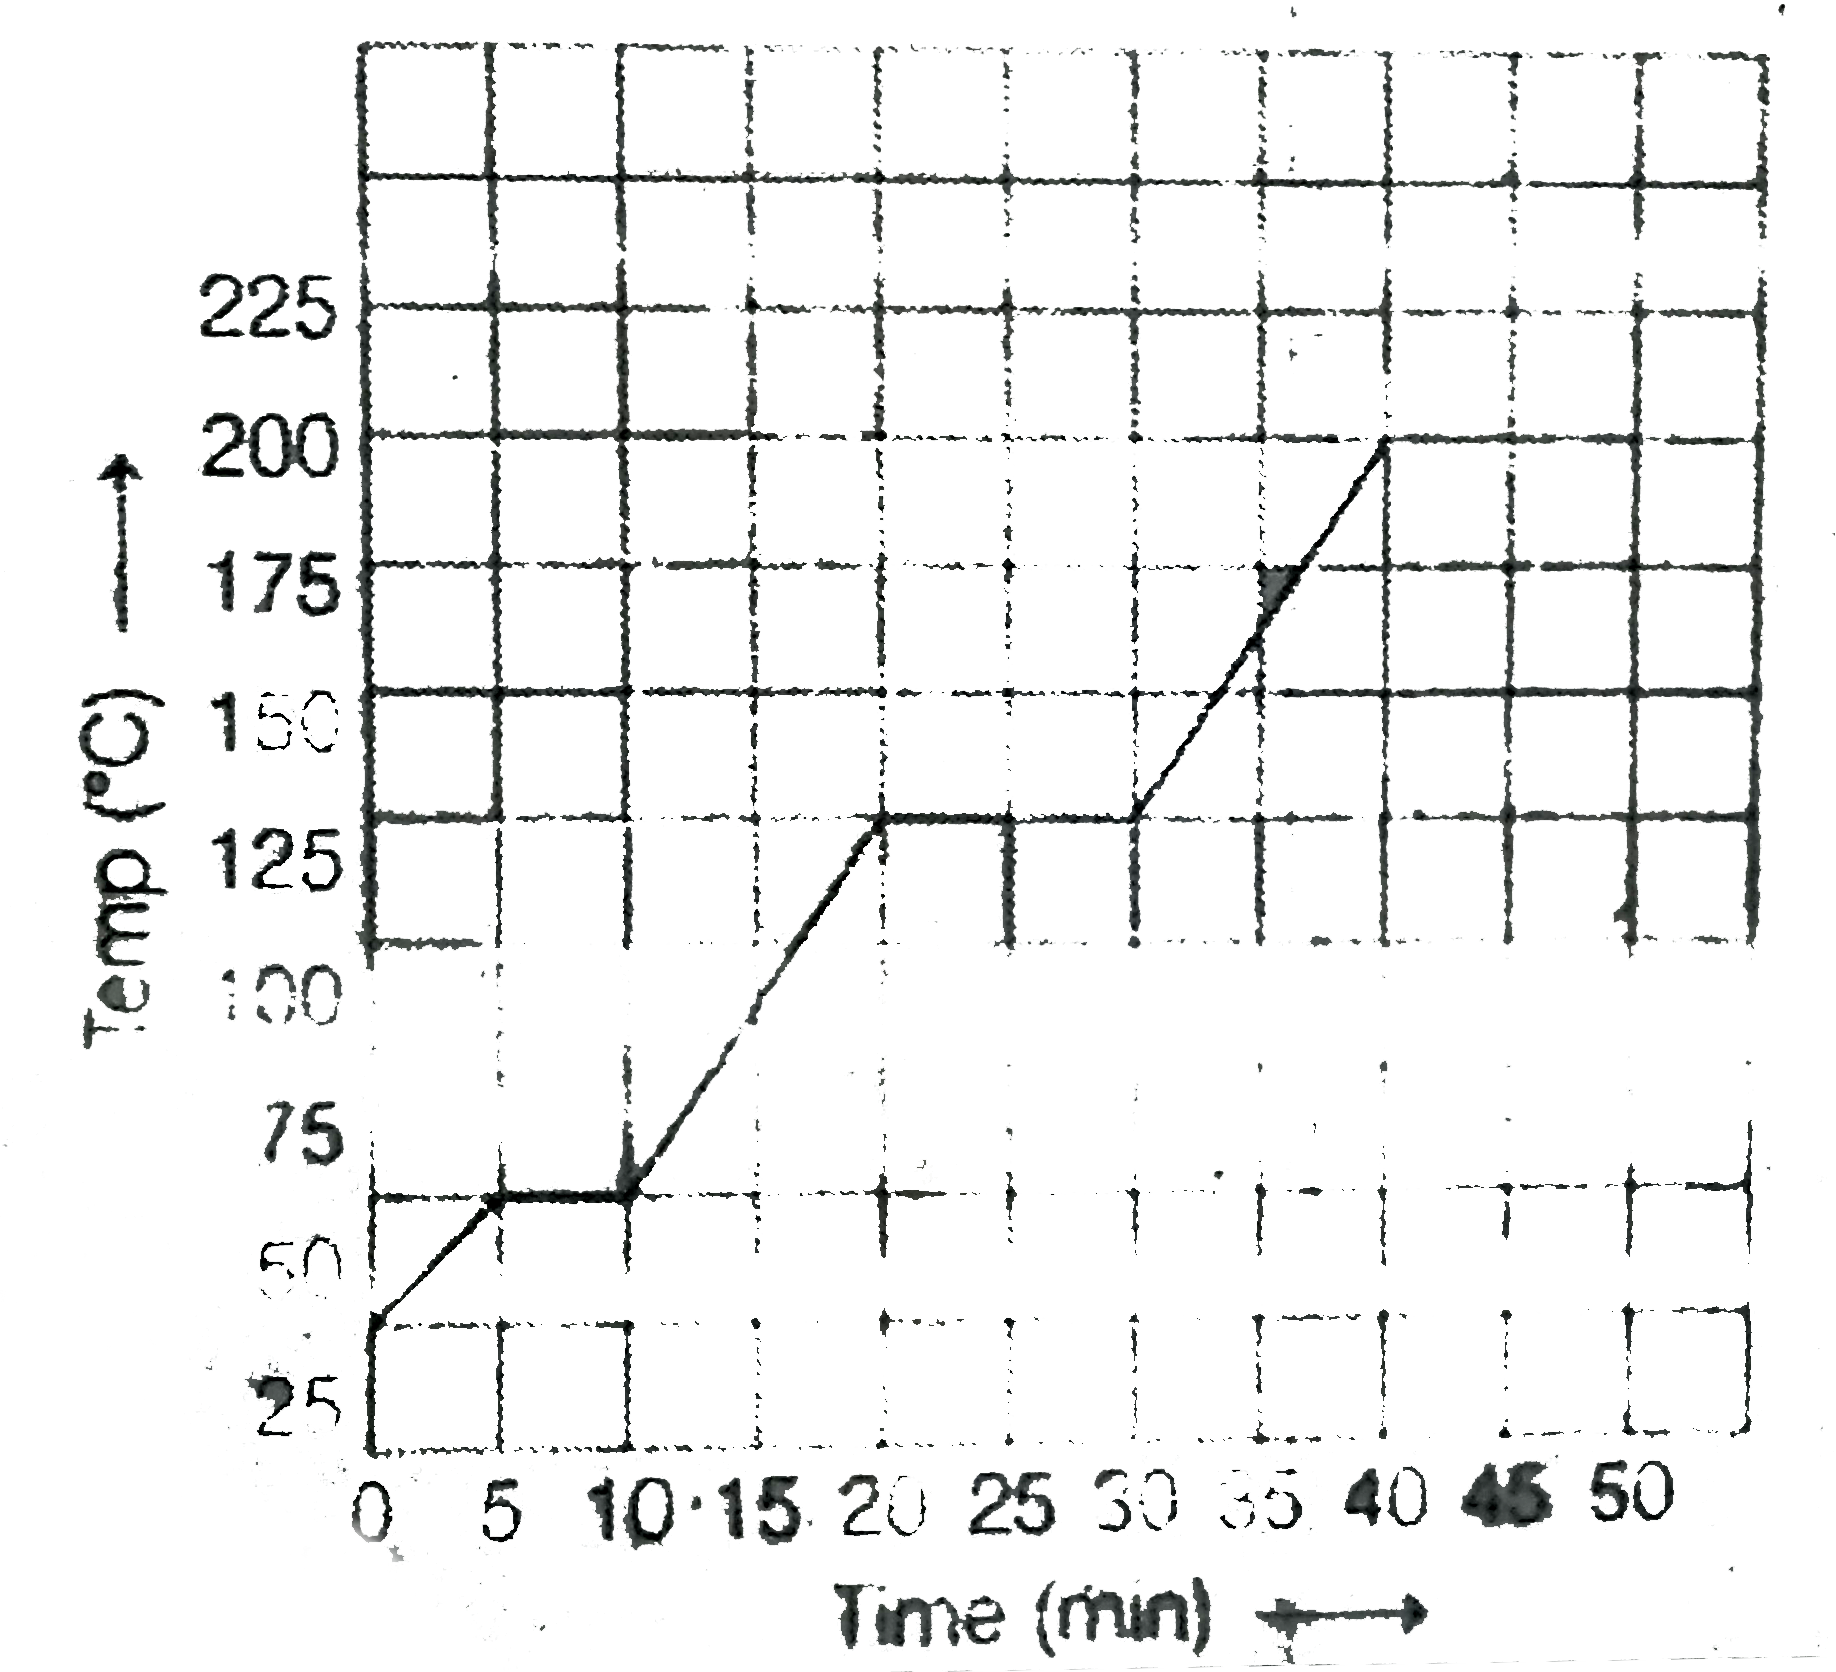
The following figure represents the temperature versus time plot for a given amount of a substance when heat energy is supplied to it at a fixed rate and at a constant pressure. Which part of plot represent a phase change?
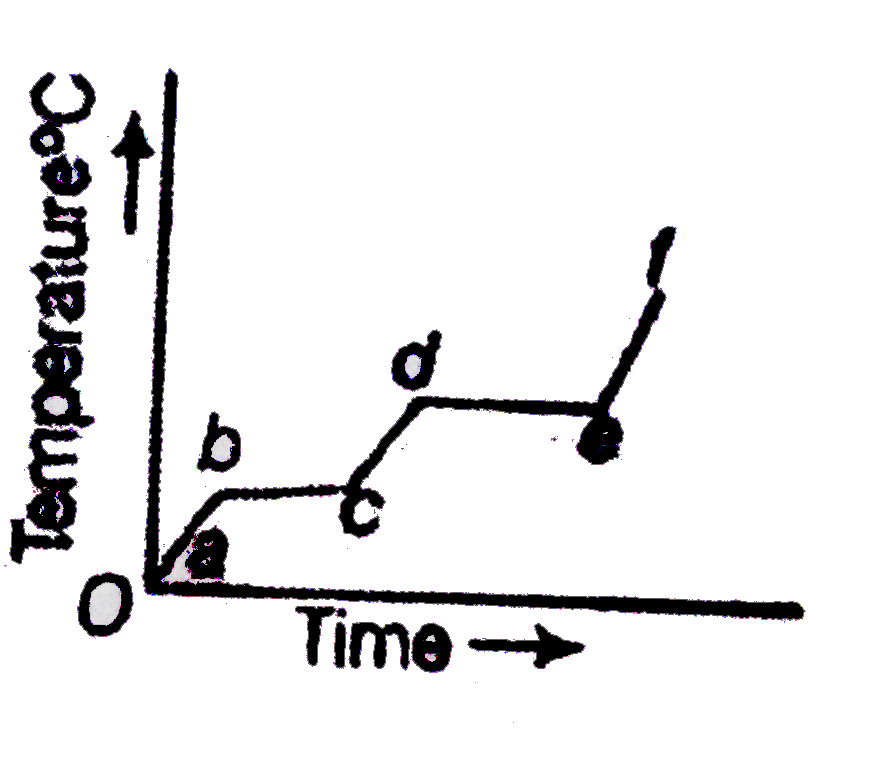
a to b and e to f
b to c and c to d
a to e and e tof
b to c and d to e
d)
Topper's Solved these Questions
- HEAT, TEMPERATURE AND CALORIMETRYBOOK - BITSAT GUIDECHAPTER - HEAT, TEMPERATURE AND CALORIMETRYEXERCISE - Bitsat archives
9 Videos
- GRAVITATIONBOOK - BITSAT GUIDECHAPTER - GRAVITATIONEXERCISE - BITSAT Archives
15 Videos
- LAWS OF THERMODYNAMICSBOOK - BITSAT GUIDECHAPTER - LAWS OF THERMODYNAMICSEXERCISE - 40
1 Video
Similar Questions
Knowledge Check
Heat is supplied to a diatomic gas which expands at constant pressure. The % of change in internal energy to heat supplied is
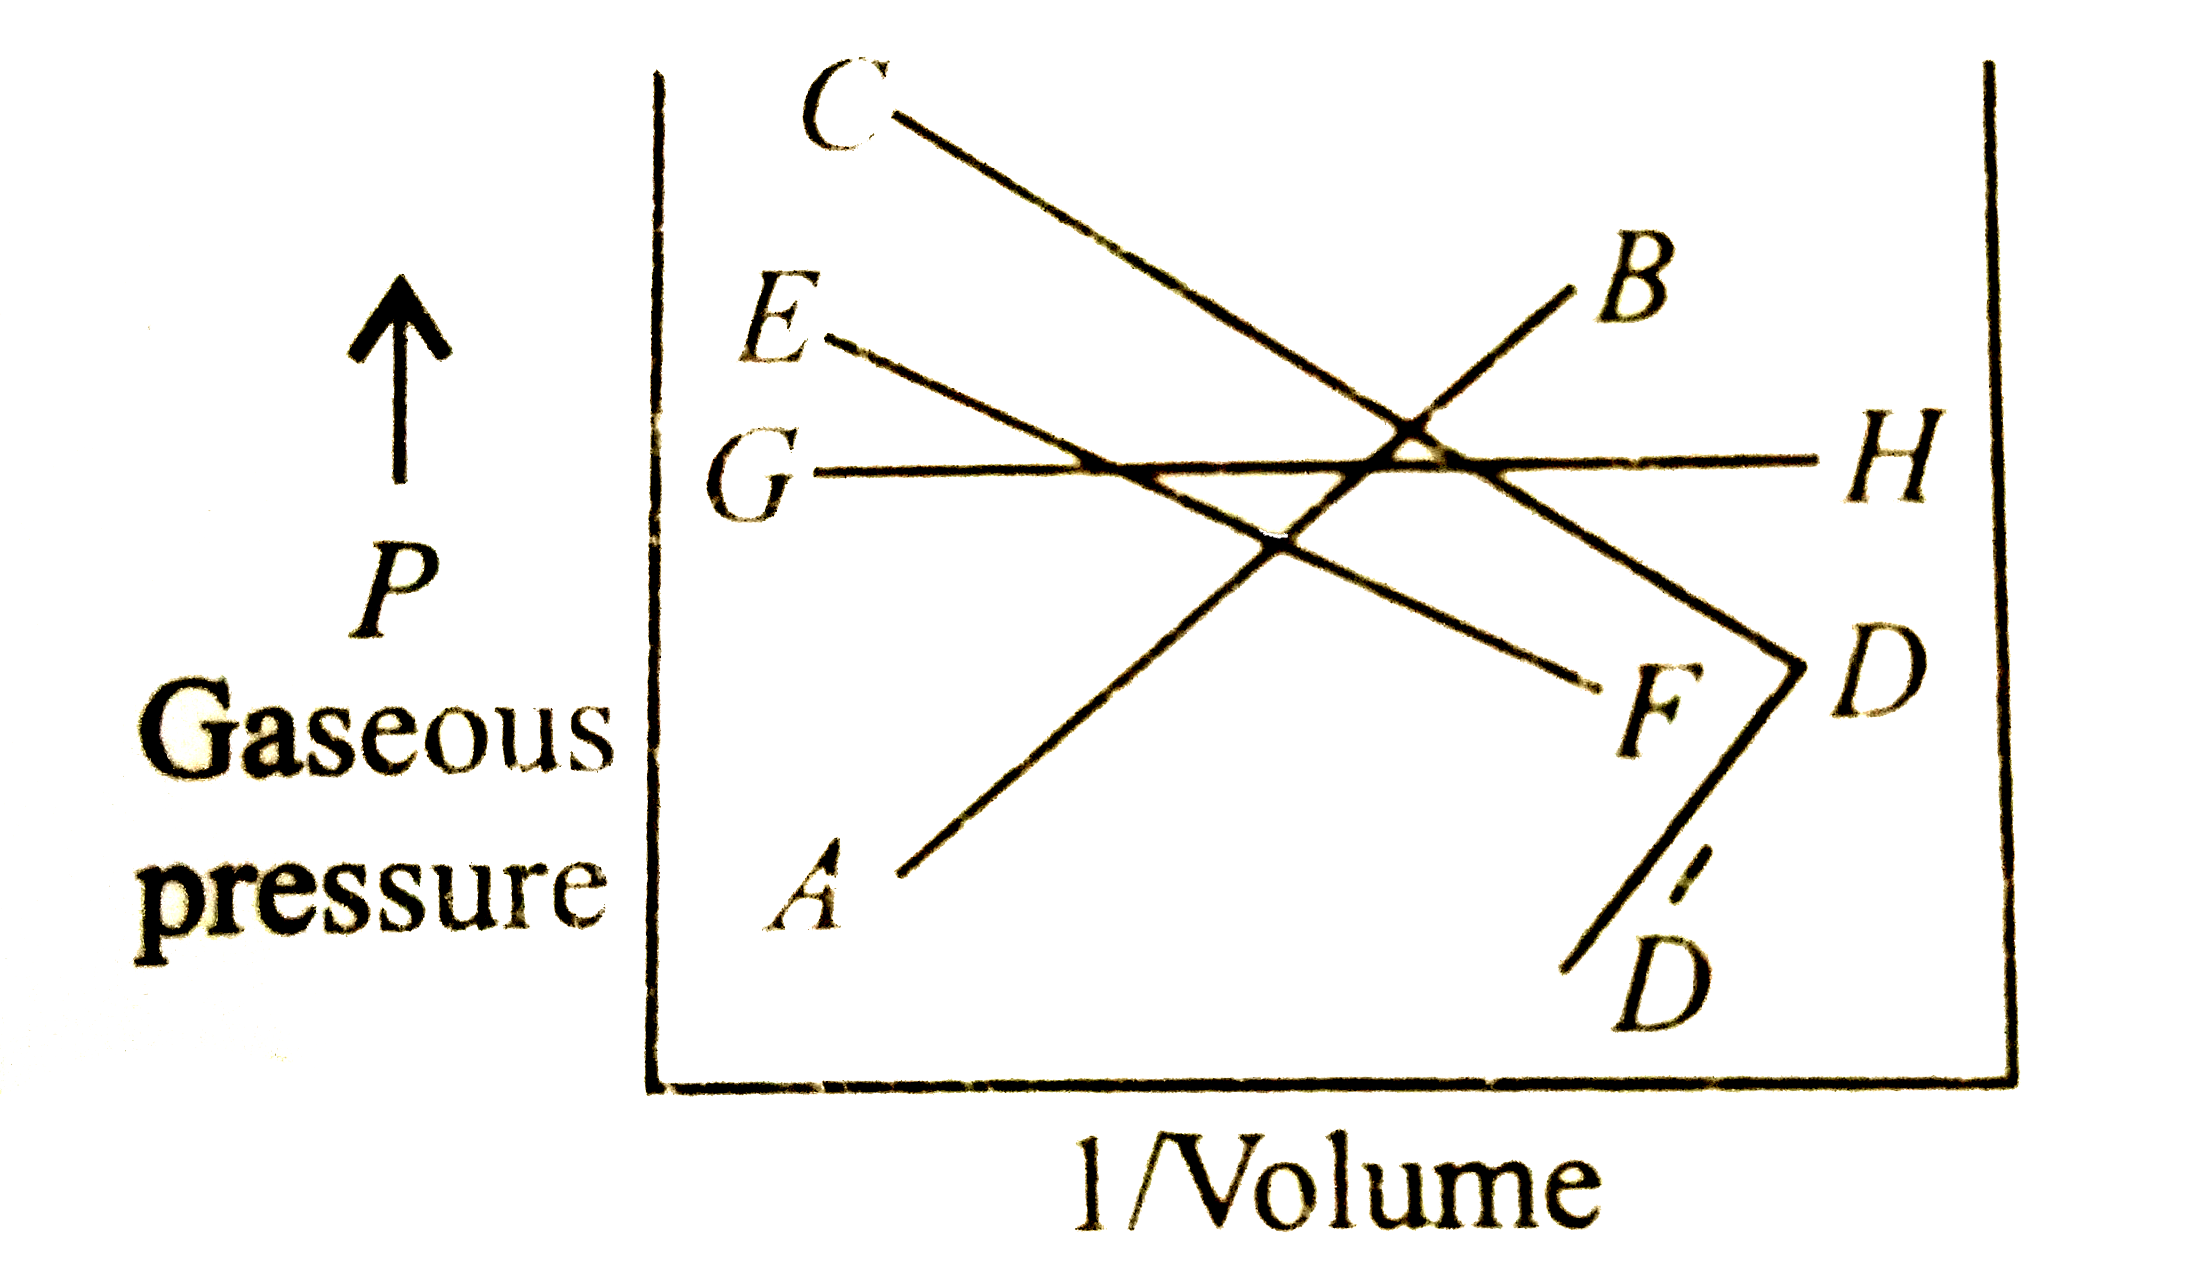
A71.4B60.8C40.9D18.6What is the nature of graph of PV versus P for a given mass of a gas at constant temperature?
AParallel to X-axisBParallel to Y-axisCLinear with positive slopeDLinear with negative slopeThe temperatures versus time graph is shown in figure. Which of the substance A,B and C has the lowest heat capacity if heat is supplied to all of them at equal rates.
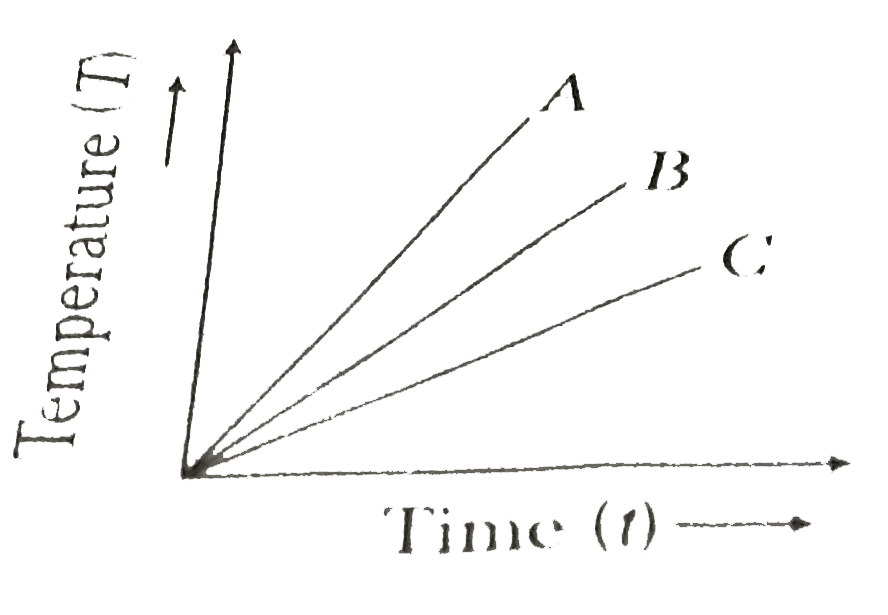 AABBCCDAll the above
Which of the following plots may represent the thermal energy produced in a resistor for a given current as a function of time?

View SolutionIf specific heat capacity of a substance in solid and liquid is proportional to the temperature of substance, then temperature Vs time plot for the substance is best present by [Assume heat is supplied to substance at constant rate and initial temperature is less than melthing pint of substance.
View SolutionIf heat energy is given to an ideal gas at constant pressure, then select the graph which best represents the variation of VT with temperature (T).
View SolutionThe graph shown in the figure represents change in the temperature of 5 kg of a substance as it absorbs heat at a costant rate of 42 kJ min−1. The latent heat of vaporization of the substance is :
View SolutionWhich of the following graph represents the variation of amount of chemisorption of a gas by a solid with temperature under constant pressure?
View Solution
