The number of bactria in a colony is estimated over the course of 9 days, as shown in the table below.
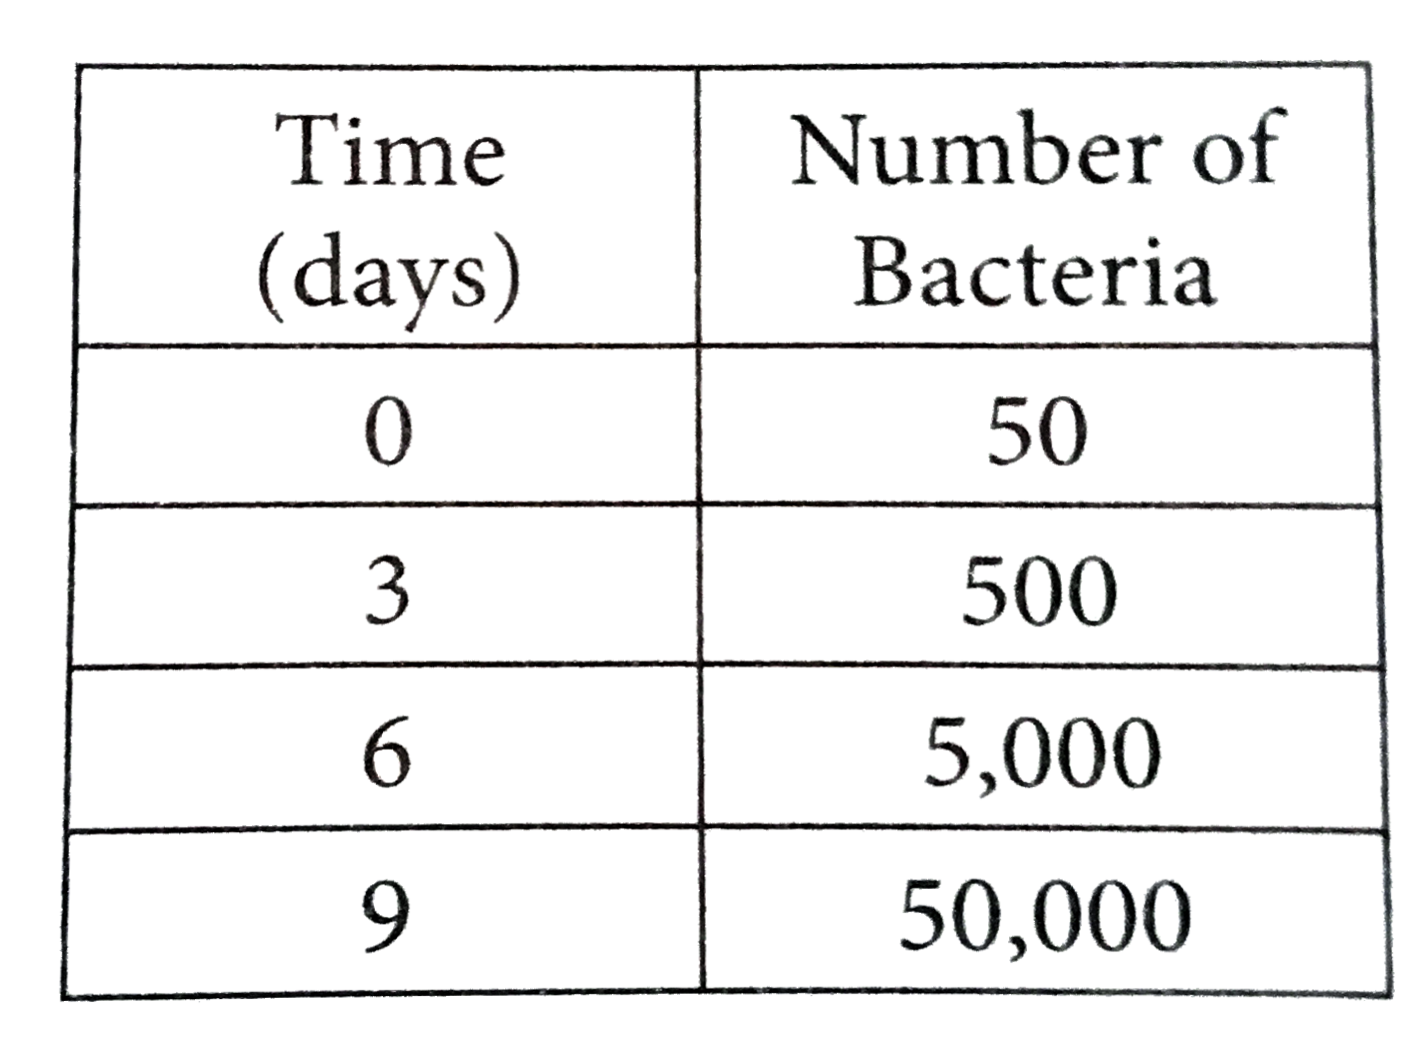
Which of the following best describes the relationship between time and the estimated number of bacteria over these 9 days?
Linear decrease
Linear increase
Exponential decay
Exponential growth
The correct Answer is:D
Step by step video, text & image solution for The number of bactria in a colony is estimated over the course of 9 days, as shown in the table below. Which of the following best describes the relationship between time and the estimated number of bacteria over these 9 days? by Maths experts to help you in doubts & scoring excellent marks in Class 12 exams.
Updated on:21/07/2023Topper's Solved these Questions
- ARITHMETICBOOK - PRINCETONCHAPTER - ARITHMETICEXERCISE - QUICK QUIZ #10
3 Videos
- ALGEBRA: CRACKING THE SYSTEMBOOK - PRINCETONCHAPTER - ALGEBRA: CRACKING THE SYSTEMEXERCISE - Algebra Drill 2: Calculator-Permitted Section
6 Videos
- FUN WITH FUNDAMENTALSBOOK - PRINCETONCHAPTER - FUN WITH FUNDAMENTALSEXERCISE - Fundamental Drill 2: Calculator- Permitted Section
6 Videos
Similar Questions
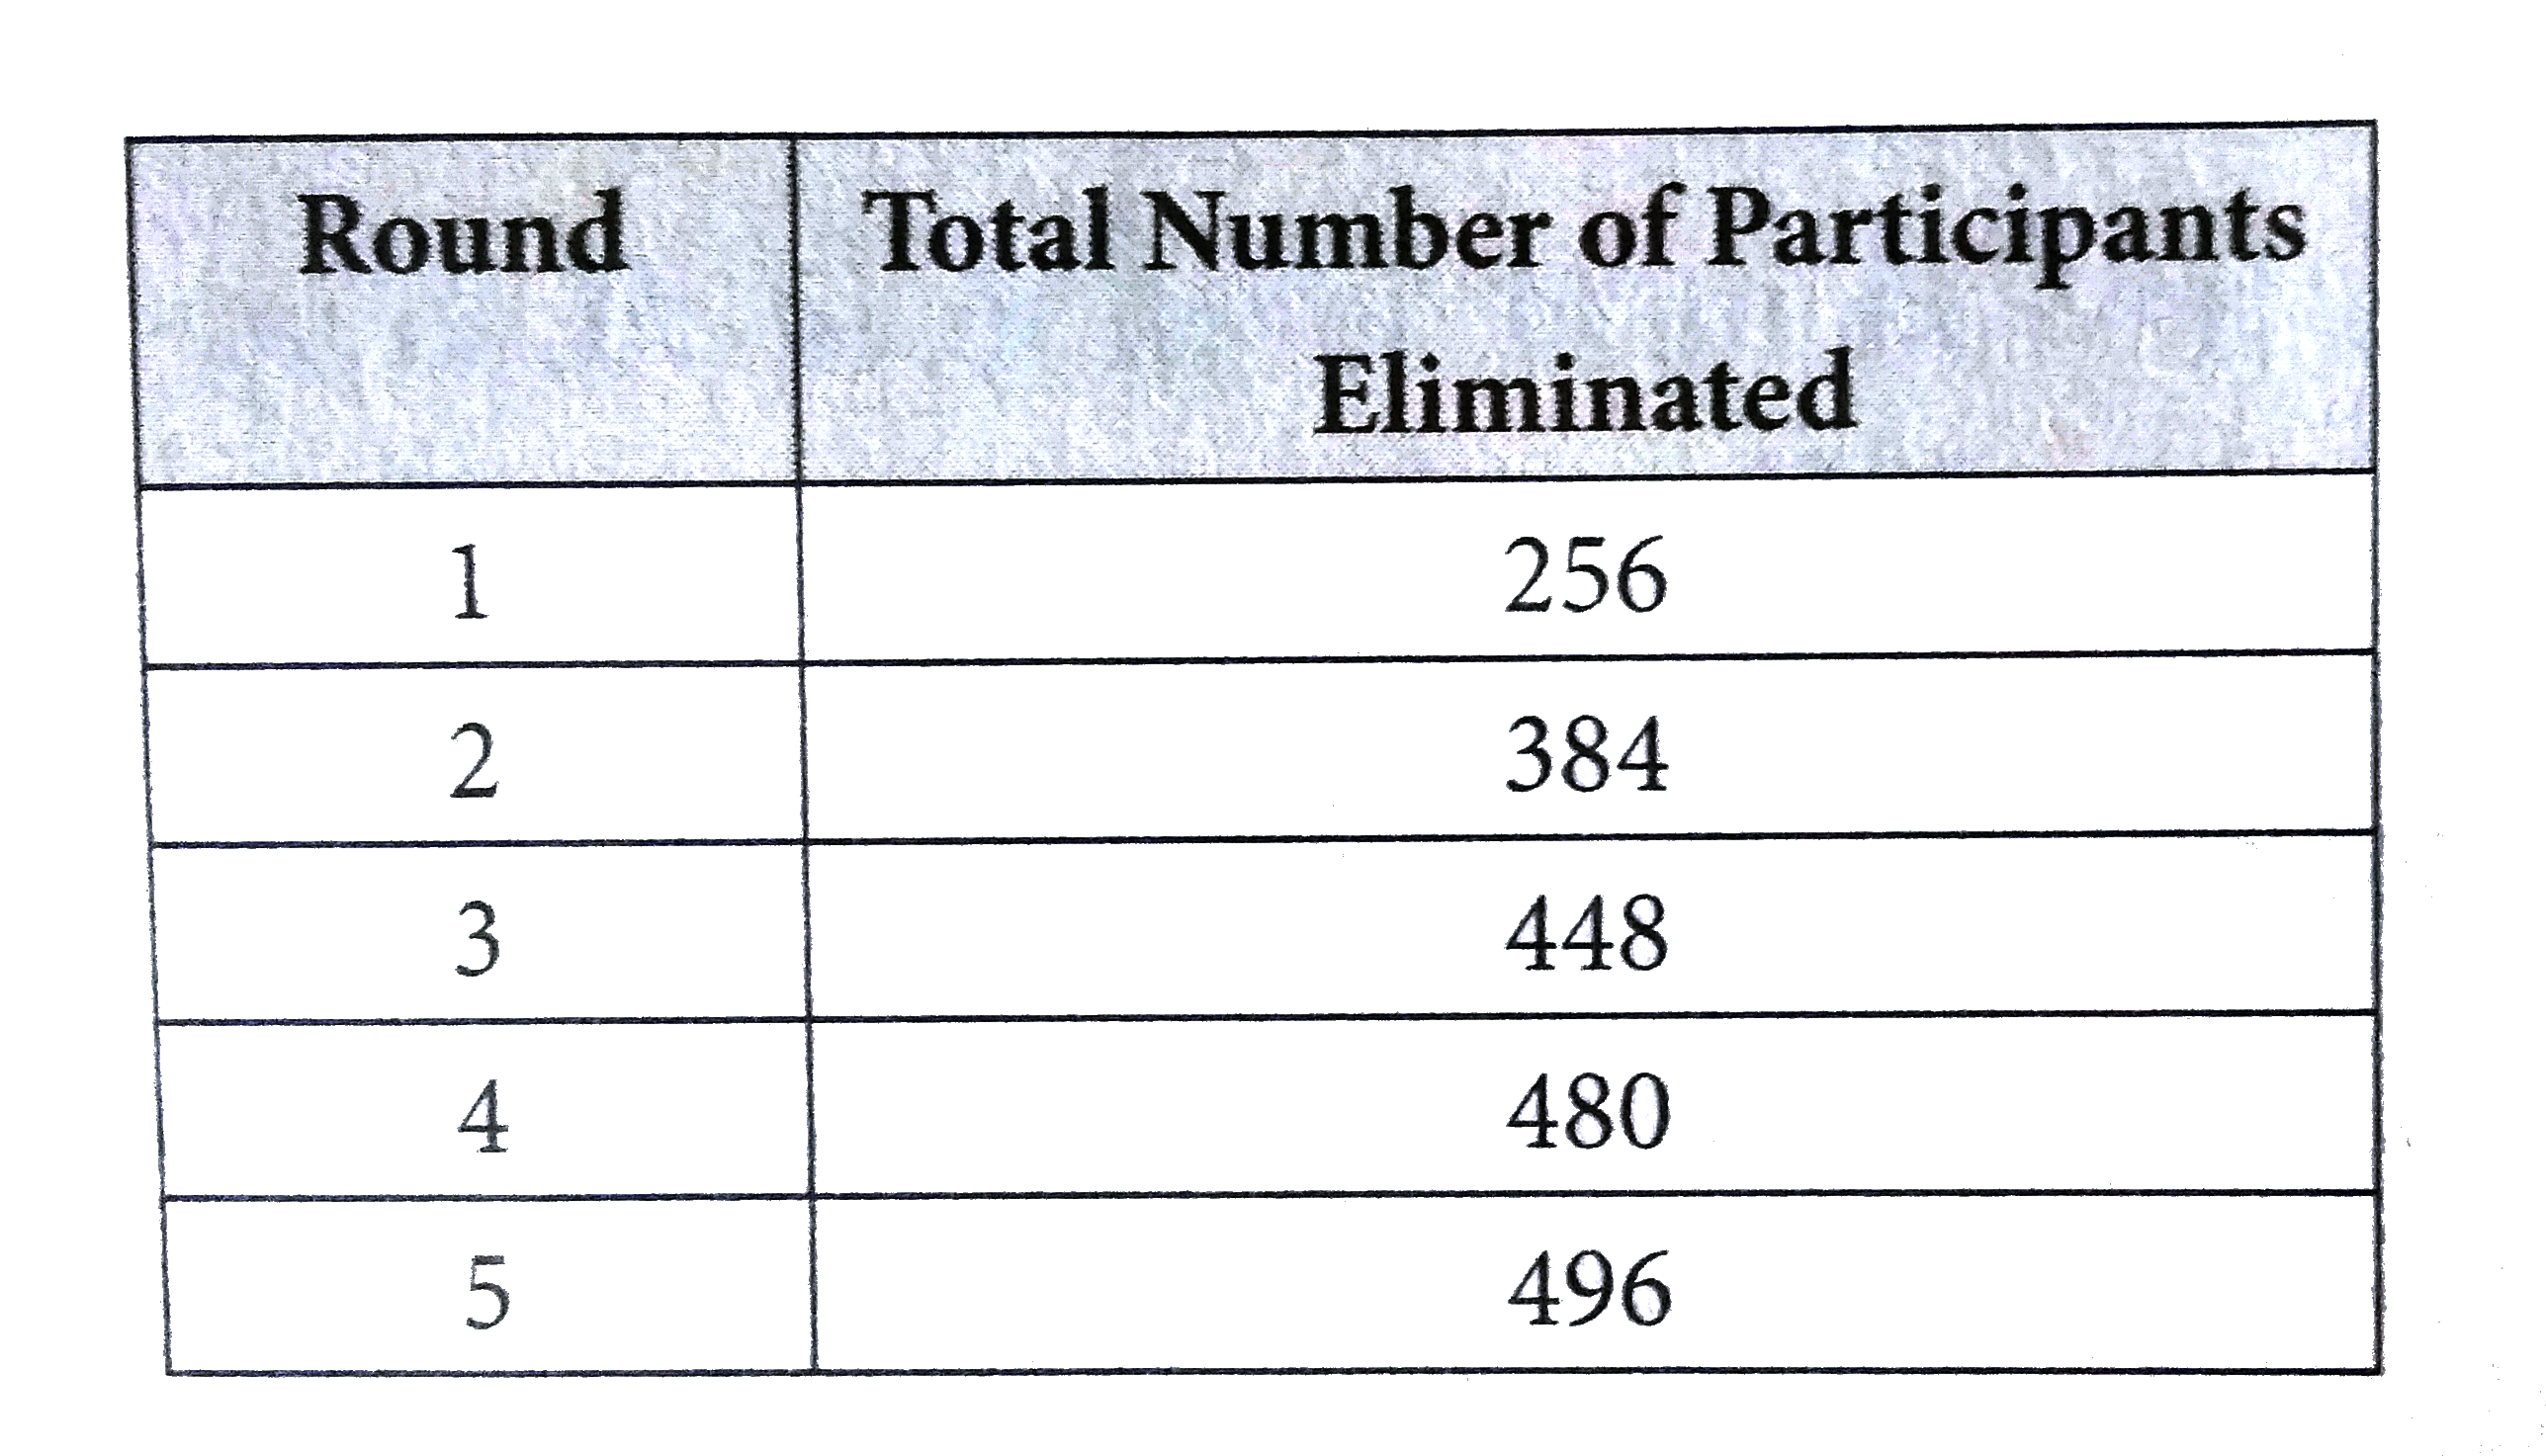
The table above shows the cummulative number of participants eliminated in a national miniature golf tournament by the end of each round. Which of the following best describes the relationship between the round and the number of participants remaining in the tournament?
View Solution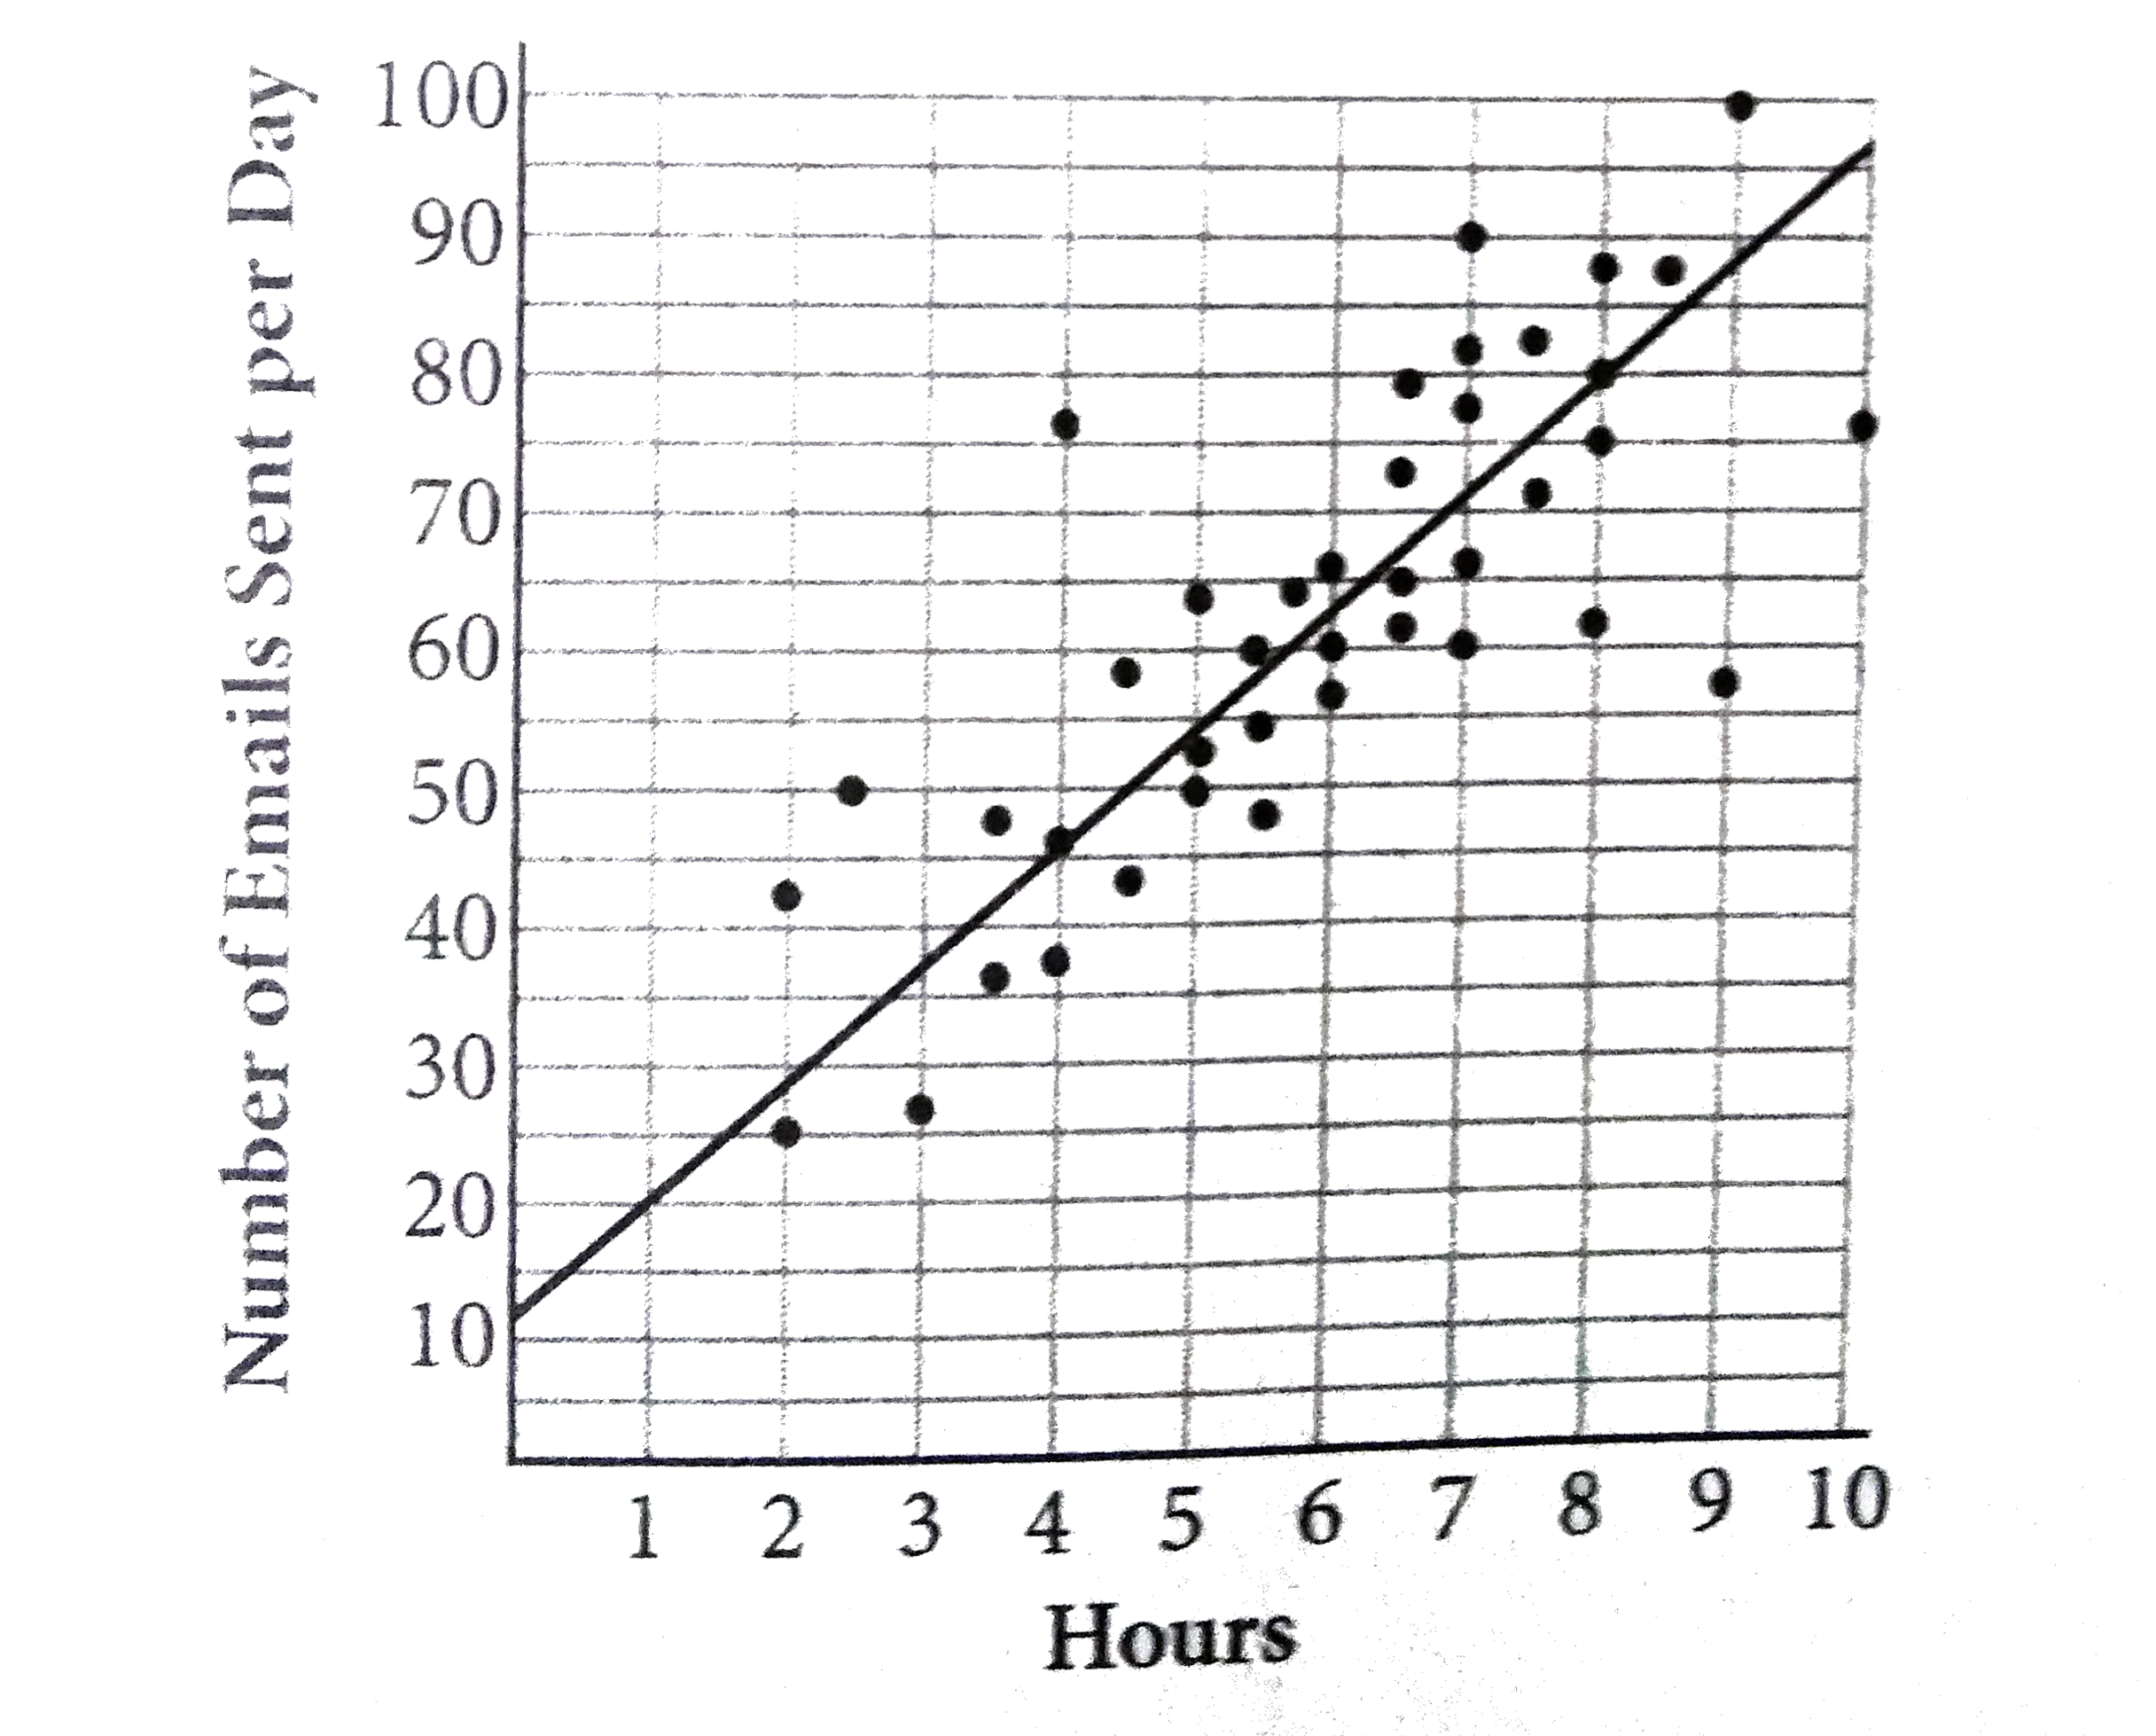
The figure above shows the number of emails sent per day plotted against the number of hours an adult works on a computer per day. Which of the following best estimates the average rate of change in the number of emails sent compared to the number of hours working on a computer?
View Solution
Knowledge Check
The population of mosquitoes in a swamp is estimated over the course of twenty weeks, as shown in the table.
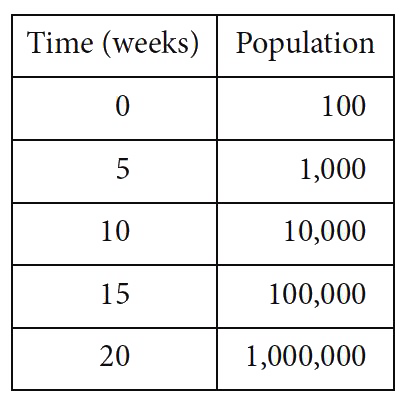
Which of the following best describes the relationship between time and the estimated population of mosquitoes during the twenty weeks?AIncreasing linearBDecreasing linearCExponential growthDExponential decay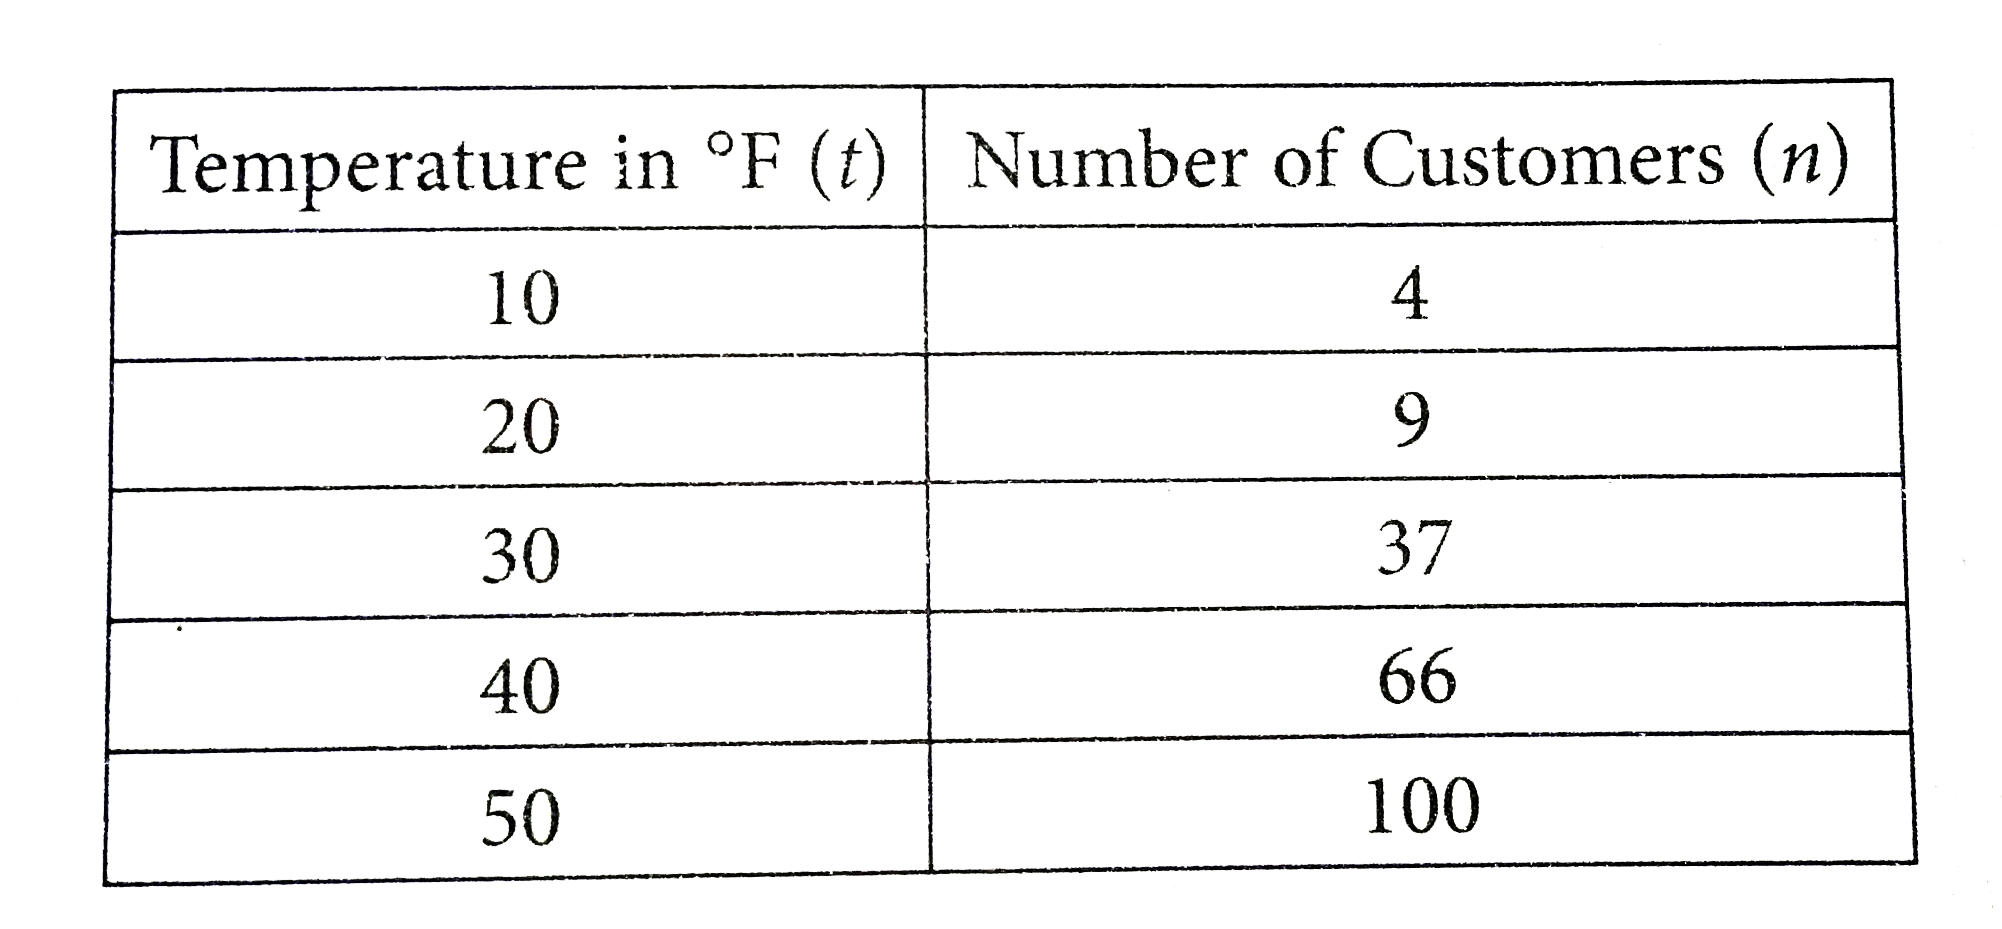
A coffee shop noticed that the outside temperature affected the number of customers who came to the shop that day, as shown in the table above. Which of the following graphs best represents the relationship between the outside temperature t, and the number of customers,n, as indicated by the table?A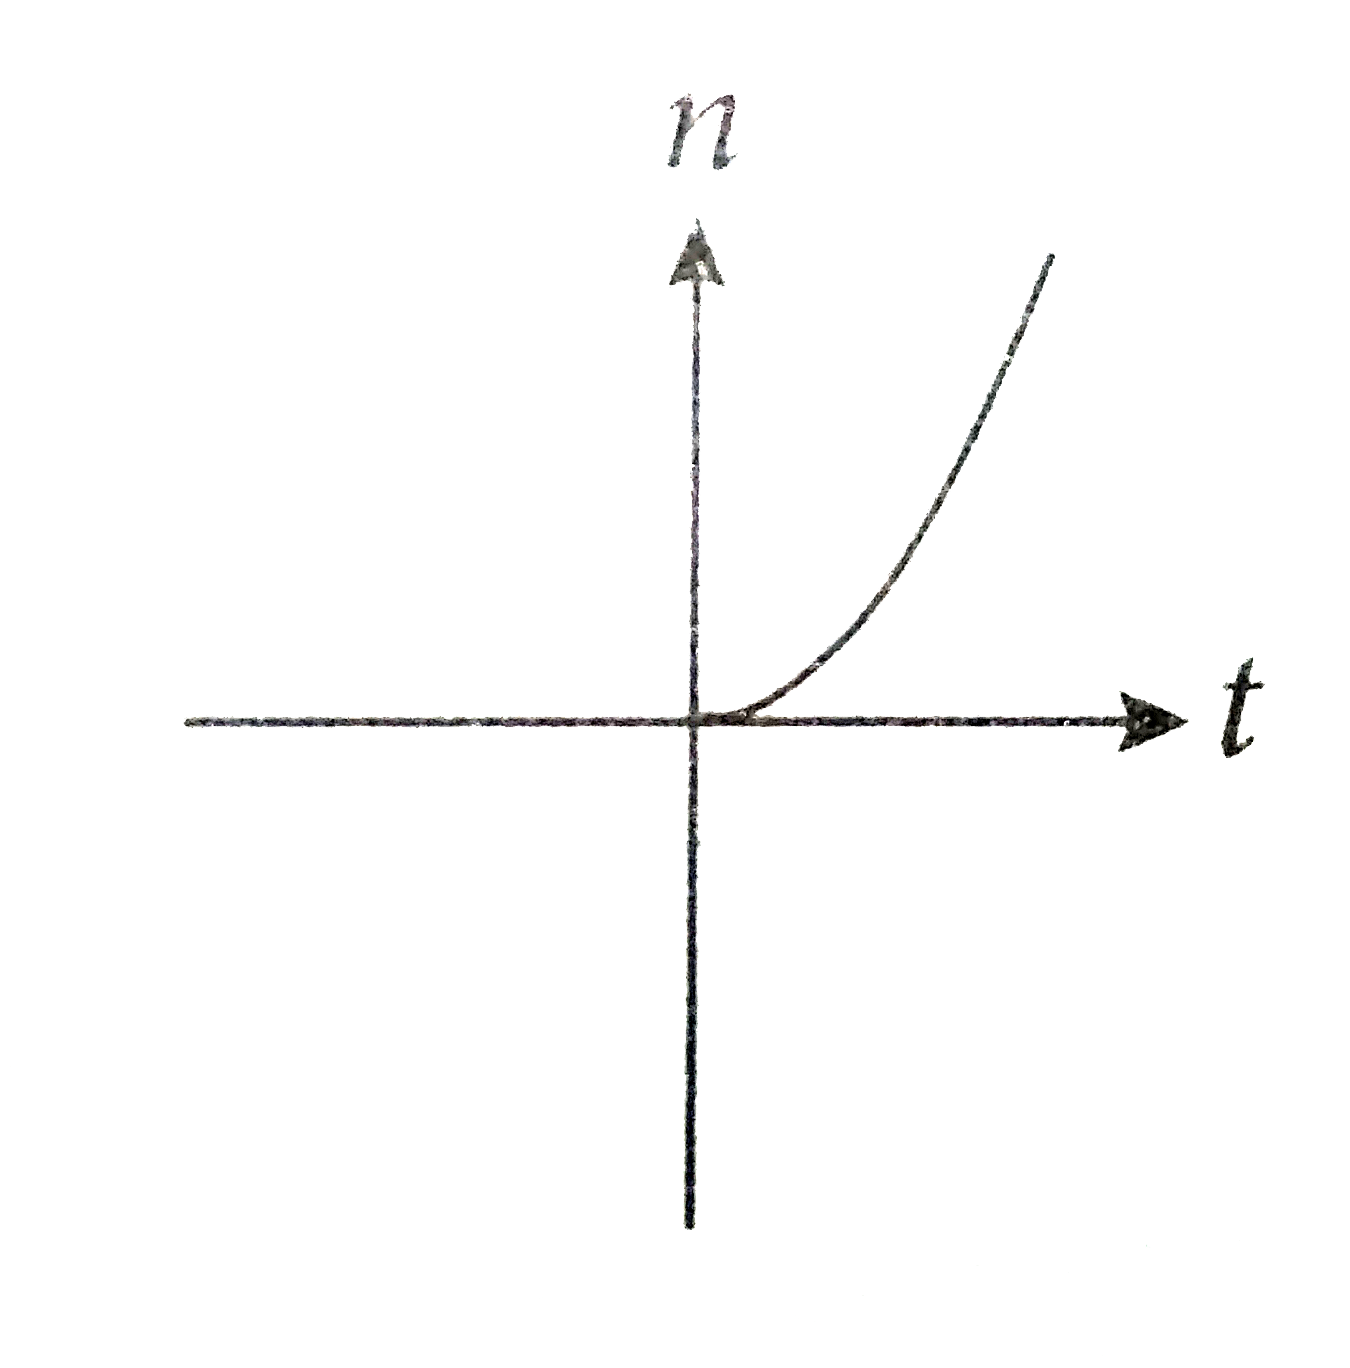 B
B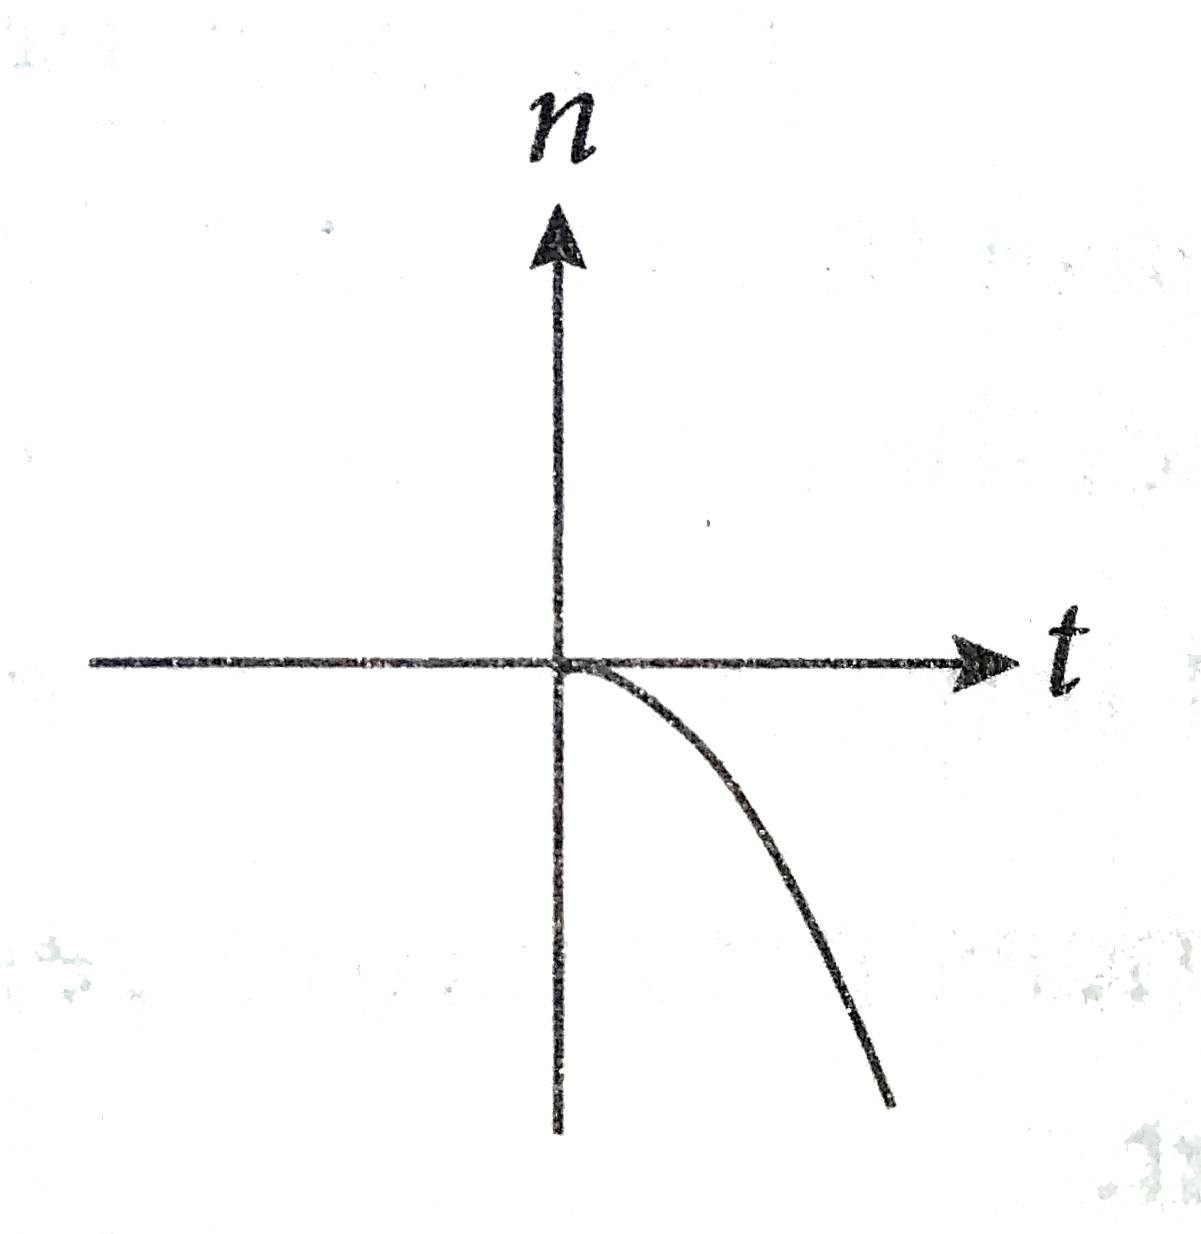 C
C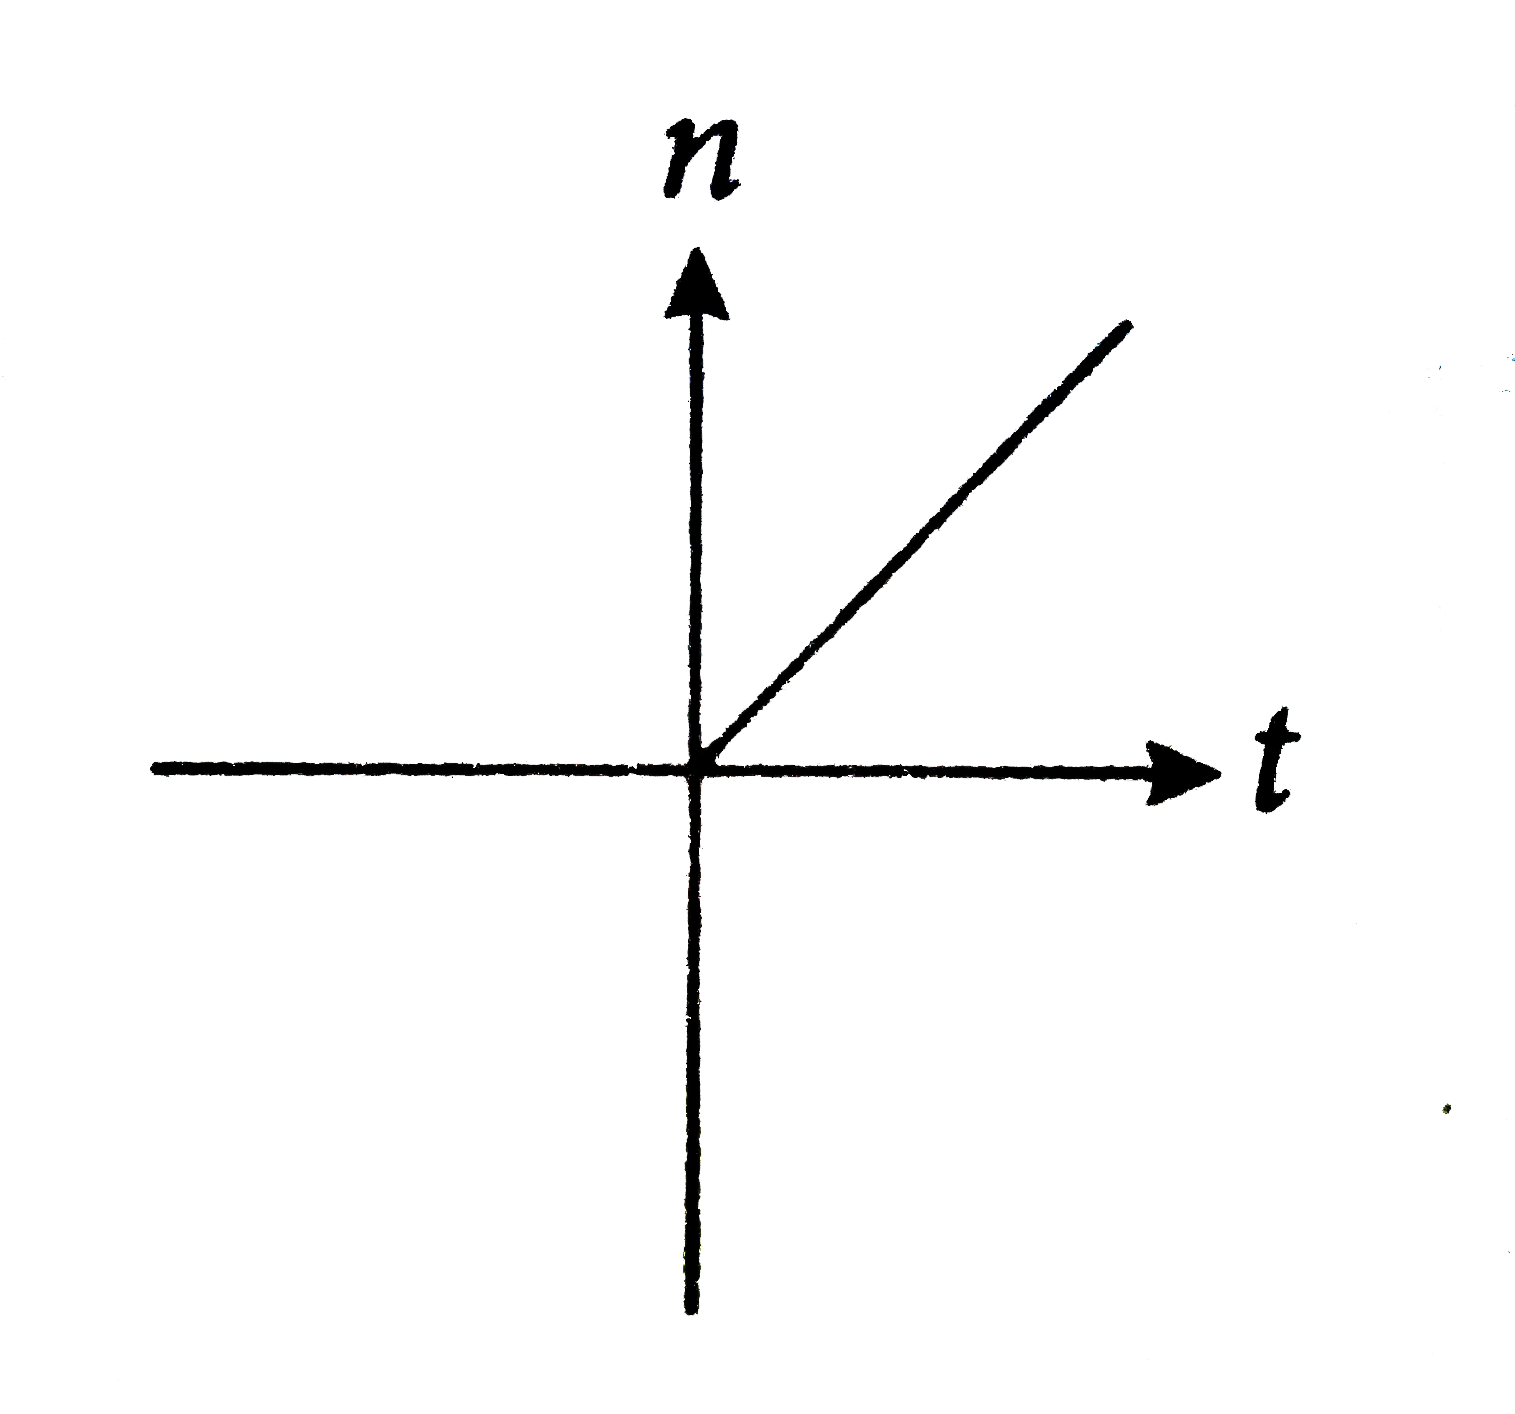 D
D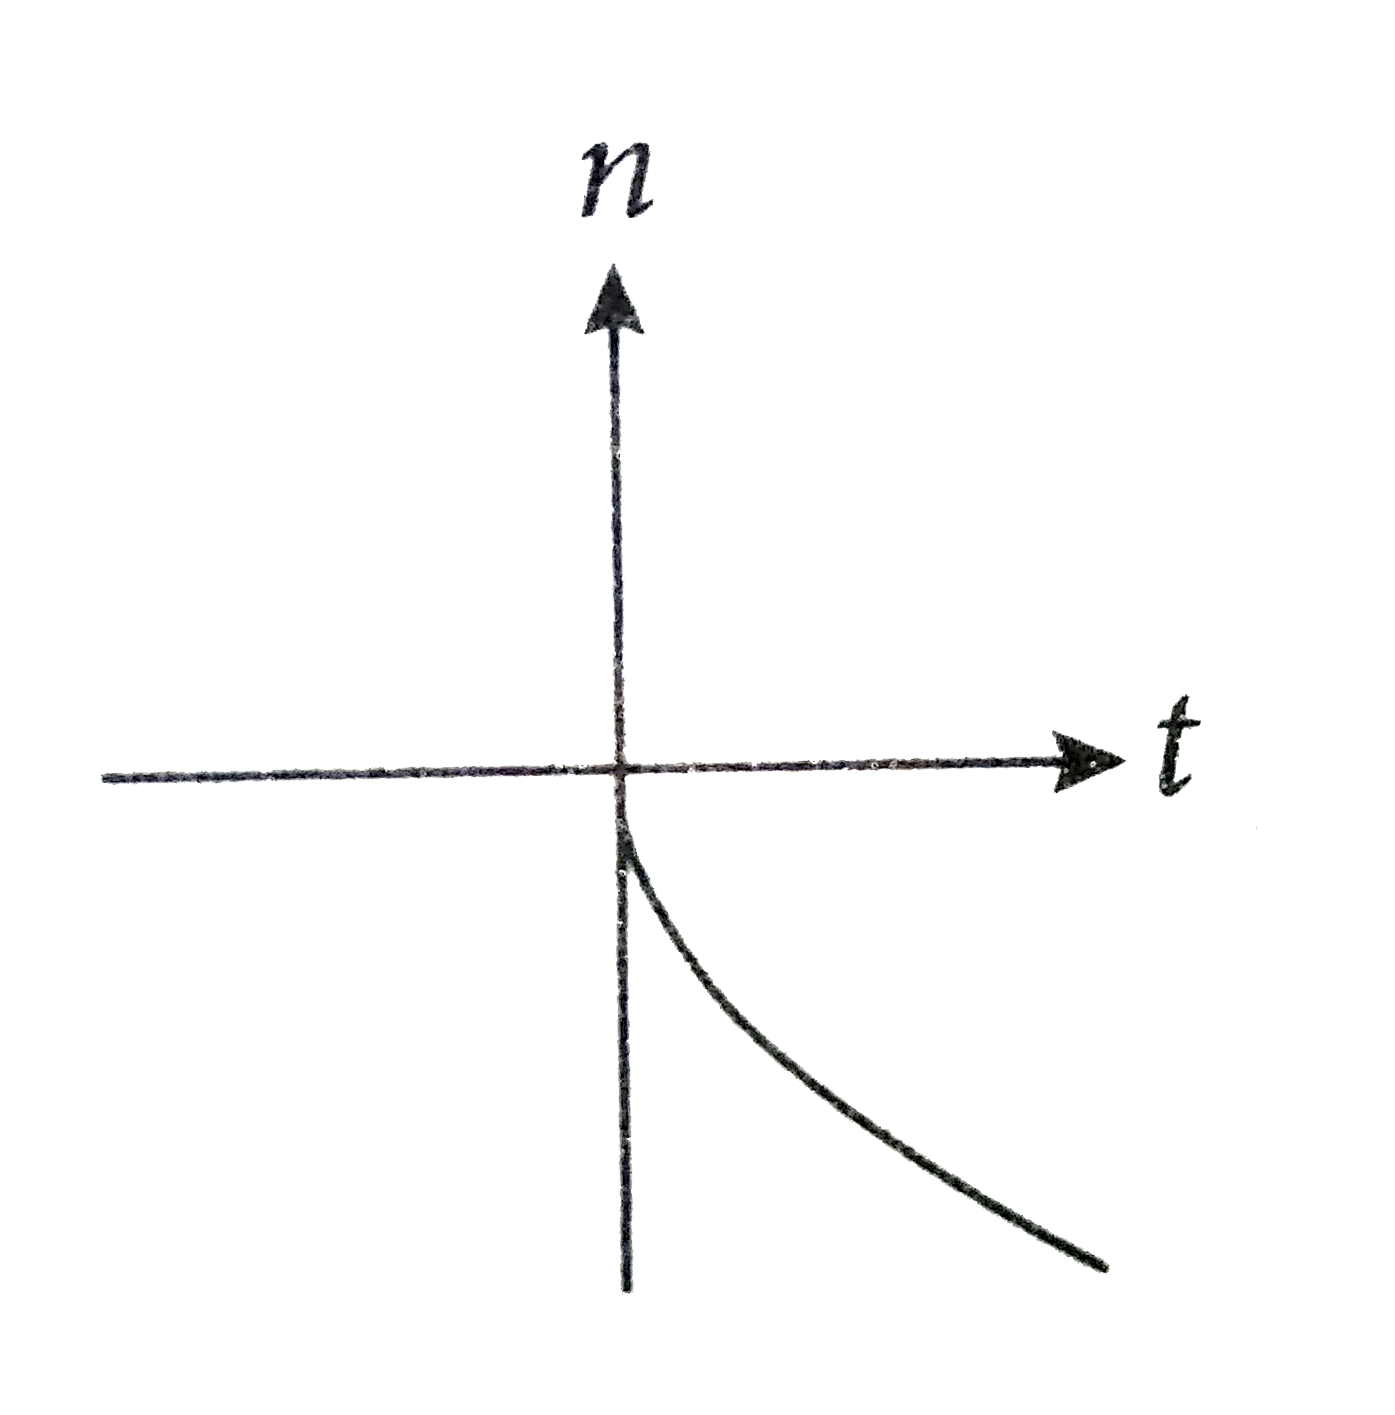
Carrie's Chocolate shop and Tamika's Treat Shop both sell cadny in boxes. The table below lists the price (the total amount the customer pays) of each box of candy sold at the shops. For each shop, there is a linear relationship between the price of a box of candies and the number of candies in the box. These are the only numbers of candies that can be purchased at the shops.
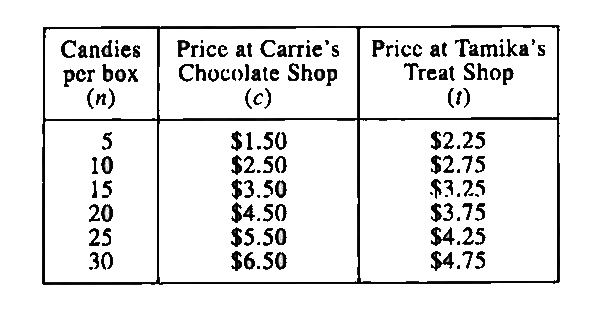
Which of the following equation gives the relationship between the price in dollars , c, and the number of candies ,n, in a box of cadies at carrie's chocolate shop ?Ac=0.2n+0.5Bc=0.3nCc=0.5n+1.5Dc=n−3.5
Vera is on her school's track and field term. In a partice long-jump competition against her temmates, she gets 5 points for landing over the nearer line and 10 points for landing over the more distant line. She gets a total of 7 jumps and lands x times over the more distant line and the rest of the times over the nearer line. Which of the following equations represents the relationship between Vara's total score, y, and the number of times she lands over the more distant line, x ?
View SolutionWhich of the following statements best describes the stereochemical relationships of compound I, II and III shown below ?

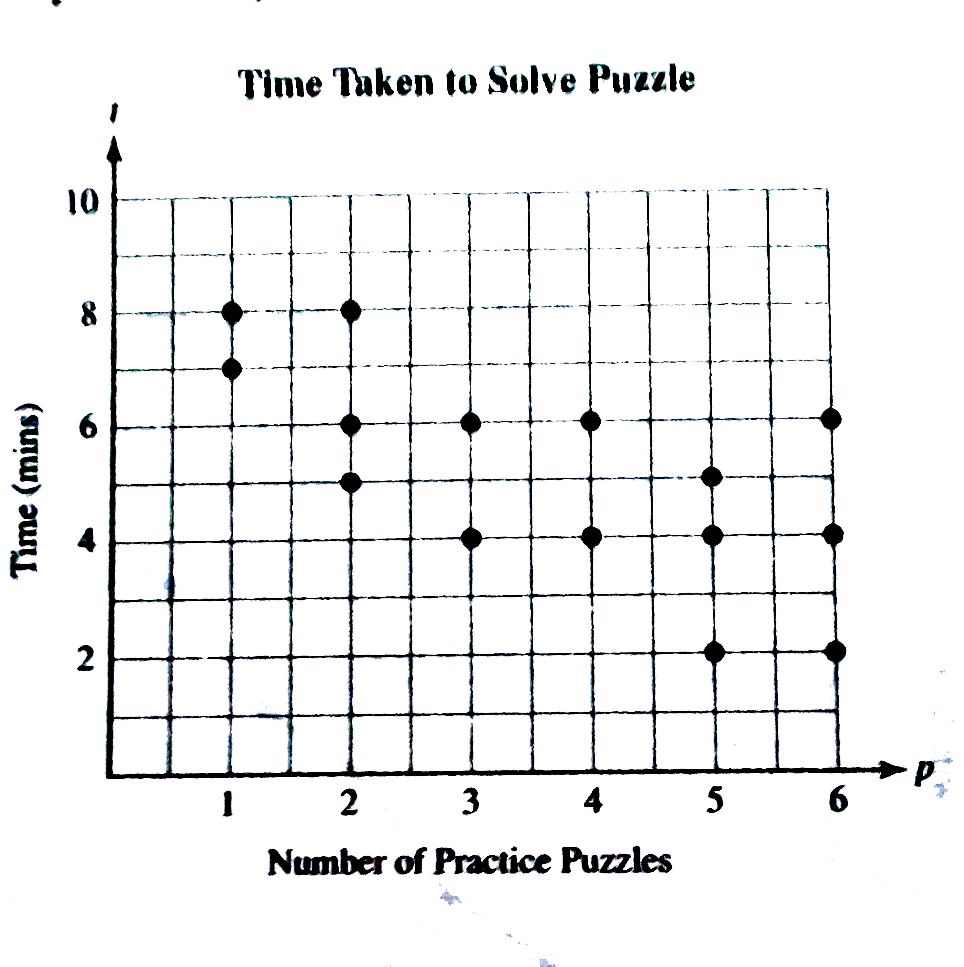
View SolutionA psychologist's experiment involved timing 15 small children as they found the solution to a little puzzle . Each child received at least one similar puzzle to play with before being timed . The scatterplot below shows the time each child took to solve the puzzle , and the corresponding number of "practice" puzzles each child received . On the basis of these data , which of the following functions best models the relationship between t, the number of minutes taken to complete the puzzle , and p , the number of practice puzzles ?
View Solution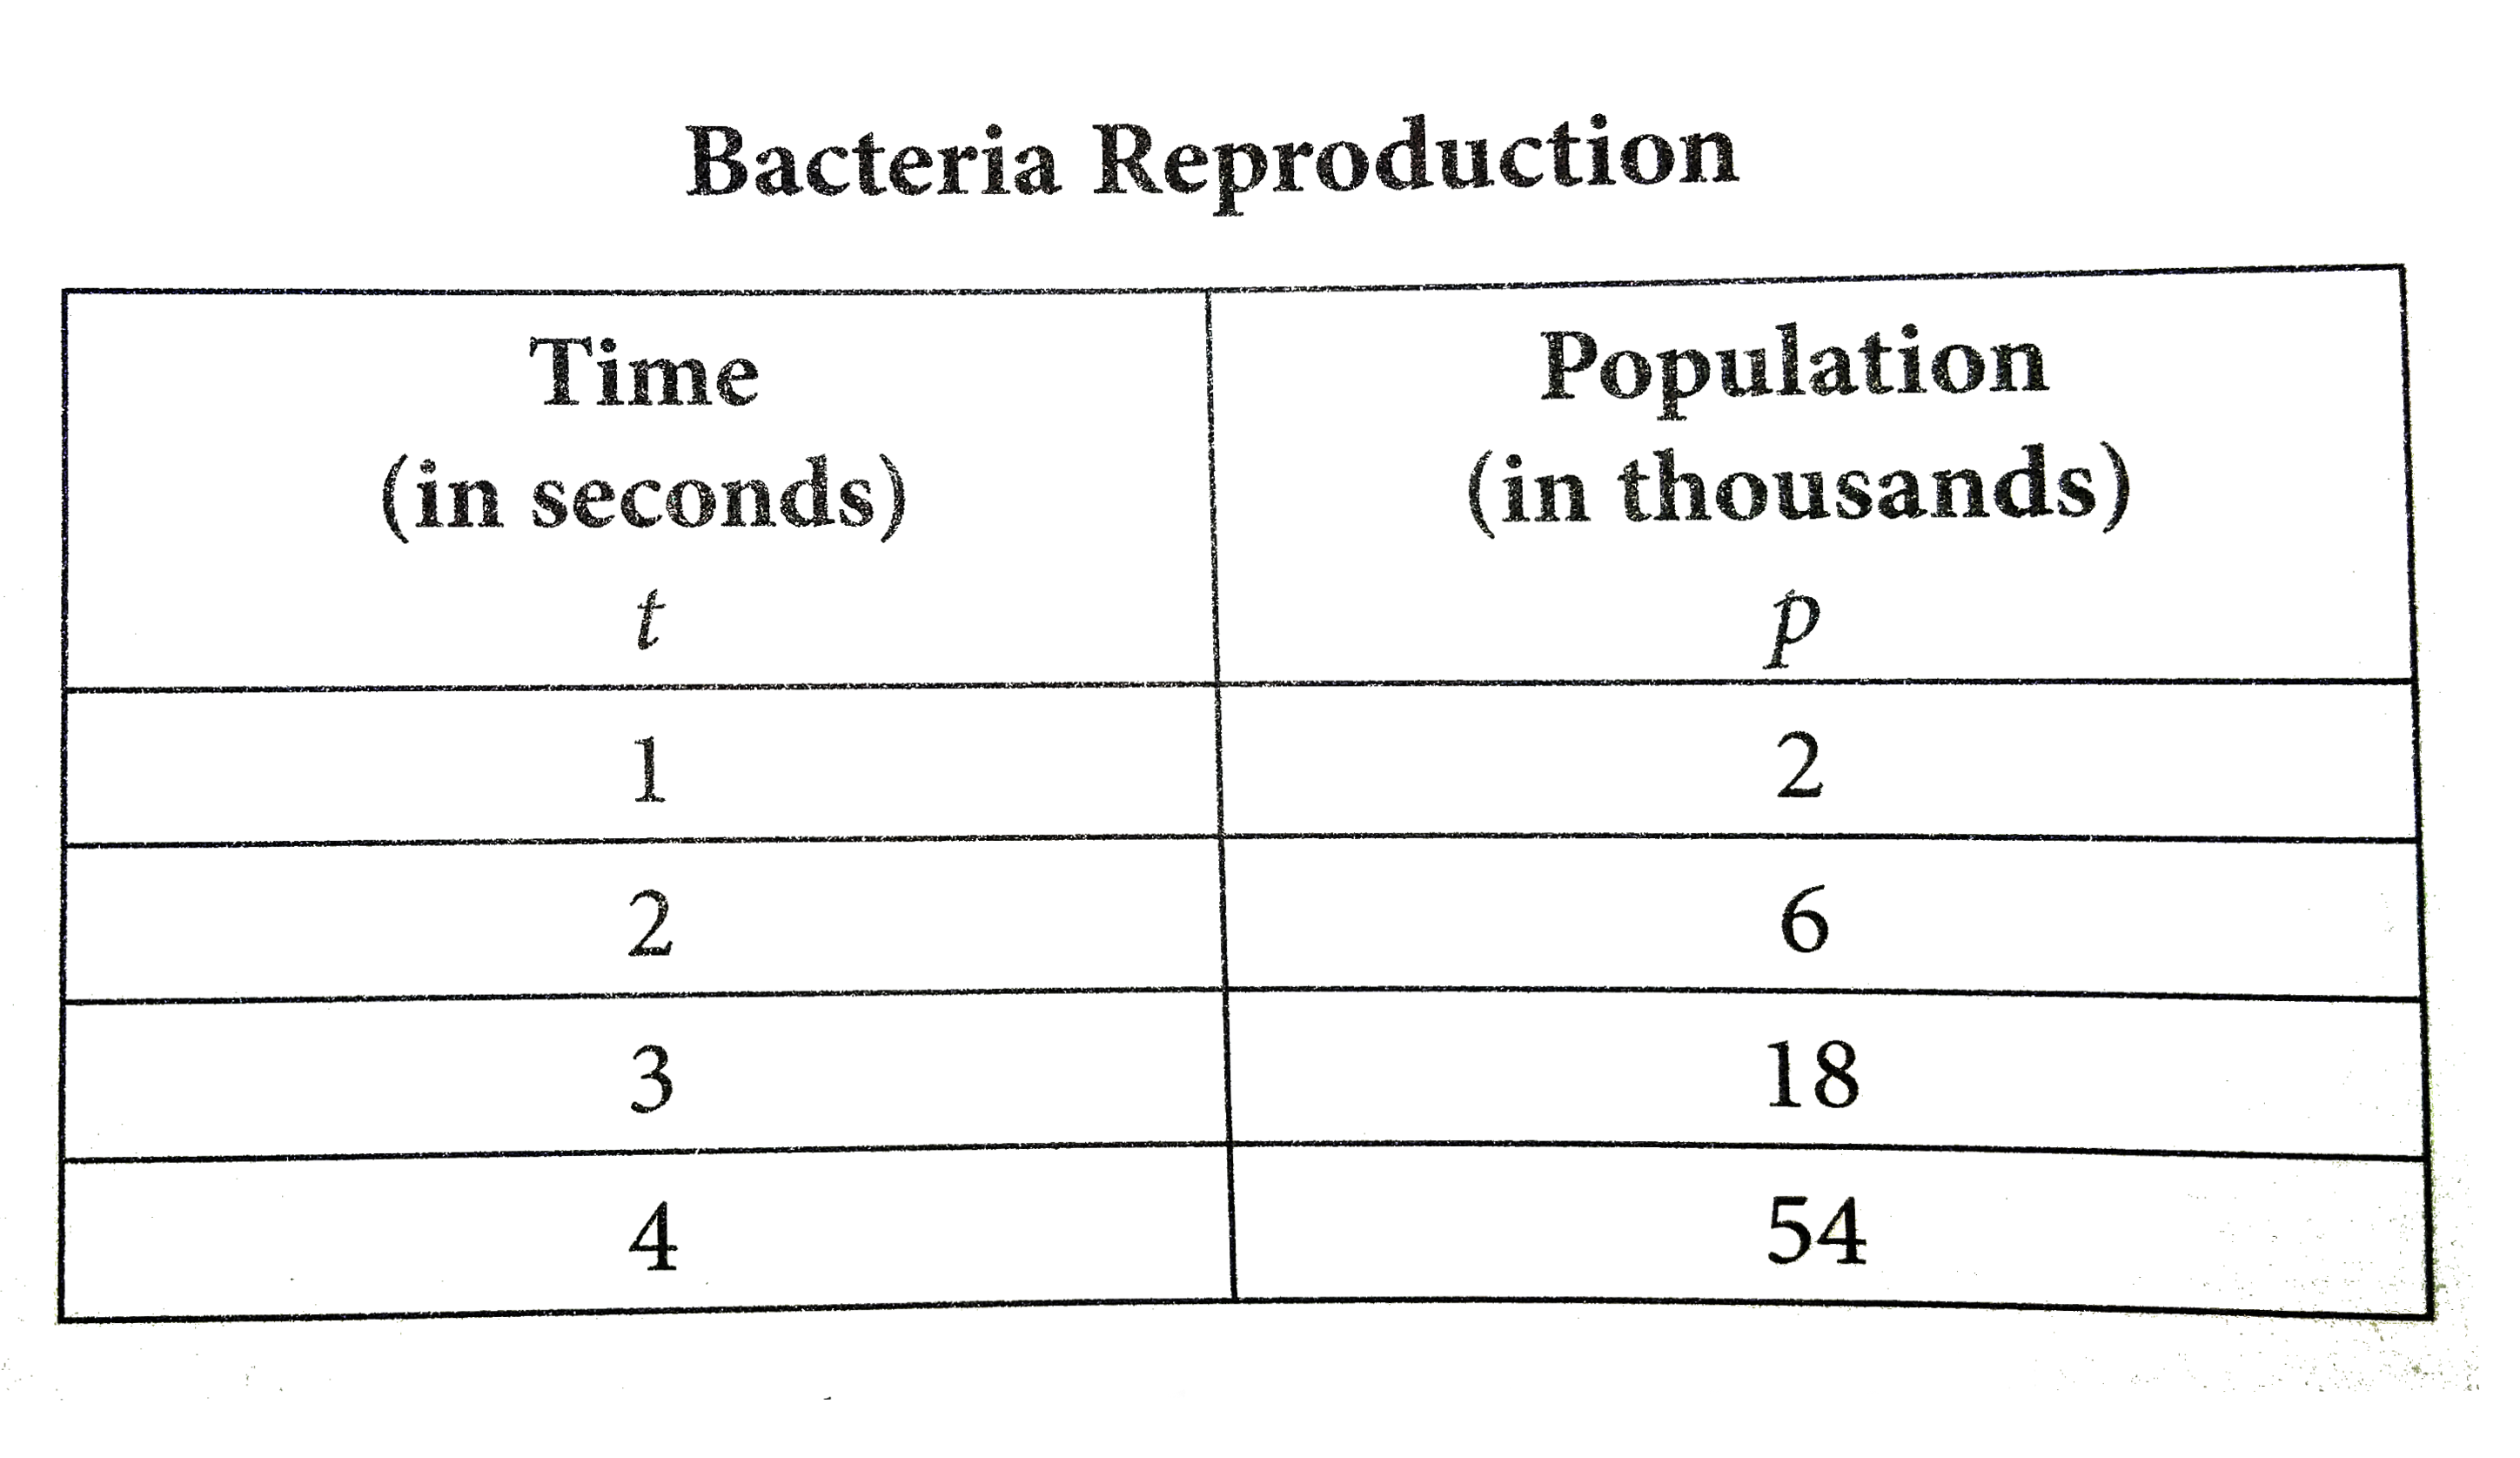
The table above shows the population growth of certain bacteria over four seconds. Which one of the following equations shows the relationship between t and p, according to the table?
View SolutionAndrew rorks at a trabvel agency. He gets paid $120 for a day's work, plus a bonus of $25 for each cruise he books. Which of the following equations represents the relationship between the total Andrew earns in a day, d, and the number of cruises he books, c ?
View Solution
