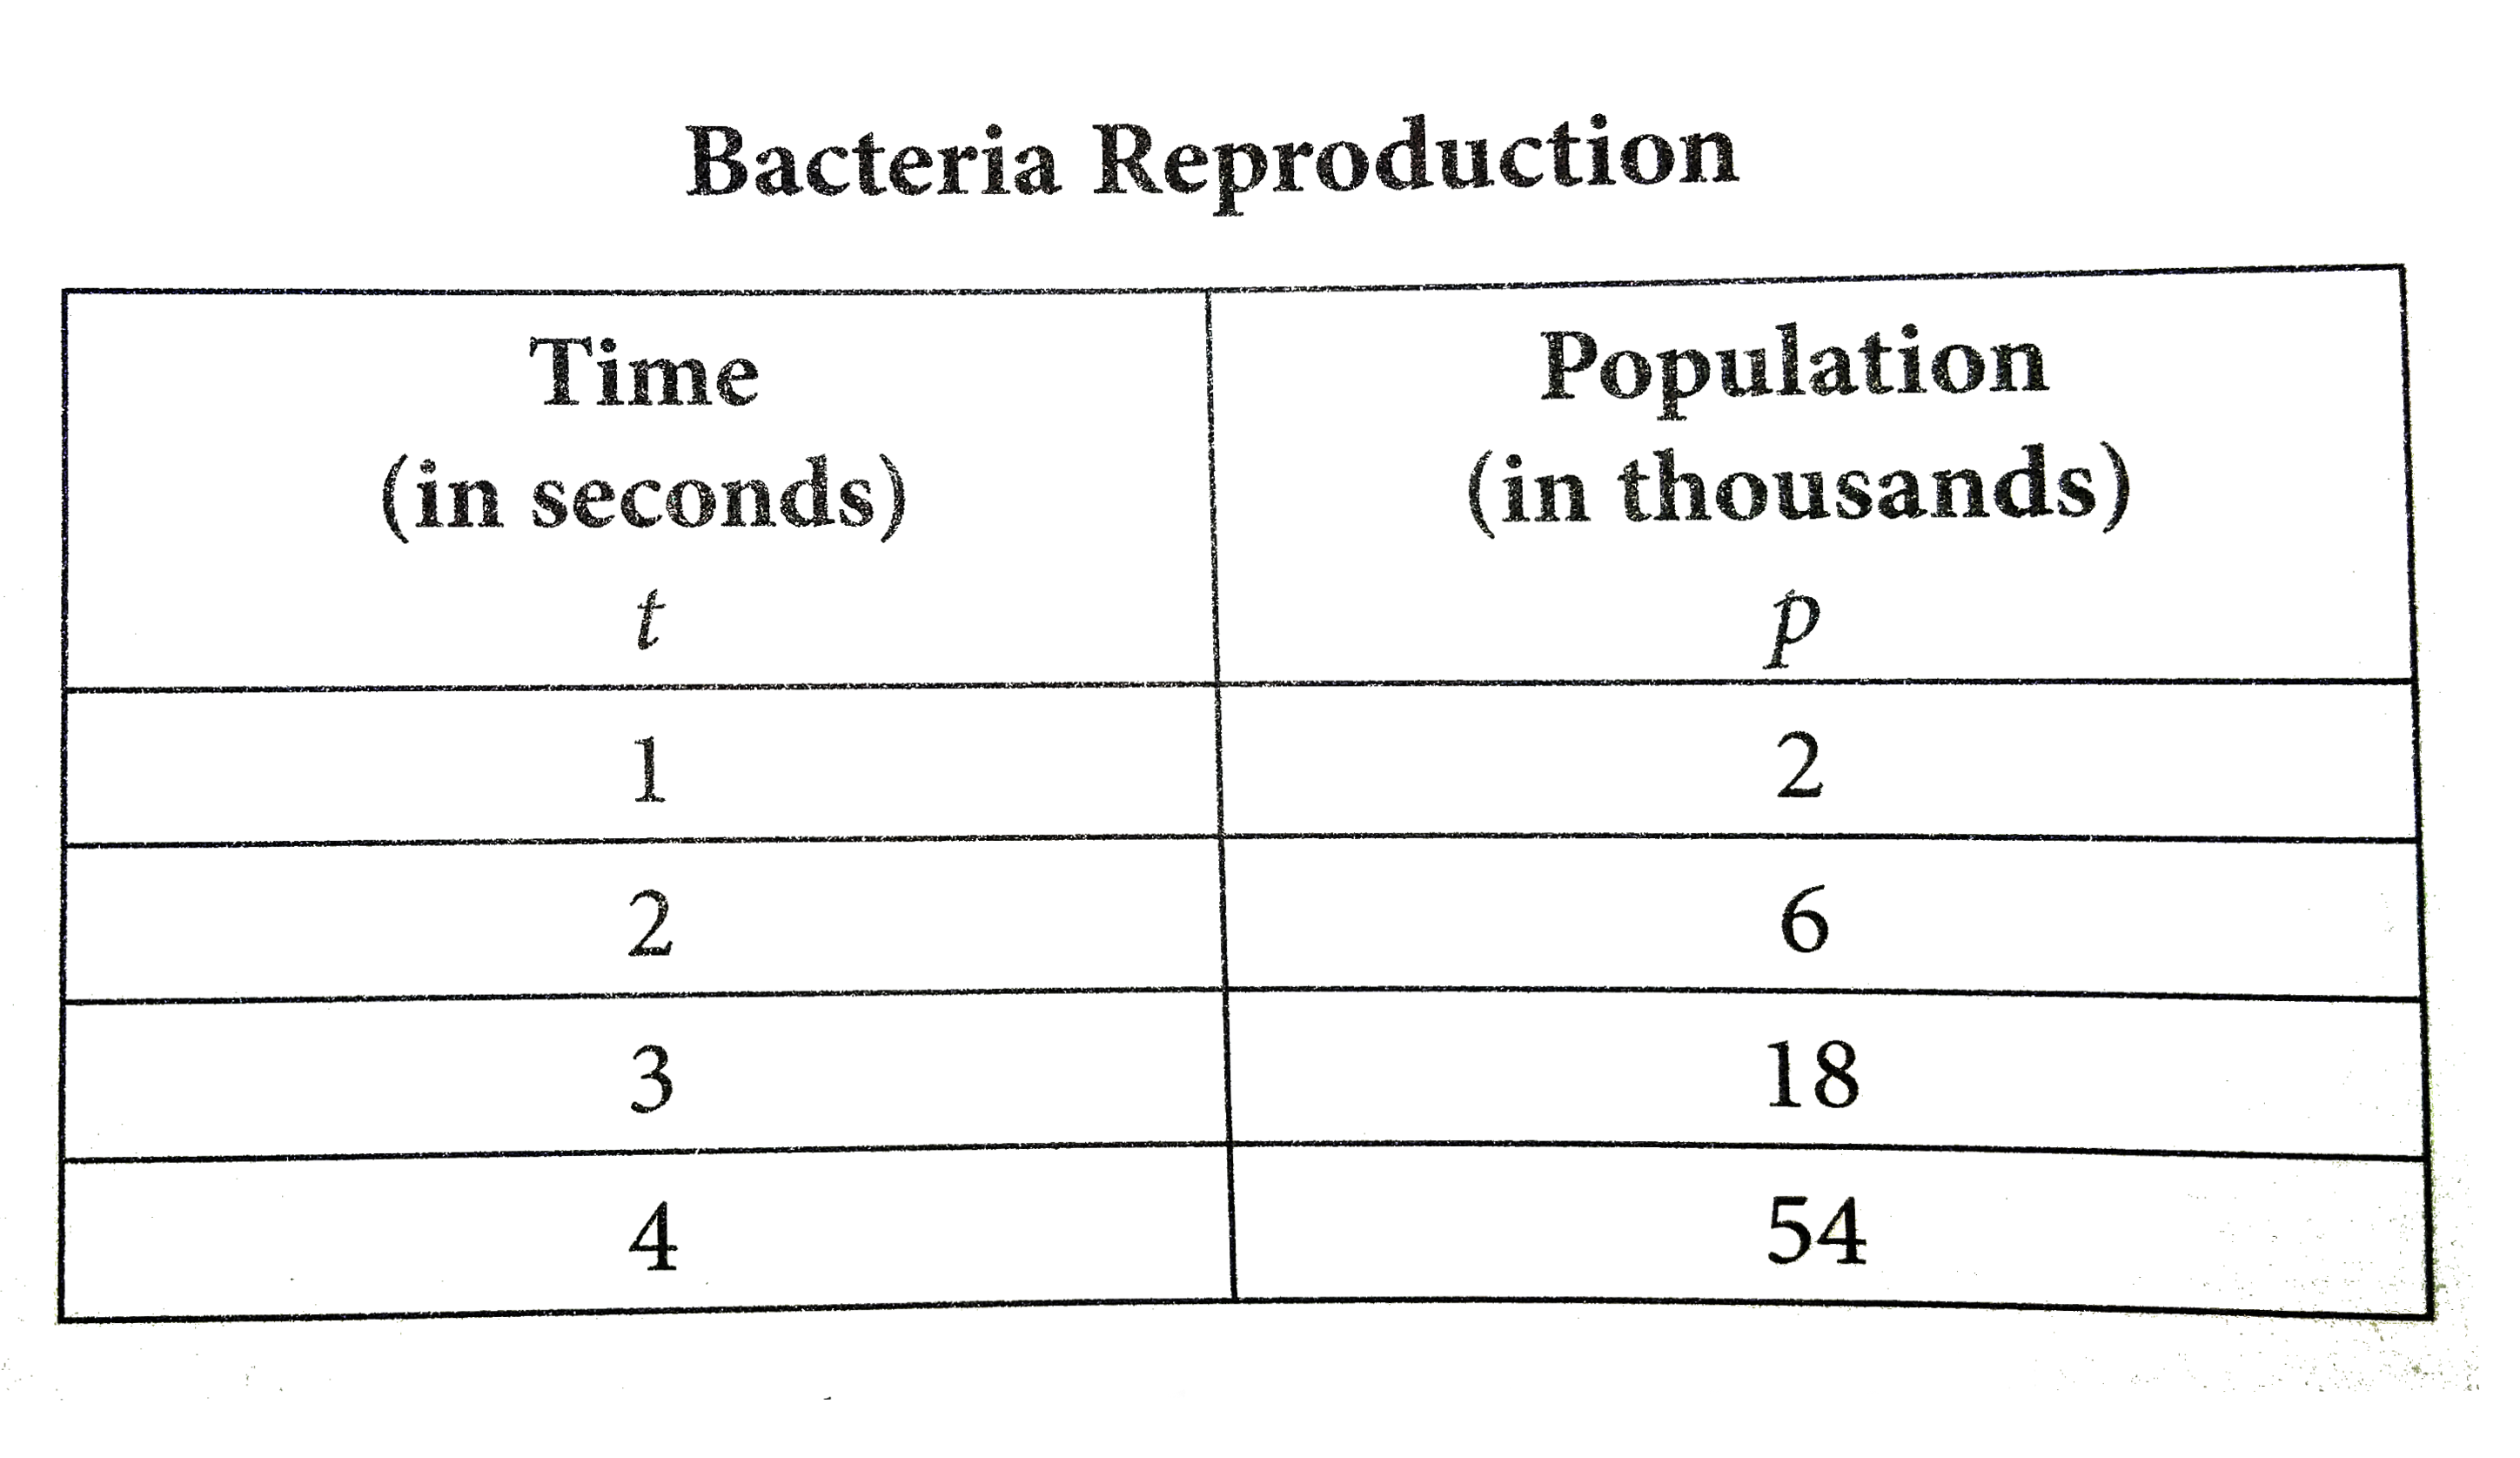
The table above shows the population growth of certain bacteria over four seconds. Which one of the following equations shows the relationship between t and p, according to the table?
p=3t
p=2t2
p=2×3t
p=2×3t−1
The correct Answer is:D
Step by step video, text & image solution for The table above shows the population growth of certain bacteria over four seconds. Which one of the following equations shows the relationship between t and p, according to the table? by Maths experts to help you in doubts & scoring excellent marks in Class 12 exams.
Topper's Solved these Questions
- BOOK - PRINCETONCHAPTER - PROBLEM SETSEXERCISE - PROBLEM SET 9: EXPONENTS, ROOTS, AND EQUATIONS11videos
PROBLEM SETS
- BOOK - PRINCETONCHAPTER - PROBLEM SETSEXERCISE - PROBLEM SET 10: LINES, ANGLES, AND COORDINATES11videos
PROBLEM SETS
- BOOK - PRINCETONCHAPTER - PROBLEM SETSEXERCISE - PROBLEM SET 7: AVERAGES, RATIOS, PROPORTIONS, AND PROBABILITIES11videos
PROBLEM SETS
- BOOK - PRINCETONCHAPTER - PRACTICE TEST 4EXERCISE - Math Test-Calculator38videos
PRACTICE TEST 4
- BOOK - PRINCETONCHAPTER - SAT MATH: THE BIG PICTUREEXERCISE - Example4videos
SAT MATH: THE BIG PICTURE
Similar Questions
Knowledge Check
- Question 1 - Select One
Which of the following does not show diagonal relationship between beryllium and aluminium?
ABoth BeO and Al2O3 are amphoteric in nature.BBoth beryllium and aluminium form polymeric covalent hydrides.CBoth beryllium and aluminium form nitrides with nitrogen which evolve NH3 with water.DBoth metal carbonates are highly stable. - Question 2 - Select One

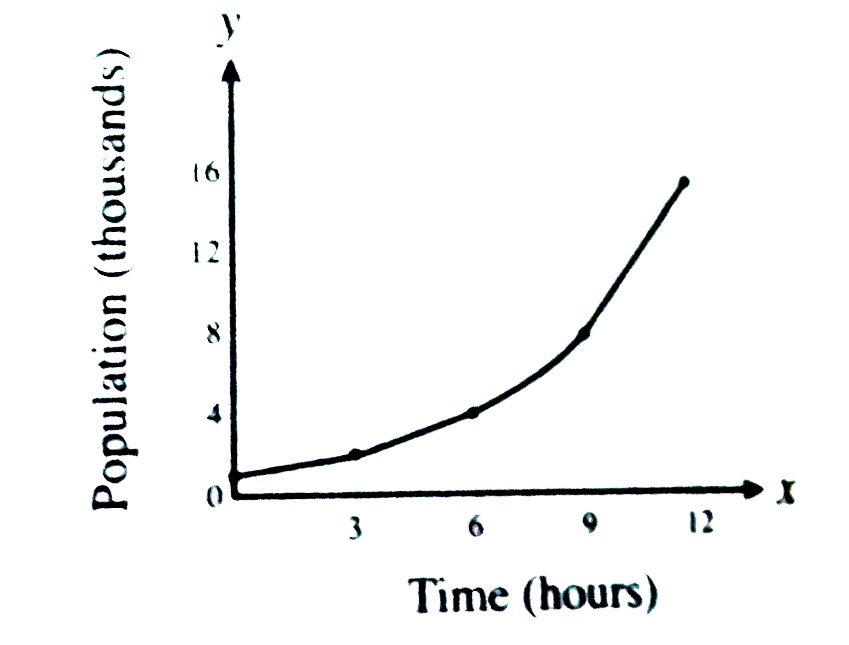
The graph above shows the size of a certain population after time t. Which of the following equations correctly shows y as a function of t ?Ay=t3By=1.000−2t3Cy=3t2Dy=1,000t-2,000 - Question 3 - Select One

Which of the following equations relates y to x for the values in the table above?Ay=12.(52)xBy=2.(34)xCy=34x+2Dy=72x−34
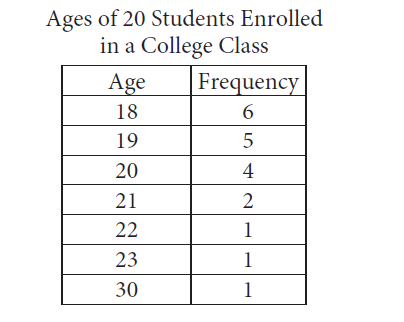
Ages of 20 Students Enrolled in a College Class

The table above shows the distribution of ages of the 20 students enrolled in a college class. Which of the following gives the correct order of the mean, median, and mode of the ages?View SolutionWhich of the following graphs best shows a strong negative association between d and t ?
View SolutionStudent studying motion observed a cart rolling at a constant rate along a striaght line. The table below gives the distance, d feet, the cart was from a reference point at 1-second intervals from t = 0 seconds to r = 5 seconds.

Which of the following equations represents this relationship between d and t?View Solution
The table above provides values for the function g for selected values of t. Which of the following defines the function g?View Solution
The table above shows a few values of the linear function f. which of the following equations defines f?View Solution

